Education

XAUUSD – Weekly Recap: Gold Testing Key Trendline XAUUSD – Weekly Recap: Gold Testing Key Trendline
Gold closed the week at a critical resistance zone after a strong bullish recovery from the lower accumulation area.
Price is currently around 4,376 and is pressing into the long-term downtrend line but has not confirmed a breakout above 4,443 yet. The structure is improving, but confirmation is still needed.
WEEKLY SUMMARY
Gold showed strong bullish momentum this week, holding above key support and pushing from the 4,180 – 4,200 zone toward 4,400+.
However, momentum slowed at the 4,443 resistance and trendline area, showing that sellers are still active at this level.
Overall: short-term bullish, but long-term trendline still intact.
FUNDAMENTAL VIEW
Gold remains supported by safe-haven demand, central bank buying, and expectations of a less aggressive Fed.
Risks still come from USD strength, rising yields, and inflation shifts, which may trigger pullbacks near resistance.
TECHNICAL VIEW (SMC + FIB)
Gold has shown bullish displacement from the accumulation zone and is now testing a major supply + trendline confluence at 4,443.
A breakout above this level opens the path toward liquidity at 4,660.
A rejection could send price back into the buy zone at 4,183 for a healthy retracement.
KEY LEVELS
Current Price: 4,376
Buy Zone: 4,183
Support Zone: 4,300 – 4,320
Trendline Resistance: 4,443
Major Liquidity Target: 4,660
Bullish Confirmation: Above 4,443
Structure Valid: Above 4,183
Bearish Invalidation: Below 4,183
TRADING SCENARIOS
Buy Setup (Pullback)
Zone: 4,183 – 4,320
SL: Below 4,183
TP1: 4,443
TP2: 4,660
Buy Setup (Breakout)
Condition: Break & retest above 4,443
Target: 4,660
Sell Setup (Rejection)
Zone: 4,443
SL: Above swing high
TP1: 4,300
TP2: 4,183
VIEW
Gold is stronger than before, but still stuck under a key decision level.
4,443 is the gate:
* Break → continuation to 4,660
* Reject → pullback to 4,300 / 4,183
No chase. Wait for confirmation.
 Short
Short
Elliottt Wave Principle : Understanding ZIGZAGChartTheWave IPO Watch (IV) : Understanding Zigzag – Groww
"An initial 5-wave downward movement is not the end of the correction, it is only a part of the larger one".
Under the Elliott Wave Principle, after a 5-wave impulse movement, a stock will undergo a corrective movement, generally labelled A-B-C. There are three primary forms of correction:
(1) Zigzag, (2) Flat and (3) Triangle. These primary corrective structures can also combine to form more complex corrections, known as Double Threes (WXY) and Triple Threes (WXYXZ), which we have covered in earlier educational posts. Today, let us understand a basic Zigzag correction using the example of Groww.
Groww – From Impulse to Correction
After its debut on the stock exchange on 12 November 2025, Groww completed a five-wave impulse on 29 April 2026. Interestingly, the primary impulse itself provides another practical example of the Wave 1 Extension variation discussed in our recent educational post:
Wave 1 was an extended wave.
Wave 3 was also extended.
Wave 3 terminated at approximately 1× the length of Wave 1.
Wave 5 also terminated at approximately 1× the length of Wave 1.
The stock then entered a corrective phase from 29 April 2026. This gives us an opportunity to understand one of the three primary corrective structures — the Zigzag.
What is a Zigzag?
A Zigzag is a 5-3-5 sequence, labelled A-B-C.
Wave A develops as a 5-wave impulse.
Wave B develops as a 3-wave corrective structure.
Wave C develops as another 5-wave impulse. This is the reason why an initial 5-wave downward movement is never end of the correction, but only part of the larger one.
Zigzags generally produce a deep correction . Wave A and Wave B can be different in size, although they may also be approximately equal.
Key Takeaway
The most important structural principle in a Zigzag is: Wave C must make a lower low than Wave A, or at least an equal low. It cannot terminate above the end of Wave A.
This principle helps an analyst determine the minimum level Wave C must reach before the Zigzag can be considered complete.
In the case of Groww, Wave A ended around ₹180. Therefore, Wave C must reach ₹180 or below before the correction can be considered complete.
What does the internal structure tell us?
Interestingly, Wave C itself is developing as a Wave 1 Extension . Based on the Wave 1 Extension behaviour discussed in our earlier educational post, Wave C could potentially terminate around:
61.8% TBFE – approximately ₹179
78.6% TBFE – approximately ₹174
Therefore, ₹180 is an important structural level to watch, while the ₹174 area represents a possible deeper Fibonacci projection if the extension continues.
ChartTheWave Learning
This example demonstrates how Elliott Wave analysis can be built progressively:
Completed impulse → Correction begins → Identify the corrective structure → Confirm Zigzag → Analyse Wave C → Apply Fibonacci relationships.
And once again, a concept we studied earlier—the Wave 1 Extension variation—appears naturally within the new structure.
Educational purpose only. This is not a buy or sell recommendation.  Education
XAUUSD — 4,376 Is the Trap Door XAUUSD — 4,376 Is the Trap Door
Gold gave us a very active week, and the story is actually quite clean when we step back from the noise.
Earlier in the week, buyers were clearly in control. Price broke structure multiple times, pushed through the old resistance, and climbed strongly toward the 4,400 - 4,450 area. That move was powerful, but after gold touched the upper part of the bullish channel, the market started to slow down. Then came the important shift: price lost the clean upward rhythm, printed ChoCH, and pulled back from the highs.
For newer traders, this is where the chart becomes interesting. A strong bullish week does not mean price has to keep rising in a straight line. After a big expansion, the market often needs to breathe back into a fairer zone before deciding whether buyers are still waiting.
Right now, my main view is bearish for a short-term pullback while gold stays below 4,376.820. This area looks like a possible trap door. If price rejects here, sellers may use this small recovery to guide gold back toward 4,310.372 first, then the deeper buy zone around 4,260.183 - 4,261.513.
That lower zone is important because it sits near the FVG and the area where buyers may try to reload after the weekly rally. So I am not treating this as a full bearish reversal yet. I see it more as a correction after a strong bullish run.
This pullback idea becomes weak only if gold reclaims 4,376.820 and holds above it. That would tell me sellers failed to defend the retracement area.
Key price zones to watch
Current reaction area: 4,360 - 4,376.820
Main supply / short-term sell zone: 4,360 - 4,376.820
Bearish confirmation zone: clean rejection below 4,376.820
First downside target: 4,310.372
Main demand / buy zone: 4,260.183 - 4,261.513
FVG reaction zone: 4,260 - 4,290
Lower support if demand fails: 4,220 - 4,240
Invalidation: clean reclaim and hold above 4,376.820
After this strong bullish week, do you see this as a healthy pullback into the buy zone, or do you think buyers can defend 4,310 before price reaches 4,260?
Short 
XAUUSD — 4,365 May Trap the Bounce XAUUSD — 4,365 May Trap the Bounce
Gold is ending the week with a very different feeling from the strong rally we saw earlier.
Price pushed hard into the 4,450 area, but instead of holding that high ground, it started sliding lower for the second day in a row. That kind of reaction tells me buyers are no longer moving with the same confidence. The market climbed fast, touched a premium area, then began giving back the move — almost like gold needed to cool down after running too far above the structure.
For newer traders, this is where the chart becomes easier to understand. A strong uptrend can still have a deep pullback, but when price breaks below short-term support and starts forming lower reactions, we should stop chasing the old bullish candle and watch where sellers may reload.
Right now, my main view is bearish for a pullback while gold stays below 4,365.616. That level sits near the sell zone and could become the place where price retests before moving lower again. If gold bounces into 4,350 - 4,365 and rejects, I would see that as the market using the bounce to trap late buyers before continuing toward the main demand zone.
The broader context also supports caution. Geopolitical uncertainty is keeping safe-haven demand for the USD alive, and that can pressure gold even while Fed hike expectations soften. So for me, this is not a place to force bullish continuation yet.
If sellers keep control, the next downside area I am watching is the main demand zone around 4,235 - 4,250. That zone may wake buyers up again, but until price reaches it or reclaims the sell zone cleanly, the short-term story still leans lower.
This bearish pullback idea becomes weak if gold reclaims 4,365.616 and holds above it. A stronger bullish recovery would need price to push back into the supply retest zone around 4,420 - 4,450.
Key price zones to watch
Current reaction area: 4,300 - 4,325.760
Main supply / sell zone: 4,350 - 4,365.616
Supply retest zone: 4,420 - 4,450
Bearish confirmation zone: rejection below 4,365.616
First downside target: 4,300
Main demand zone: 4,235 - 4,250
Lower support if demand fails: 4,200 - 4,210
Invalidation: clean reclaim and hold above 4,365.616
Do you see this drop from 4,450 as the start of a healthy pullback, or is gold already setting a trap before another push higher?
Short 
XAUUSD: ABC Recovery Strengthens Above 4,330Gold is showing a corrective recovery after the previous bearish wave completed near the lower area. From Kelly’s view, the current chart suggests that XAUUSD may be forming an ABC rebound structure, with buyers trying to defend the 4,330–4,340 zone before pushing price higher.
The key idea is simple: gold is recovering, but this still looks like an ABC correction, not a full bullish reversal yet.
⟡ Market structure
The chart shows gold completed a sharp bearish 5-wave decline from the upper area, then reacted strongly from around 4,310. After that, price started to build a recovery structure and is now trading around 4,350.
The nearest important support is the Buy wave B zone around 4,330–4,340. If gold pulls back into this area and buyers continue to defend it, the market may form wave B and prepare for wave C higher.
The next resistance is around 4,360–4,370, marked as the sell scalping area. If price breaks above this zone with strength, the recovery may continue towards 4,395–4,405, where the chart marks the possible End wave ABC area.
➤ Key levels
◌ 4,330–4,340: Buy wave B zone and key support
◌ 4,350: current price reaction area
◌ 4,360–4,370: sell scalping / short-term resistance
◌ 4,395–4,405: End wave ABC target zone
◌ 4,310: recent wave 5 low and structure protection
◌ Below 4,310: area where the recovery setup weakens
⌁ Elliott Wave view
From an Elliott Wave perspective, gold appears to have completed a bearish 5-wave sequence before starting the current recovery.
Wave A is forming from the 4,310 low into the current reaction area. Wave B may pull back into the 4,330–4,340 buy zone. If wave B holds, wave C may continue higher towards 4,360–4,370 first, then 4,395–4,405.
This is why Kelly is watching the current recovery as an ABC correction. The move can still rise, but buyers need to protect the wave B support before the next bullish leg becomes cleaner.
▸ Trading scenario
Preferred scenario: wait for gold to pull back into the Buy wave B zone and show bullish confirmation.
Entry zone: 4,330–4,340 if bullish confirmation appears Stop loss: below the confirmed wave B low or below 4,310 Take profit 1: 4,360–4,370 Take profit 2: 4,395–4,405 Take profit 3: higher only if price breaks the ABC target with strong momentum
Alternative scenario: if gold breaks below 4,310 with strong bearish pressure, the ABC recovery setup weakens. In that case, price may return to a deeper bearish continuation before building a new support base.
⌁ Kelly’s view
For Kelly, gold is currently in a recovery phase after a bearish wave. The short-term structure supports an ABC rebound, but the clean setup is still to wait for price to confirm support around 4,330–4,340.
Gold may continue its corrective rise. If Buy wave B holds, wave C may target the 4,395–4,405 area.
Share your view below. Long 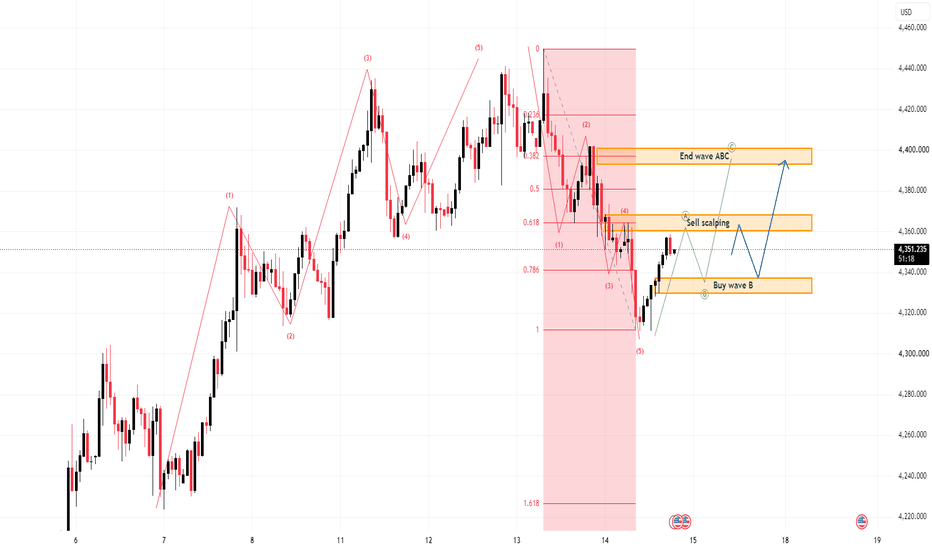
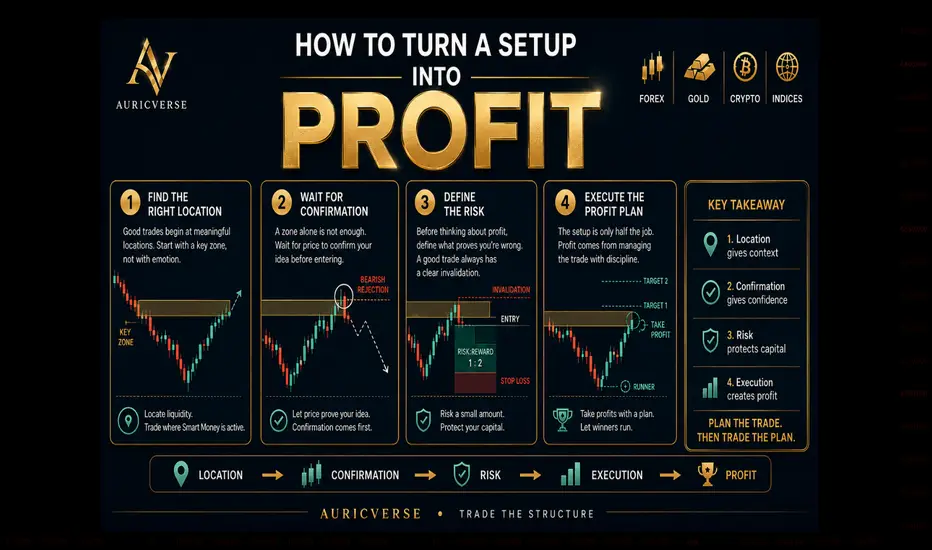
How To Turn Setup Into Profit - 4 Step TradingA good setup is only the beginning. Many traders can read a chart correctly and still lose money because the problem comes after the analysis - poor location, rushed entries, oversized risk, or bad trade management.
Here is the framework I use to keep things simple:
1️⃣ Location comes first
Don’t trade just because you see a pattern. Start with a meaningful area: support, resistance, liquidity, trendline, or another key zone. A strong signal in the wrong place is still a weak trade.
2️⃣ Let price confirm the idea
A zone is not an entry by itself. Wait for rejection, a structure shift, breakout confirmation, or another clear sign that buyers or sellers are actually stepping in.
3️⃣ Define the risk before thinking about profit
Know exactly where the trade is wrong before entering. Your stop should sit beyond the invalidation point, while position size keeps the loss manageable. Aiming for at least 1:2 R:R gives the trade room to make mathematical sense over time.
4️⃣ Execute the profit plan
The trade is not finished once you enter. Know where you will take partial profit, where the main target sits, and whether part of the position should be left to run. Constantly changing the plan usually turns a good setup into a poor result.
🧠 AURICVERSE Takeaway
Location → Confirmation → Risk → Execution → Profit
The goal is not to find more trades. It is to make better decisions on the trades that already deserve your attention.
Plan the trade. Then trade the plan. Education 
XAU/USD - Sellers Pull Gold Back to 4,245?Hi traders, is this break of the trendline a pullback or the start of a deeper correction?
After a series of clear higher highs, OANDA:XAUUSD has broken down the ascending trendline and is currently trading below the Ichimoku cloud. To me, this signals that short-term momentum has shifted to the sellers.
The 4,345–4,375 region is currently a key area to watch if the price rebounds. If buyers fail to reclaim this area and a rejection occurs, I still favor a further decline to:
🎯 Target: 4,247
I don't want to chase the price at the current level. A failed retest of the sell zone would create a cleaner structure.
The bearish scenario will weaken if the H1 chart regains 4,375 and returns above the Ichimoku cloud.
AURICVERSE View: The trendline has been broken, but the interesting part isn't chasing the drop — it's how the price reacts if it returns to 4,345–4,375.
How are you reading this structure? Share your view below. Short 
Education 
NIFTY – Wave 4 Triangle | D-Wave Liquidity Sweep & Wave ENIFTY is currently in Wave 4, where a potential triangle formation appears to be developing.
In Elliott Wave theory, a triangle consists of five waves:
A → B → C → D → E
At present, my interpretation is that Wave D is in progress.
The key level I am watching is the previous high at 26,373.20.
If price breaks above 26,373.20, takes the liquidity resting above this high, and subsequently shows rejection/weakness, I will consider this as a potential buy-side liquidity sweep completing Wave D.
Following the completion of Wave D, the next expected phase would be Wave E.
Based on the current structure, I am watching the 23,070.15 area as an important potential Wave-E zone.
If the A-B-C-D-E triangle structure completes as anticipated, the larger structure could then transition toward Wave 5.
Key Levels
🔴 26,373.20 — Previous high / Buy-side liquidity
🟡 23,070.15 — Potential Wave-E zone
🔵 After A-B-C-D-E completion → Potential Wave 5
My approach is based on:
Elliott Wave + Liquidity Sweep + Key Levels + Price Confirmation
I am not trying to predict every move. I am interested in how price reacts when it reaches important liquidity and structural levels.
Level → Liquidity → Confirmation
Disclosure
I am not a SEBI-registered Investment Adviser or Research Analyst. This post represents my personal technical/chart analysis for educational and informational purposes only and should not be considered personalized investment advice, a recommendation to buy or sell securities, or a guarantee of future price movement. Please conduct your own research and make independent decisions according to your risk profile.
#NIFTY #ElliottWave #LiquiditySweep #TechnicalAnalysis #MarketStructure  Long
Long
XAUUSD – Gold Breaks Lower, 4,346 Becomes The Key Sell Zone XAUUSD – Gold Breaks Lower, 4,346 Becomes The Key Sell Zone
Gold is showing clear short-term weakness after failing to hold the higher structure.
Price is currently trading around 4,332 after breaking below the previous support area near 4,346. This level is now very important because it may act as resistance if gold attempts a recovery.
The chart is no longer showing clean bullish continuation. Sellers have taken short-term control, and the next reaction around 4,346 may decide whether gold continues lower toward 4,263.
FUNDAMENTAL ANALYSIS
Gold prices also softened in India, showing that the recent weakness is not only visible on the chart but also reflected in physical-market pricing.
According to the data provided, gold fell from 13,343.67 INR per gram to 13,265.91 INR per gram, while the tola price also declined from 155,637.90 INR to 154,733.00 INR.
This supports the current cautious tone. Buyers are not fully confident, and short-term pressure remains active unless gold can reclaim key resistance.
TECHNICAL ANALYSIS – SMC + FIBONACCI
From an SMC perspective, gold has broken below the previous support and shifted into a weaker short-term structure.
The 4,346 zone was support before, but after the breakdown, it may now become a sell reaction zone. If price retests this area and rejects, sellers may continue to push gold lower.
The nearest low is around 4,311. If this level fails, the next important downside target is the Fibonacci reaction zone around 4,263.
This 4,263 area is important because it aligns with the larger support structure and may attract buyers for a possible reaction. Until price reaches that zone, sellers still have the stronger short-term structure.
KEY PRICE ZONES
Current price: 4,332
Sell zone / broken support: 4,346
Nearest low: 4,311
Fibonacci support target: 4,263
Deeper liquidity support: 4,222
Bearish pressure valid: Below 4,346
Short-term recovery signal: Above 4,346
Invalidation for sell view: Above 4,360
TRADING SCENARIOS
Sell Scenario – Priority View
Sell Zone: 4,346
Entry: Bearish rejection, failed reclaim, lower-timeframe bearish CHoCH, or strong bearish reaction from the sell zone
SL: Above 4,360 or above the nearest swing high
TP1: 4,311
TP2: 4,263
TP3: 4,222 if bearish momentum expands
Breakdown Sell
Condition: Clean break below 4,311
Target: 4,263 first, then 4,222
Buy Scenario – Only Short-Term Reaction
Buy is not the priority while gold stays below 4,346.
Buy Zone: 4,263
Entry: Liquidity sweep, bullish rejection, or lower-timeframe bullish CHoCH
TP1: 4,311
TP2: 4,346
Invalidation: If price breaks and holds below 4,263, the buy reaction becomes weaker.
MY VIEW
Gold is under short-term selling pressure.
The break below 4,346 changed the structure, and this level is now the main area to watch. If price retests 4,346 and fails to reclaim it, the downside path toward 4,311 and 4,263 remains open.
For now, I do not want to chase the middle. I want to see the reaction around 4,346 first.
Gold is weak today — but the real question is whether sellers can defend the broken support.
Do you think gold will reject from 4,346 and continue toward 4,263, or will buyers reclaim this zone first?
Short 
Nilkamal: Will Alternation Lead to the Next Trend Expansion?Nilkamal has been one of the stronger trending stocks over the past few weeks, with price advancing in a well-defined impulsive structure while respecting its rising trend channel.
One aspect of this chart that caught my attention is the contrast between Wave (ii) and the current Wave (iv).
Wave (ii) was relatively sideways and time-consuming, allowing the market to consolidate before the trend resumed. In contrast, the current Wave (iv) has been a sharp price correction, retracing quickly after the strong momentum seen in Wave (iii). This is a good illustration of Guideline of Alternation , which suggests consecutive corrective waves often differ in both form and character.
From a price structure perspective, the stock is now approaching an important confluence of support:
1. 38.2% Fibonacci retracement of the previous impulse
2. Upper/Middle boundary of the short-term rising channel
This is the zone where I would expect buyers to defend the prevailing trend if the bullish structure remains intact.
The strongest participation occurred during the impulsive advance into Wave (iii), while the current pullback has not shown the same level of aggressive selling. In healthy trends, corrections often develop with relatively lighter participation compared to impulsive advances.
If price stabilises around the highlighted support zone and regains momentum, the broader trend structure could remain constructive. On the other hand, a decisive breakdown below this confluence would weaken the current wave count and require a fresh assessment.
The objective is not to predict every move but to identify areas where market structure, trend, and risk are aligned.
Educational analysis only. Not investment advice.  Long
Long
XAUUSD: Bearish Elliott Setup Below 4,410Gold is showing signs of short-term weakness after failing to extend cleanly above the upper reaction area. From Kelly’s view, the current chart suggests that XAUUSD may be forming a bearish Elliott structure, with price now preparing for a possible continuation lower if the Sell wave 3 zone continues to hold.
The key idea is simple: gold may still rebound slightly, but the structure favours downside continuation while price remains below resistance.
⟡ Market structure
The chart shows gold reacted strongly from the previous bullish move, but buyers are now losing momentum near the 4,380–4,400 area. Price is currently trading around 4,380, directly under the marked Sell wave 3 zone.
This area is important because it may act as the next bearish reaction point. If gold retests 4,395–4,410 and sellers defend that zone, the market may continue lower towards the 4,330–4,345 buy zone first.
If bearish pressure expands, the next deeper target is around 4,270–4,285, where the chart marks the possible End wave 5 area.
➤ Key levels
◌ 4,395–4,410: Sell wave 3 zone and main resistance
◌ 4,380: current price reaction area
◌ 4,360–4,365: short-term support / first bearish checkpoint
◌ 4,330–4,345: buy zone and wave 3 target area
◌ 4,270–4,285: End wave 5 target zone
◌ Above 4,420: area where the bearish setup starts to weaken
⌁ Elliott Wave view
From an Elliott Wave perspective, gold may be starting a new bearish 5-wave sequence after the recent bullish recovery slowed down.
Wave 1 may be forming from the current rejection area.
Wave 2 may create a small rebound back into the 4,395–4,410 sell zone.
Wave 3 could then push price lower towards the 4,330–4,345 buy zone.
Wave 4 may create a short corrective rebound from that support.
Wave 5 may continue towards 4,270–4,285 if sellers keep control.
This is why Kelly is not treating the current rebound as a strong bullish continuation yet. The market is still below a key resistance zone, and the Elliott structure is leaning bearish.
▸ Trading scenario
Preferred scenario: wait for gold to retest the Sell wave 3 zone and show bearish confirmation.
Sell zone: 4,395–4,410 if rejection appears
Stop loss: above the confirmed rejection high or above 4,420
Take profit 1: 4,360
Take profit 2: 4,330–4,345
Take profit 3: 4,270–4,285
Alternative scenario: if gold breaks above 4,420 and holds strongly, the bearish Elliott setup weakens. In that case, price may continue a larger bullish recovery before a new sell structure becomes clear.
⌁ Kelly’s view
For Kelly, gold is now in a bearish reaction structure. The current price is below the main sell zone, and the next clean setup is to wait for rejection before following the downside wave.
Gold may still bounce first.
But if 4,395–4,410 holds as resistance, the next Elliott move may continue lower towards 4,330 and 4,280.
Share your view below. Short 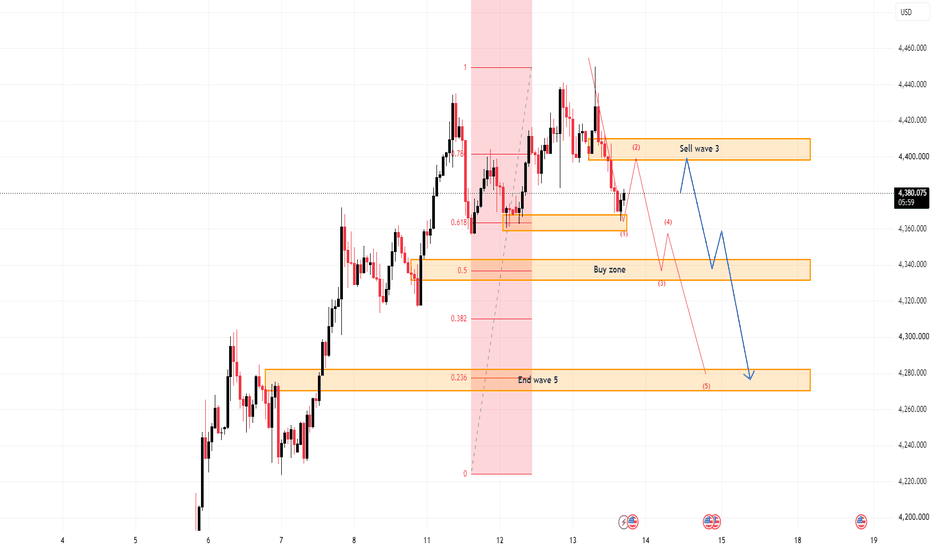
XAUUSD — 4,400 Is the Breathing Point XAUUSD — 4,400 Is the Breathing Point
Gold has pulled back from its 10-week high, but the chart still does not look like a market that has fully lost control. To me, it feels more like buyers are letting price breathe after a strong bullish run.
Price already gave us a clean bullish story earlier: multiple BOS signals, strong expansion, and a push above the 4,400 area. That kind of move tells us buyers were not just reacting from the lows; they were actively driving price into higher liquidity. Now gold is hovering around 4,409.800, and this is where newer traders need to slow down a little. A pullback after a strong rally is not automatically bearish. Sometimes it is simply the market coming back to test where real demand is waiting.
The important part is the structure. Gold is still holding above the recent bullish range, and the FVG near 4,370 - 4,390 is the first area I want to watch. If price dips into that zone and reacts, it may show that buyers are still defending the trend. Below that, the pullback buy zone around 4,330 - 4,345 becomes the cleaner area where the market may try to reload before another upside attempt.
My main view is still bullish while gold holds above the pullback buy zone. The broader picture also supports caution rather than panic: USD has found some safe-haven support from US-Iran tension, but the daily structure for gold still leans toward buyers, especially if the expected Bull Cross confirms.
If gold holds above 4,330 - 4,345, I would watch for another push back toward 4,433.545 first, then higher liquidity around 4,460 - 4,500. This bullish idea becomes weaker if price loses 4,300 and fails to recover, because that would open the door for a deeper demand retest before buyers can rebuild.
Key price zones to watch
Current reaction area: 4,400 - 4,410
Main demand / FVG zone: 4,370 - 4,390
Pullback buy zone: 4,330 - 4,345
Deep demand retest: 4,300 - 4,315
Bullish confirmation zone: clean reclaim above 4,433.545
First upside liquidity target: 4,433.545
Main upside target: 4,460 - 4,500
Lower support if buyers fail: 4,022.209
Major lower defence: 3,992.831
Invalidation: clean close below 4,300
Do you see this pullback from 4,400 as a healthy reset before continuation, or do you think gold needs one deeper retest into 4,300 first?
Short 
ETHUSDT: Bearish setup remain, Next target sessionETHUSDT is trading around 1,890 USDT; while it has staged a slight recovery following a sharp drop, it has yet to reclaim higher price levels. Reuters reports that Ether has seen only modest gains as the market awaits tonight's US CPI data.
Macroeconomic factors currently favor a bearish scenario, with the DXY edging up and investors remaining cautious ahead of the inflation figures. Should the CPI exceed expectations, expectations of a Fed rate hike could resurge, placing further pressure on the cryptocurrency market.
On the 1-hour (H1) chart, the 1,887–1,903 USDT range is acting as a "sell zone," while the EMA89 near 1,894 continues to exert downward pressure. If ETH attempts to rally but faces rejection at this level, I lean towards the price retracing to the 1,855–1,865 USDT range.
Will the 1,900 level continue to hold the line for the bulls, or will tonight's CPI data trigger a breakout?  Short
Short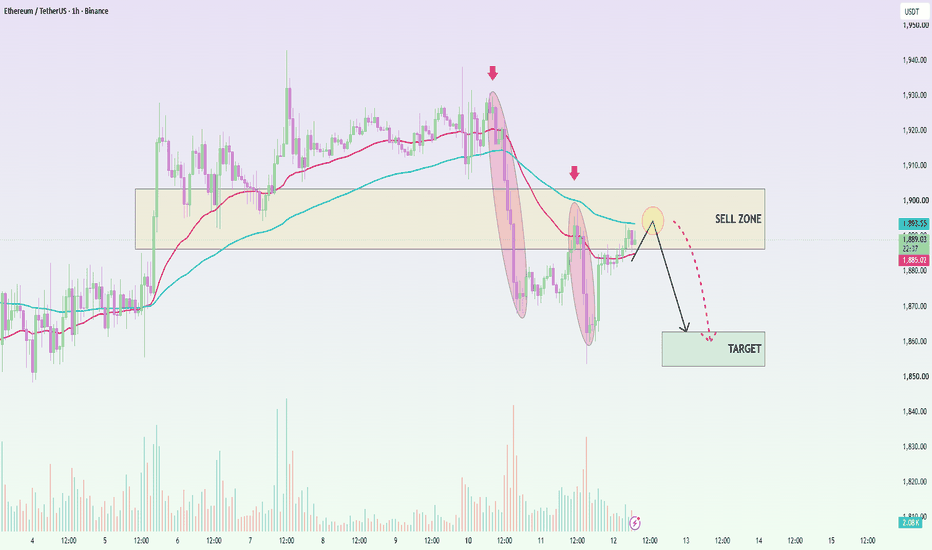
BTCUSDT: Sell Zone, Price Under PressureBitcoin is currently trading around $63,600–$63,650, down approximately 0.35% for the day, having touched a low of $63,204.
Macroeconomic factors continue to favor a bearish scenario as the market awaits US CPI data. The DXY has edged up to around 99.9, while investor opinion remains split on whether the Fed will hold rates steady or hike them in September.
On the 2-hour (H2) chart, BTCUSDT has broken down from its rising channel and remains below the EMA34 and EMA89. The $64,000–$64,500 USDT range is a notable sell zone; if the price attempts a rebound but faces rejection, I lean towards the likelihood of a further decline to $62,600 USDT.  Short
Short
The Midpoint Nobody Watches: Equilibrium, Flip Zones, PatternsThis post is educational and observational in nature based on historical price action. It is not a forecast or a trading recommendation.
Flip Zone (Green)
A price level that once acted as resistance and, after being broken and sustained above, converted into support. This shift in role is what defines a flip zone.
Equilibrium Point
The midpoint calculated between the biggest swing low and the biggest swing high on the chart. This level divides the overall range into two equal halves and is often used as a reference point to gauge whether price is trading in the upper or lower half of a larger structural move.
Symmetrical Triangle Pattern
A consolidation pattern formed between converging lower highs and higher lows, compressing into a tighter range over time. In this case, the pattern formed directly between the flip zone and the equilibrium point, sitting within that broader structural context rather than in isolation.
The Bigger Picture
This chart brings together three layers of context, a flip zone marking a change in level behavior, an equilibrium point marking the midpoint of the larger swing, and a symmetrical triangle forming in the space between them. Studying where a pattern forms relative to the broader range it sits within, rather than looking at the pattern alone, offers a much deeper read of the chart's structure.  Long
Long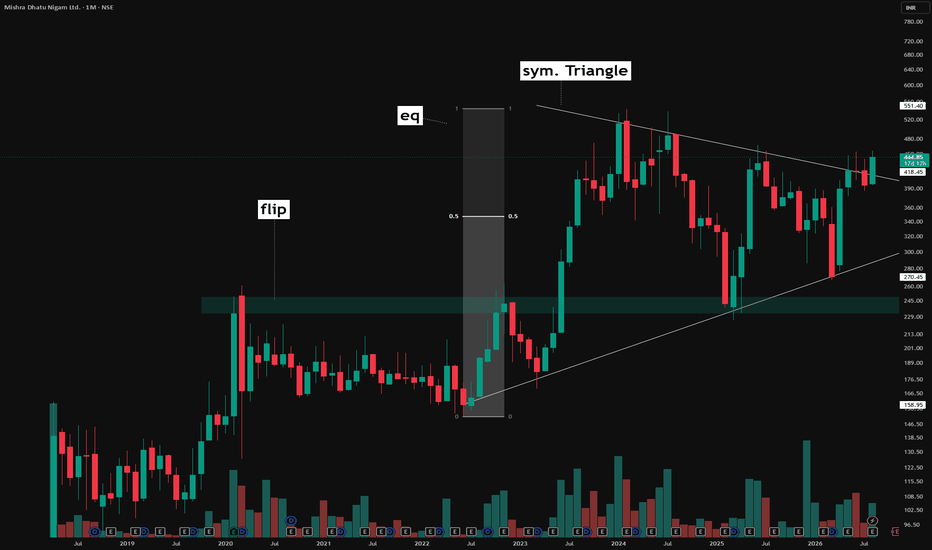
 Long
Long
XAUUSD: Price Targets Higher LevelsXAUUSD is trading around $4,379, down approximately 0.42% on the 4-hour (H4) chart after facing rejection at the $4,440 level. Reuters also reported a roughly 0.5% decline in spot gold, driven primarily by profit-taking following a rally to a more than two-month high.
Macroeconomic factors remain slightly supportive of gold, as cooling US CPI data has lowered expectations for a Federal Reserve rate hike in September.
On the H4 chart, the price remains within an upward channel and above the EMA34 and EMA89. I am keeping a close watch on the $4,260–$4,340 zone; should a pullback to this area trigger renewed buying pressure, the bullish structure would remain intact, potentially opening the way for a move toward the $4,550–$4,600 range.
Do you think gold will retest the "Buy Zone" before pushing toward $4,600? Long 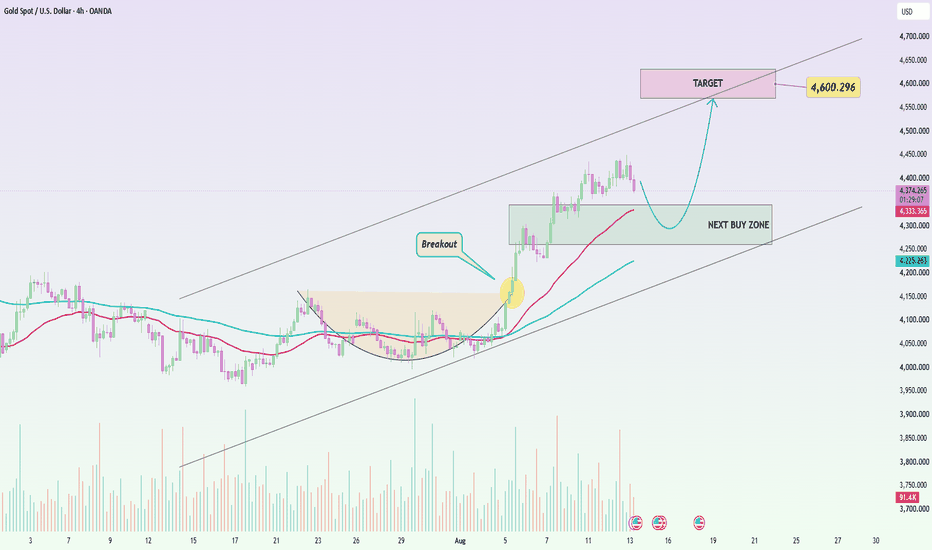
XAUUSD – Gold Holds The Channel, But 4,438 Is The Next Real TestXAUUSD – Gold Holds The Channel, But 4,438 Is The Next Real Test
Gold is still holding a strong short-term bullish structure.
Price is currently trading around 4,388 after moving inside a clean rising channel. Buyers are still defending the trendline area, and the market has not shown a confirmed bearish break yet.
However, gold is now approaching an important resistance ladder. The next reaction around 4,438 and 4,487 will decide whether this bullish wave continues higher, or whether sellers start to create a deeper pullback.
FUNDAMENTAL ANALYSIS
Gold remains supported by strong demand from central banks and positive speculative positioning.
The latest market tone suggests that institutional demand is still active, while CTA and fund positioning remain supportive for precious metals. This shows that gold is not only moving from short-term technical momentum, but also from broader market confidence.
At the same time, inflation expectations, oil prices, and Fed policy remain important risks. If inflation data comes in hotter than expected or the Fed becomes more hawkish, gold may face pressure near resistance.
For now, the fundamental background still supports the bullish structure, but price is close to zones where reaction matters.
TECHNICAL ANALYSIS – SMC + FIBONACCI
From an SMC perspective, gold is moving inside a rising channel with a clear higher-high and higher-low structure.
The current Buy Zone + trendline area around 4,389 is the key short-term support. As long as price holds this zone, buyers still have control.
The first upside level is the liquidity area around 4,416. If gold breaks and holds above this level, price may continue toward the Sell Scalping Resistance around 4,438.
Above that, the larger Fibonacci Sell Zone sits around 4,487. This is a stronger resistance area and may create a short-term reaction if buyers lose momentum there.
The structure is simple: gold is bullish while it holds the channel, but buying directly into resistance needs confirmation.
KEY PRICE ZONES
Current price: 4,388
Buy Zone + trendline: 4,389
Strong support: 4,356
Liquidity level: 4,416
Sell scalping resistance: 4,438
Fibonacci sell zone: 4,487
Bullish structure valid: Above 4,356
Short-term bullish confirmation: Above 4,416
Invalidation for bullish view: Below 4,356
TRADING SCENARIOS
Buy Scenario – Priority View
Buy Zone: 4,356 – 4,389
Entry: Bullish reaction, trendline retest, liquidity sweep, or lower-timeframe CHoCH
SL: Below 4,356 or below the nearest swing low
TP1: 4,416
TP2: 4,438
TP3: 4,487
Breakout Buy
Condition: Break and hold above 4,416
Target: 4,438 first, then 4,487 if momentum continues
Sell Scenario – Reaction From Resistance
Sell Zone: 4,438 – 4,487
Entry: Bearish rejection, failed breakout, or lower-timeframe bearish CHoCH
SL: Above the rejection swing high
TP1: 4,416
TP2: 4,389
TP3: 4,356
Breakdown Sell
Condition: Clean break below 4,356
Target: Deeper correction below the rising channel
MY VIEW
Gold is still bullish, but the market is not in a perfect chasing area.
The rising channel is holding well, and buyers continue to defend the trendline. If gold stays above 4,356 – 4,389, the next upside path toward 4,416 and 4,438 remains open.
But I will watch carefully near 4,438 and 4,487. These are not small levels. They are resistance zones where sellers may try to react.
For now, gold still has bullish strength — but the next real confirmation is above 4,416.
If buyers break that level cleanly, 4,438 and 4,487 become the next targets. If price loses 4,356, the bullish channel becomes weaker.
Do you think gold can break above 4,416 and continue toward 4,487, or will sellers defend the Fibonacci resistance zone?
Long 
 Short
Short