Gold Short-Term Elliott Wave Analysis | Outlook for Diwali, 2026Wrap-up:-
As discussed in my previous Gold Analysis, Gold appears to have completed a Major Wave 1 at $5598 . The market is now undergoing Major Wave 2 , which is developing in a A-B-C corrective structure .
Current Elliot Wave Structure
With this correction,
Wave A concluded at $4402.
Wave B is currently unfolding.
Within Wave B :
Wave W concluded at $5419.
Wave X concluded at $3942.
Wave Y is currently unfolding.
The internal structure of the ongoing Wave Y is is currently interpreted as follows:
Internal Wave A: Concluded at $4203.
Internal Wave B is approaching completion and will be considered confirmed only after Gold registers a decisive breakout and sustains above $4411 .
Upon confirmation of Internal Wave B , the market is expected to transition into Internal Wave C , with a projected upside objective in the $4966-$5101 Range.
What I'm Watching | Till Diwali, 2026
The immediate focus remains on the completion and confirmation of Internal Wave B .
If the current Elliott Wave count remains valid and Gold sustains above $4411 , it would increase the probability of Internal Wave C commencing.
Historically, Wave C often develops as the strongest and most directional leg within an ABC corrective sequence , making this an important phase to monitor.
A sustained move above the identified resistance levels would further strengthen the bullish outlook.
Key Levels to Watch
Immediate Support: $4,230–$4,169
Bullish Projection: $4,966–$5,101 (subject to confirmation of the Bullish wave structure)
Primary Trend Bias: Bullish, as long as the current Elliott Wave structure remains valid.
Professional View
The broader structure continues to favor a bullish outlook, provided Gold holds the immediate support zone and the current Elliott Wave count remains intact.
Although short-term volatility may continue during the final stages of Major Wave 2, sustained price action above the key support levels would strengthen the probability of a subsequent impulsive advance toward higher resistance zones.
The key principle remains confirmation over anticipation. Traders should closely monitor price action around the identified Fibonacci and structural levels and reassess the wave count if those levels are decisively violated.
Disclaimer: This analysis reflects my personal interpretation of the market using Elliott Wave Theory and is shared strictly for educational purposes only. It should not be considered financial or investment advice.
"Don't predict the market. Decode it."  Long
Long
XAU/USD - Control Wave, Bulls Waiting BreakoutOANDA:XAUUSD is holding inside the 4,261–4,331 buy zone, while the long descending trendline continues to cap every recovery attempt. This is now a clear decision area: support is still alive, but buyers need to break the trendline before the structure turns convincingly bullish.
If 4,261–4,331 holds and Gold breaks above the descending trendline, I’m watching:
🎯 Target 1: 4,440
🎯 Target 2: 4,500
A sustained break below 4,261 would invalidate the bullish recovery setup.
AURICVERSE View: Gold has the support, but not yet the confirmation. Hold the floor + break the trendline, and 4,440–4,500 becomes the next recovery zone on my radar. Long 
 Long
Long
BTCUSDT: Strong bearish momentum, Bears pressureBTCUSDT is trading around 75,830 USDT after breaking below the 76,300–77,200 support zone. This breakdown was accompanied by strong selling pressure; with the price currently sitting below both the EMA34 (approx. 76,965) and EMA89 (approx. 77,210), sellers remain in control of the H1 market structure.
The 76,300–77,200 zone has now shifted into a retest resistance area. If BTC rallies to this region but fails to reclaim the EMA cluster, I lean towards a scenario where the price continues to decline to 75,000, subsequently extending toward the primary target near 74,200 USDT.
Macro factors today also reinforce the bearish outlook. Reuters reported that Bitcoin fell to around 75,816 USD after the US Senate failed to pass a procedural step for the Clarity Act; meanwhile, the 10-year Treasury yield has surpassed 5%, and the market is pricing in a greater than 90% probability of a 25bp rate hike by the Fed in today's decision.
The bearish scenario would weaken if BTC decisively reclaims the 77,200–77,500 range.
Will BTC retest the breakdown zone before continuing toward 74.2K? Short 
 Long
Long
NIFTY : 17-Sep-202617-SEP-2026 | 15-MINUTE PRICE ACTION
Key Levels • 100-Point Gap Scenarios • Price-Action Confirmation • Risk Management
Important Contract Note: Under the current NSE expiry schedule, NIFTY weekly index options expire on Tuesday , not Thursday. Therefore, 17-Sep-2026 is not a NIFTY weekly-expiry session. The framework below is for 17-Sep-2026 price action based on the supplied 15-minute chart.
━━━━━━━━━━━━━━━━━━━━
1. MARKET STRUCTURE
Previous Close: 23,224.30
The 15-minute chart shows price consolidating after a sharp decline. The immediate structure is defined by:
Opening Resistance: 23,318
Last Intraday Resistance Zone: 23,391–23,435
Major Upside Reference: 23,566
Opening / Last Intraday Support-Resistance Zone: 23,195–23,152
Buyer’s Support / Consolidation Zone: 22,723–22,855
The key observation is that NIFTY is currently positioned close to the 23,195–23,318 decision area. Therefore, confirmation is more important than prediction.
━━━━━━━━━━━━━━━━━━━━
2. 100-POINT GAP REFERENCES
Based on the previous close of 23,224.30:
Gap-Up Reference: 23,324
Previous Close + 100
Gap-Down Reference: 23,124
Previous Close − 100
Therefore:
Gap-Up Open: Above 23,324
Flat / Moderate Open: 23,124–23,324
Gap-Down Open: Below 23,124
The 100-point threshold is a planning reference, not a prediction of the actual opening price.
━━━━━━━━━━━━━━━━━━━━
3. GAP-UP OPENING — 100+ POINTS
Open above 23,324
A gap above 23,324 places NIFTY immediately above the previous close and close to the 23,318 opening resistance .
Scenario A — Gap Sustains
If price opens above 23,324 and the first 15-minute candles maintain higher lows:
→ Hold above 23,318
→ Break and sustain above 23,391
→ Next resistance: 23,435
→ Extended upside reference: 23,566
Trade Logic:
Do not chase the opening candle.
Prefer:
Breakout → Pullback → Hold → Continuation
A successful retest of 23,318/23,391 can provide better confirmation than an immediate market entry.
Scenario B — Gap-Up Rejection
If NIFTY opens above 23,324 but falls below 23,318 and fails to reclaim it:
→ Gap strength becomes questionable
→ Watch 23,195
→ Below 23,195, 23,152 becomes the next reference
Key Principle:
A gap-up is bullish only when the market demonstrates acceptance above the opening structure .
━━━━━━━━━━━━━━━━━━━━
4. FLAT / MODERATE OPENING
Opening Range: 23,124–23,324
This is the most important scenario because price can initially remain rotational.
Above 23,318
→ Positive intraday momentum
→ 23,391–23,435 resistance zone
→ Above 23,435 with acceptance → 23,566
Between 23,195–23,318
→ Range / decision zone
→ Avoid aggressive directional trades
→ Wait for a confirmed breakout or rejection
Below 23,195
→ Weakness increases
→ 23,152 becomes the next reference
→ Sustained breakdown can open the path toward lower support
Educational Rule:
If NIFTY repeatedly moves between 23,195 and 23,318 without establishing acceptance outside the range, treat the area as a NO-TRADE / WAITING ZONE .
━━━━━━━━━━━━━━━━━━━━
5. GAP-DOWN OPENING — 100+ POINTS
Open below 23,124
A 100+ point gap-down places NIFTY below the immediate 23,152–23,195 support structure.
Scenario A — Gap-Down Recovery
If price opens below 23,124 but quickly recovers:
→ Reclaim 23,152
→ Reclaim 23,195
→ Sustained acceptance above 23,195 can bring price toward 23,318
For a stronger reversal structure, watch for:
Reclaim → Retest → Higher Low → Continuation
Scenario B — Gap-Down Continuation
If NIFTY remains below 23,124 and develops successive lower highs/lower lows:
→ Avoid premature bottom-fishing
→ 23,152/23,195 becomes overhead resistance
→ Downside momentum can expand
The chart’s major lower support reference is:
Buyer’s Support Zone: 22,723–22,855
This zone should be treated as a potential demand/consolidation area , not an automatic buy signal.
━━━━━━━━━━━━━━━━━━━━
6. CRITICAL LEVELS — ACTION MAP
23,566
Major upside reference / extended target area
23,435
Upper edge of last intraday resistance
23,391–23,435
Major intraday resistance zone
23,318
Opening resistance / primary bullish trigger
23,224
Previous close / central reference
23,195
Immediate decision level
23,152
Lower boundary of immediate support structure
22,855–22,723
Buyer’s support / consolidation zone
━━━━━━━━━━━━━━━━━━━━
7. BREAKOUT STRATEGY
Bullish Breakout
A stronger bullish setup requires:
23,318 breakout
↓
15-minute acceptance
↓
Retest holds
↓
23,391–23,435 breakout
↓
23,566 becomes the next reference
Bearish Breakdown
A stronger bearish setup requires:
23,152 breakdown
↓
15-minute acceptance below
↓
Failed retest
↓
Continuation toward lower support
↓
22,855–22,723 becomes the major demand reference
The emphasis is on confirmation rather than trading the first tick through a level.
━━━━━━━━━━━━━━━━━━━━
8. FIRST 15–30 MINUTES
The opening 15–30 minutes should be used to identify:
• Opening range
• Gap acceptance/rejection
• First higher high/lower low
• Liquidity sweep
• Breakout or breakdown confirmation
Avoid taking a large directional position simply because the market opens with a gap.
Preferred sequence:
Observe → Mark Range → Wait for Sweep/Break → Confirm → Execute
━━━━━━━━━━━━━━━━━━━━
9. TRADE MANAGEMENT
• Maximum 3 trades for the session.
• Avoid revenge trading after a failed breakout.
• Prefer price-action confirmation + retest .
• Stop-loss should be placed beyond the technical invalidation point.
• For directional positions, an hourly close can be used as an additional confirmation filter.
• Avoid increasing position size merely because the index moves quickly.
• If price remains trapped inside 23,195–23,318, capital preservation takes priority over forcing a trade.
NSE's regular market session begins at 09:15 and the normal market closes at 15:40. ( )
━━━━━━━━━━━━━━━━━━━━
10. MASTER SCENARIO MAP
GAP-UP > 23,324
→ Hold 23,318
→ 23,391–23,435
→ Above 23,435
→ 23,566
FLAT / MODERATE 23,124–23,324
→ 23,195–23,318 = decision/range zone
→ Break above 23,318 = bullish confirmation
→ Break below 23,195 = weakness
GAP-DOWN < 23,124
→ Recovery above 23,152/23,195 = reversal attempt
→ Failure below 23,152 = bearish continuation
→ 22,855–22,723 = major lower support zone
━━━━━━━━━━━━━━━━━━━━
FINAL TRADING FRAMEWORK
23,318 is the primary bullish decision level.
23,195–23,152 is the immediate support/decision structure.
23,391–23,435 is the major upside resistance zone.
22,723–22,855 is the major lower buyer-support zone.
The objective is not to predict whether NIFTY will gap up or gap down. The objective is to identify what price does after the opening .
Gap + Acceptance = Continuation Setup
Gap + Rejection = Reversal Setup
No Breakout + Range = Wait
Educational framework based on the supplied 15-minute chart. Not investment advice. Trading and derivatives involve substantial risk. Use predefined risk, appropriate position sizing, and independent judgment.
: www.nseindia.com "NIFTY 50 F&O - NSE India"
: www.nseindia.com "Market Timings - NSE India"
 Long
Long
SENSEX | WEEKLY EXPIRY TRADING PLAN |17-Sep-2617-SEP-2026 | Thursday Expiry
15-Minute Price Action Framework | Gap-Based Scenarios | Educational Setup
Expiry Context: SENSEX weekly options expire on Thursday. Expiry-day price action can become fast and volatile, and the recently introduced Closing Auction Session has also been associated with sharp expiry-related price swings.
━━━━━━━━━━━━━━━━━━
1. KEY REFERENCE LEVELS
Previous Close: 74,303
Major Resistance: 75,393
Last Intraday Resistance Zone: 74,814 – 74,971
Opening Resistance / Support: 74,610
Opening Support: 74,090
Last Intraday Support: 73,870
Major Downside Reference: 73,211
300-POINT GAP REFERENCES
Gap-Up Reference: 74,603
Previous Close + 300
Gap-Down Reference: 74,003
Previous Close - 300
━━━━━━━━━━━━━━━━━━
2. MARKET STRUCTURE
SENSEX closed at 74,303 , below the important 74,610 opening resistance/support level.
The immediate structure therefore remains range-bound to mildly bearish unless price reclaims 74,610 and subsequently establishes acceptance above the 74,814–74,971 resistance zone.
On the downside, 74,090 is the first important demand/reference zone, while 73,870 is the key liquidity-mitigation/support area.
Important Principle: Do not trade merely because price touches a level. Wait for 15-minute candle confirmation, rejection, or acceptance .
━━━━━━━━━━━━━━━━━━
3. GAP-UP OPENING — 300+ POINTS
Opening above 74,603
If SENSEX opens approximately 300 points or more above the previous close:
Scenario A — Gap holds above 74,610
If the opening is above 74,603 and price sustains above 74,610 :
• Wait for the first 15-minute structure.
• Sustained trading above 74,610 can open the path toward 74,814–74,971 .
• A decisive breakout and 15-minute acceptance above 74,971 can shift momentum toward 75,393 .
Action Framework:
Buy-side setups only after confirmation and retest rather than chasing the opening candle.
Invalidation: Sustained 15-minute acceptance back below 74,610.
Scenario B — Gap-Up Rejection
If price opens above 74,603 but quickly falls below 74,610 and fails to reclaim it:
→ Avoid immediate long positions.
→ Watch 74,610 as resistance.
→ A failed reclaim can bring price back toward 74,303 → 74,090 .
Educational Insight: A large gap is not automatically bullish. The important information is whether the market can hold the gap .
━━━━━━━━━━━━━━━━━━
4. FLAT / MODERATE OPENING
Opening between 74,003 and 74,603
This is the highest-probability two-sided price-action zone from the chart structure.
Above 74,610:
→ Bullish confirmation
→ Targets: 74,814–74,971
→ Above 74,971 with acceptance: 75,393
Between 74,090–74,610:
→ Avoid aggressive directional trades
→ Wait for breakout/rejection
→ Treat 74,610 and 74,090 as the immediate boundaries.
Below 74,090:
→ Weakness increases
→ Watch 73,870
→ Below 73,870, downside liquidity can extend toward 73,211.
Key Rule:
If price continues oscillating between 74,090–74,610 without confirmation, consider it a NO-TRADE / WAITING ZONE .
━━━━━━━━━━━━━━━━━━
5. GAP-DOWN OPENING — 300+ POINTS
Opening below 74,003
A 300+ point gap-down puts price below the previous close and closer to the 74,090–73,870 support structure.
Scenario A — Gap-Down Recovery
If price opens below 74,003 but quickly recovers above 74,090:
→ Wait for 15-minute confirmation.
→ Reclaim of 74,090 can bring price back toward 74,303.
→ Sustained recovery above 74,303 can expose 74,610.
Important: Do not assume that a gap-down must fill. First establish whether buyers can reclaim the opening structure.
Scenario B — Gap-Down Continuation
If price remains below 74,090 and sellers continue making lower highs:
→ Bearish continuation remains active.
→ 73,870 becomes the immediate downside reference.
→ Sustained breakdown below 73,870 can open the path toward 73,211 .
Trade Management: Avoid chasing the first large bearish candle. Prefer a breakdown + retest or a lower-high rejection.
━━━━━━━━━━━━━━━━━━
6. CRITICAL LEVEL — 74,610
74,610 is the central decision level for the session.
Above 74,610 + acceptance
→ Bullish intraday structure
→ 74,814–74,971
→ 75,393
Below 74,610 + rejection
→ Range/weakness
→ 74,303
→ 74,090
Therefore, 74,610 should be treated as a decision zone, not simply a buy/sell price.
━━━━━━━━━━━━━━━━━━
7. DOWNSIDE DECISION LEVELS
74,090 = First important support
73,870 = Last intraday support / liquidity mitigation zone
73,211 = Major downside reference
A 15-minute close below 73,870 followed by a failed retest would provide stronger evidence of downside continuation.
━━━━━━━━━━━━━━━━━━
8. EXPIRY-DAY EXECUTION RULES
• Wait for the first 15–30 minutes before taking an aggressive directional position.
• Maximum 3 trades for the session.
• Prefer confirmation + retest over first-candle breakout entries.
• Keep stop-loss based on the invalidation structure, not an arbitrary number.
• For directional trades, use 15-minute / hourly closing confirmation according to the setup.
• Avoid revenge trading after a failed breakout.
• On expiry, option premiums can react much faster than the underlying index; position size should reflect this.
━━━━━━━━━━━━━━━━━━
9. MASTER ROADMAP
ABOVE 74,610
→ 74,814–74,971
→ 75,393
74,303–74,610
→ Wait / Range
→ Trade only after confirmation
BELOW 74,090
→ 73,870
→ 73,211 if breakdown sustains
GAP-UP > 74,603: Watch whether 74,610 holds.
FLAT / MODERATE OPEN: Let 74,090–74,610 define the initial range.
GAP-DOWN < 74,003: Watch 74,090 for recovery or rejection.
━━━━━━━━━━━━━━━━━━
FINAL TRADING THOUGHT
“The opening gap gives the context; price acceptance gives the trade.”
For the 17-Sep-2026 SENSEX expiry, the key battle is around 74,610 on the upside and 74,090–73,870 on the downside.
Do not predict the direction from the gap alone. Let the first 15-minute price structure determine whether the gap is being accepted, rejected, or filled .
Educational content only. This is a technical-analysis framework, not investment advice. Options and expiry-day trading involve substantial risk; use appropriate position sizing and predefined risk.
 Long
Long
Education

Tilaknagar Industries: The Triangle That HeldThis chart shows a textbook five-wave advance from the 199.53 low, developing over more than eighteen months on the weekly timeframe.
Wave (1) and wave (2) established the base — a clean impulse followed by an orderly retracement. Wave (3) followed with the strongest momentum of the move, backed by a clear rise in volume, consistent with genuine participation rather than a low-liquidity push.
Wave (4) then unfolded as a contracting triangle — five overlapping legs, each smaller than the last, holding well above wave (1)'s territory. Volume tapered off through this phase, but there was no accompanying rise in selling pressure. That combination — falling volume, no distribution — is typically read as consolidation, not reversal.
The advance resumed from there. Wave (i) of the new (5) leg matched wave (1) almost point for point, a proportional relationship often seen between non-extended waves within the same structure.
Price is currently working through wave (ii) of (5), retracing into the 0.5–0.618 zone before, if the structure holds, the next leg attempts to develop.
The value of this kind of analysis lies less in forecasting and more in discipline — reading how price and volume behave at each stage, and letting the structure invalidate itself if it's wrong, rather than forcing a narrative onto the chart.
Disclaimer: This analysis is for educational purposes only and does not constitute investment advice or a recommendation to buy or sell.  Long
Long
 Long
Long
 Long
Long

 Long
Long
 Education

 Education

Trading Masterclass #1Institutional trading means trading like hedge funds, banks, prop firms, and professional desks. They do not trade based on emotions, random tips, or gambling. They use systems, probabilities, risk control, position sizing, discipline, and psychology.
Retail traders often lose because they focus only on “entry.” Institutions focus on:
Risk Management
Capital Protection
Position Sizing
Probability
Psychology
Consistency
Repeatable Edge
In options trading, if you think like institutions, your results can improve significantly Education

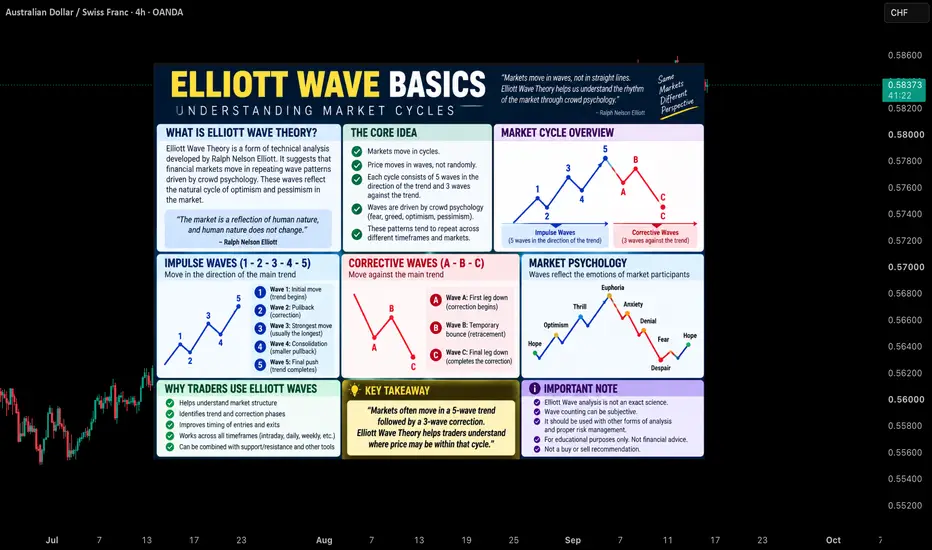
Elliott Wave Basics📌 Overview
Elliott Wave Theory is a method of technical analysis developed by Ralph Nelson Elliott. The theory suggests that financial markets move in repetitive wave patterns driven by crowd psychology and investor sentiment. These recurring patterns help traders understand market cycles, trend development, and corrective phases within price action.
---------------------------------------------------------------
📘 Definition
Elliott Wave Theory states that markets move in recognizable wave structures that reflect the collective emotions of market participants.
A complete market cycle generally consists of:
Impulse Waves (1-2-3-4-5) – Five waves moving in the direction of the primary trend.
Corrective Waves (A-B-C) – Three waves moving against the prevailing trend.
Market Cycle – The complete sequence of an impulse phase followed by a corrective phase.
Crowd Psychology – Market movements influenced by optimism, fear, greed, and uncertainty.
Wave Structure – The recurring pattern that forms trends and corrections across all timeframes.
Fractal Nature – Elliott Wave patterns can appear within larger and smaller wave structures.
---------------------------------------------------------------
📌 Key Points
• Markets move in waves rather than straight lines.
• A complete cycle consists of 5 impulse waves and 3 corrective waves.
• Impulse waves move with the trend.
• Corrective waves move against the trend.
• Wave patterns reflect crowd psychology and market sentiment.
• Elliott Wave structures can be found on all timeframes.
• The theory helps traders understand where price may be within a market cycle.
---------------------------------------------------------------
📊 Chart Explanation
• The chart illustrates a complete Elliott Wave market cycle.
• Waves 1, 3, and 5 represent the primary trend movement and are known as Impulse Waves.
• Waves 2 and 4 represent temporary pullbacks within the larger trend.
• After the completion of Wave 5, the market typically enters a corrective phase labeled A-B-C.
• Wave A begins the correction, Wave B forms a temporary retracement, and Wave C completes the corrective structure.
• The diagram also highlights how market psychology evolves throughout the cycle, from optimism and confidence to fear and uncertainty.
• The example is an educational illustration designed to explain the basic concepts of Elliott Wave Theory.
---------------------------------------------------------------
📉 Summary
Elliott Wave Theory provides a structured framework for understanding market cycles. The theory proposes that markets often progress through a five-wave trend phase followed by a three-wave corrective phase. Recognizing these patterns can help traders better interpret market structure and price behavior.
---------------------------------------------------------------
💡 Why It Matters
• Helps traders understand overall market structure.
• Provides insight into trend and correction phases.
• Improves awareness of crowd psychology.
• Assists in identifying potential stages of a market cycle.
• Can be combined with support, resistance, trendlines, and other technical tools.
• Builds a foundation for more advanced Elliott Wave analysis.
---------------------------------------------------------------
📌 Conclusion
Elliott Wave Theory remains one of the most widely recognized market cycle models in technical analysis. By understanding the relationship between impulse waves, corrective waves, and crowd psychology, traders can develop a deeper understanding of how markets often move through recurring cycles.
---------------------------------------------------------------
⚠️ Disclaimer
📘 For educational purposes only.
🙅 Not SEBI registered.
❌ Not a buy/sell recommendation.
🧠 Purely a learning resource.
📊 Not Financial Advice. XAU/USD - Defends the Floor, Breakout Away From 4.500OANDA:XAUUSD is sitting inside the 4,280–4,350 buy zone, where buyers have already defended the lower boundary several times. Price is also compressing between the rising support line and the descending trendline, creating a clear decision area.
The bullish setup only becomes convincing if Gold can hold above 4,280 and break the descending trendline around 4,350–4,370. If that happens, the recovery could extend toward:
🎯 Target: 4,500
A sustained break below 4,280 would invalidate the recovery setup.
AURICVERSE View: support is holding, but macro still favors caution. I want to see 4,280 hold + a clean trendline breakout before treating 4,500 as the next serious upside target. Long 
BTCUSDT: Buy Zone Holding Firm, Path to 80.5K Remains OpenBTCUSDT is trading around 77,065 USDT following a pullback from a rally that neared 79,200. The price is currently entering the 76,300–76,800 "Buy Zone," an area that also serves as support near the lows of the short-term structure.
From a technical standpoint, this is the zone where I would like to see a reaction from buyers. If BTC holds the 76,300–76,800 level and subsequently reclaims the EMA cluster around 77,700–77,900, the likelihood of a return to the 79,000–79,300 range increases. A decisive breakout above this area could pave the way toward the primary target of around 80,500 USDT.
The bullish scenario would weaken if BTC breaks decisively below 76,300.
Will BTC hold the Buy Zone and rally back to 80.5K? Long 
XAUUSD — Sell Pressure Below 4,300XAUUSD — Sell Pressure Below 4,300
Gold is still trading with a bearish intraday structure after failing to reclaim the upper liquidity zone. From Kelly’s view, the chart suggests that XAUUSD remains under selling pressure, and the current rebound is likely just a temporary pause before price continues lower.
The key idea is simple: as long as gold stays capped below the 4,290–4,300 sell zone, the market may continue rotating down toward the 4,254 support, then extend lower into the 4,235 area and possibly the final wave target near 4,160–4,170.
⟡ Market structure
Gold is currently trading around 4,290, right below the short-term liquidity sell zone. The recent price action keeps printing lower highs, which tells us that sellers still control the structure.
The area around 4,290–4,300 is important because it acts as immediate resistance. If price continues rejecting from this zone, the market may retest 4,254 first. A break below that support would likely expose the next reaction zone around 4,235–4,245.
From the Elliott Wave view, the chart still supports a bearish continuation. The current movement looks like a corrective wave before another downside leg develops. If sellers stay in control, the market may complete the next push lower toward the 4,160–4,170 target zone.
➤ Key levels
◌ Current price area: 4,290
◌ Sell zone liquidity: 4,288–4,300
◌ Intraday resistance: 4,300–4,310
◌ Strong support: 4,254
◌ Buy scalping wave 4 zone: 4,235–4,245
◌ Main bearish target: 4,160–4,170
◌ Bearish invalidation: above 4,310
⌁ Elliott Wave view
The chart shows a bearish Elliott Wave continuation structure.
Price is struggling below the sell liquidity zone, which may be the ceiling for the current recovery attempt.
If gold cannot break above 4,300, the next move may be a decline toward 4,254.
After that, a short rebound from the 4,235–4,245 wave 4 support zone may appear.
But if the broader bearish structure stays intact, the next selling leg could extend toward 4,160–4,170 to complete the downside wave sequence.
This is why Kelly is still prioritizing the bearish scenario while price remains below resistance.
▸ Trading scenario
Preferred bearish scenario
Entry: Sell around 4,288–4,300 if price shows bearish rejection
Stop Loss: Above 4,310
Take Profit 1: 4,254
Take Profit 2: 4,235–4,245
Take Profit 3: 4,160–4,170
Alternative scenario
If gold breaks above 4,300 and holds above that zone, short-term downside pressure may weaken. In that case, price could recover higher first before sellers return.
◌ Confirmation
Bearish confirmation comes if price continues rejecting below 4,300 and breaks down through 4,254.
◌ Invalidation
The bearish view becomes weaker if gold closes above 4,310 with strong momentum. That would suggest the market is no longer respecting the current sell zone.
⌁ Kelly’s view
Kelly’s main view remains bearish while gold stays below the 4,288–4,300 liquidity zone. The chart still favors selling rallies rather than chasing buys at the current level.
If sellers defend resistance, gold may continue lower toward 4,254, then 4,235–4,245. A deeper extension could later complete near 4,160–4,170.
Do you think gold will reject directly from this sell zone, or make one more small bounce before the next leg down? Short