XAUUSD: Bulls Hold the Trend, But 4,147 Decides XAUUSD: Bulls Hold the Trend, But 4,147 Decides
Market Context
Gold is cooling after a four-day recovery as higher oil prices from Middle East tensions bring inflation concerns back into focus. This can make the market more cautious about Fed policy and limit gold’s upside momentum.
At the same time, the US Dollar is not fully strong either, as traders remain alert to possible USD/JPY selling pressure and intervention risk. That keeps gold in a tricky position: not fully bearish, but not strong enough to chase at the high.
Key point: gold is still inside a short-term bullish structure, but buyers must defend the pullback zones if they want continuation.
Technical Structure
Gold is trading around 4,127 and reacting inside the Current Reaction Zone after pulling back from the weak high near 4,165.
The short-term structure remains upward, supported by the recent bullish channel and previous BOS signals. However, momentum is slowing near the upper area, and RSI hovering around 50 shows that the market is still at a decision point.
The first key level is 4,147. If buyers reclaim this level, gold may retest the weak high and extend higher.
If the current reaction zone fails, price may pull back toward 4,050 - 4,060. This is the Pullback Buy Zone and the first area where buyers may reload.
Below that, 4,000 - 4,010 is the Main Support Zone. As long as gold holds above the demand structure, the broader short-term bullish trend is not broken.
Key Levels
Current Price: 4,127
Weak High: 4,147 - 4,165
Current Reaction Zone: 4,100 - 4,130
Pullback Buy Zone: 4,050 - 4,060
Main Support Zone: 4,000 - 4,010
Deep Demand Zone: 3,960 - 3,990
Bullish Continuation: Above 4,147
Bearish Risk: Below 4,050
Trading Plan
Buy Pullback
Entry: 4,050 - 4,060
SL: Below 4,000
TP: 4,100 / 4,127 / 4,147
Condition: Price must pull back into the buy zone and show bullish confirmation. Buyers need to defend the channel structure and form a clear reaction before entry.
Buy Breakout
Entry: Above 4,147 after breakout and retest
SL: Below 4,100
TP: 4,165 / 4,180 / 4,200
Condition: Price must reclaim 4,147 with strength, hold the retest, and continue forming higher lows. Avoid chasing the first breakout candle without confirmation.
Sell Reaction
Entry: 4,147 - 4,165
SL: Above 4,180
TP: 4,127 / 4,100 / 4,060
Condition: Price reaches the weak high zone but fails to continue higher. Bearish rejection from this area could trigger a corrective pullback toward the buy zone.
Breakdown Sell
Entry: Below 4,050 after confirmed breakdown
SL: Above 4,100
TP: 4,010 / 4,000 / 3,980
Condition: Price loses the Pullback Buy Zone, retest fails, and bearish momentum returns. This would increase the risk of a deeper correction toward the Main Support Zone.
Overall Bias
Gold remains short-term bullish, but the market is no longer clean enough to chase.
Above 4,147, buyers can extend the recovery toward 4,165 and 4,200. Below 4,050, the bullish structure weakens and price may return toward 4,000 - 4,010.
Best approach: wait for either a clean breakout above 4,147 or a controlled pullback into 4,050 - 4,060.
Will buyers reclaim 4,147, or will gold need one deeper pullback before the next move?
 Short
Short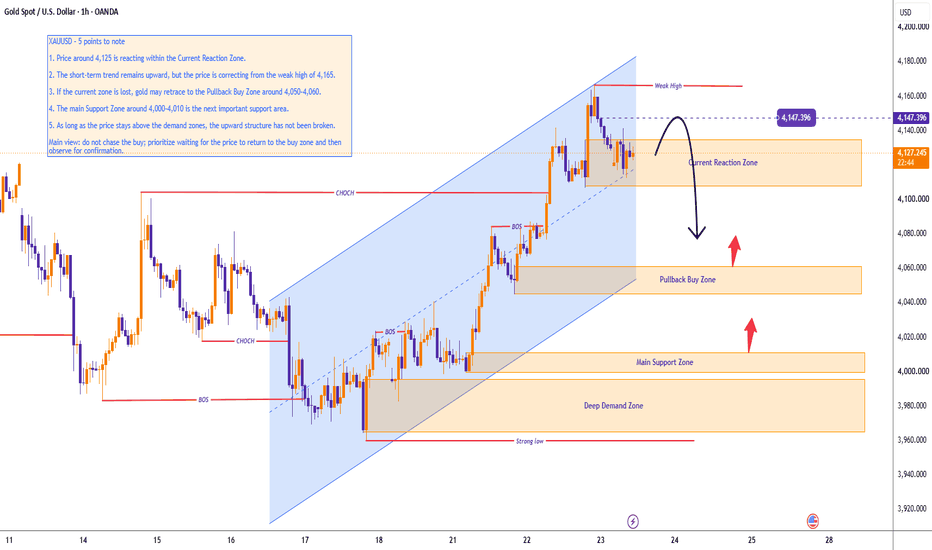
 Long
Long
XAUUSD 4103 golden zone — 4043 is calling XAUUSD 4103 golden zone — 4043 is calling
That rejection from 4,160 looks heavy now.
Gold had the four-day recovery, pushed hard, grabbed higher liquidity, then started rolling over right back into the Golden zone around 4,103 - 4,092. That zone is the whole fight.
And yeah, buyers are not dead yet.
But this is not the place I want to chase longs. Price already expanded from the 3,968 base into 4,160. Big move. Fast move. Now momentum is cooling, RSI hanging around the middle, and the daily setup is flirting with that bearish cross idea.
Macro is mixed but still not clean for gold. Oil is keeping inflation fear alive. Middle East tension still messy. USD may be soft short-term, but if Fed rate expectations stay alive, gold upside can get capped fast.
Main bias is bearish pullback while price stays below 4,134 - 4,160.
The Golden zone around 4,103 - 4,092 can give a bounce, sure. But if that bounce fails under 4,123 - 4,134, I’m looking for sellers to press again. Below 4,092, the next draw is 4,043. That’s the real downside liquidity.
Trading scenario:
Sell idea only if gold rejects 4,123 - 4,134 or breaks below 4,092 with clean pressure.
Entry zone: 4,123 - 4,134 after rejection
Alternative entry: below 4,092 after breakdown confirmation
Stop loss: above 4,160
TP1: 4,092
TP2: 4,043
TP3: 4,025
No rejection, no sell. No breakdown, no chase.
If gold closes strong back above 4,160, this bearish pullback idea is cooked. Then buyers can keep hunting higher.
For now, I’m reading this as liquidity taken first, pullback next.
You think 4,092 holds, or does gold flush to 4,043?
Short 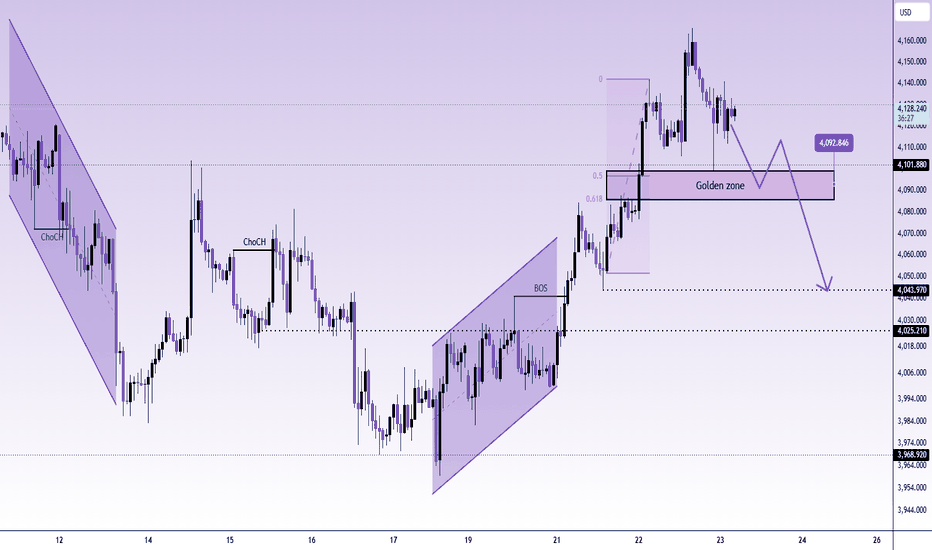
Technical AnalysisCore of Technical Analysis
Technical Analysis is the study of past price movements, volume, and market trends to predict future price direction.
3 Main Principles:
Market Discounts Everything
All news, emotions, and fundamentals are already reflected in price.
Prices Move in Trends
Markets usually move in uptrend, downtrend, or sideways trends.
History Repeats Itself
Human psychology creates repeating chart patterns.
Key Tools:
Charts (Candlestick, Line, Bar)
Support & Resistance
Trendlines
Indicators (RSI, MACD, Moving Averages)
 Education

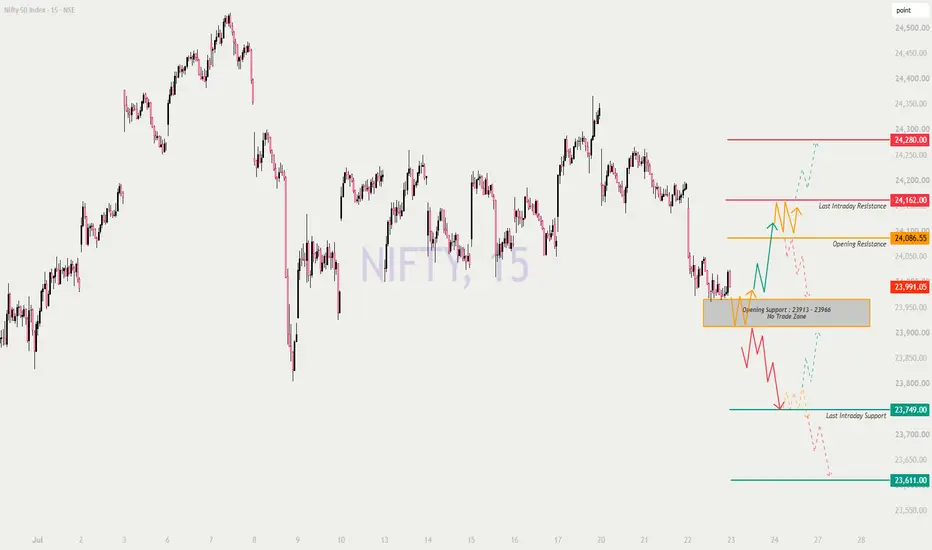
Nifty : Trading Plan: 23-Jul-2026 (Sensex Expiry Day Special)Welcome traders! 👋 Today is a crucial day as we are in the Weekly Expiry session (Thursday). Volatility (Gamma) and Time Decay (Theta) will be at their peak. Here is a detailed, professional trading plan for Nifty 50 based on the 15-minute chart structure.
🎨 Chart Legend & Color Code
Orange Line/Box: No Trade Zone / Sideways Market / Caution Area (Option Sellers' Paradise).
🟢 Green Line: Bullish Zone / Support / Long Side.
Red Line: Bearish Zone / Resistance / Short Side.
⚪ Dashed Line: Probable Trend (Maybe/Maybe Not) – Wait for candle confirmation!
📈 Overall Nifty Trend (Intraday & Expiry Context)
Looking at the chart, Nifty is currently trading around 23,991.
Trend: The market is attempting a recovery but is facing immediate resistance.
Expiry Factor: Since today is the weekly expiry, we expect sharp moves. The market often tries to pin the price near the "Max Pain" level.
Key Battle: The zone between 23,913 (bottom of No Trade Zone) and 24,086 (Opening Resistance) is the immediate battleground.
Current Status: Price (23,991) is hovering just above the No Trade Zone (23,913 - 23,966).
🚀 Scenario 1: Gap Up Opening (100+ Points)
(Expected Open: ~24,090 - 24,100)
If the market gaps up by 100+ points, it will open right at or above the Opening Resistance (24,086.55).
🔍 Analysis: A gap up here is a strong bullish signal, breaking the immediate orange resistance line. However, on expiry day, profit booking can happen instantly at the next red line.
🟢 Bullish Action (Long): If the price sustains above 24,086 for the first 15 minutes, look for a move towards 24,162 (Last Intraday Resistance). A breakout of 24,162 opens the door to 24,280 (following the green dashed line).
🔴 Bearish Action (Short): If the price gaps up but immediately faces selling pressure at 24,086 - 24,100 (forming a bearish candle), it's a "Sell on Rise" opportunity. Target a fall back to 23,991 or the top of the No Trade Zone.
⚠️ No Trade: Avoid buying ATM/OTM calls right at the open if the price is stuck between 24,086 and 24,162.
⚖️ Scenario 2: Flat Opening
(Expected Open: ~23,980 - 24,010)
If the market opens flat, it opens right around the current price (23,991), just above the No Trade Zone (23,913 - 23,966).
** Analysis**: This is the most tricky scenario for Option Buyers. The market is likely to oscillate between 23,913 and 24,086.
🟠 No Trade Zone: The box 23,913 - 23,966 is your "Sideways" area. If the market enters this box, Option Buyers will suffer heavy Theta decay. Stay out!
🟢 Bullish Action (Long): Wait for a strong breakout above 24,086 (Orange Line). Once confirmed, go Long with a target of 24,162.
🔴 Bearish Action (Short): Wait for a breakdown below 23,913 (bottom of the Orange Box). Once confirmed, go Short with a target of 23,749 (Green Line).
⚪ Dashed Line Logic: The chart shows a red dashed line dropping from here and a green solid line rising. The market is at a crossroads. Let the price pick a side!
📉 Scenario 3: Gap Down Opening (100+ Points)
(Expected Open: ~23,890)
If the market gaps down significantly, it opens below the No Trade Zone (23,913 - 23,966) and heads straight towards the Last Intraday Support (23,749).
** Analysis**: This is a bearish continuation. The support at 23,913 has failed.
🔴 Bearish Action (Short): If the price opens below 23,900 and stays there, initiate a Short position. The immediate target is 23,749. If that breaks, look at 23,611 (following the red dashed line).
🟢 Bullish Action (Long): Only look for a "Dead Cat Bounce" or reversal if the price hits 23,749 and shows strong buying interest (Hammer candle). Target a recovery to 23,913.
⚠️ Caution: In a gap down on expiry day, panic selling can be intense. Don't catch the falling knife; wait for stabilization at the green support line.
🛡️ Risk Management Tips for Options Trading (Expiry Special) 🧠
Since today is weekly expiry, the rules change slightly:
🔹 Beware of Theta Decay: If the market is flat (Scenario 2), Option premiums will melt like ice cream. Option buyers should avoid holding positions for too long in the sideways zone.
🔹 Stop Loss is God: In expiry moves, spikes can be sharp. Always use a system SL. Don't rely on "hope".
🔹 Position Sizing: Volatility can double or halve premiums quickly. Trade with smaller quantities than usual to manage the psychological stress.
🔹 Hero-Zero Trades: If you are trading cheap OTM options (0.50 - 1.00) in the afternoon session, treat it as a lottery ticket. Only use money you are okay losing completely.
🔹 Trail Aggressively: If you are in profit, move your SL to cost immediately. Expiry moves can reverse in minutes.
📝 Summary & Conclusion
To summarize the plan for 23-Jul-2026 (Expiry Day):
Trend: Neutral to Bullish if above 24,086. Bearish if below 23,913.
Gap Up: Bullish above 24,086. Target 24,162 then 24,280.
Flat: NO TRADE in the 23,913 - 23,966 zone. Wait for breakout/breakdown.
Gap Down: Bearish below 23,913. Target 23,749.
Conclusion: The chart highlights a critical "No Trade Zone" (Orange Box) at 23,913 - 23,966. As an educational takeaway: Don't trade in the chop! Let the market break out of the orange box or the orange line (24,086) to give you a clear direction (Green or Red). The dashed lines remind us that until a level is broken, the trend is uncertain. Stay disciplined! 📈
⚠️ Disclaimer:
I am not a SEBI registered analyst. This post is for educational purposes only. Trading in the stock market and F&O; involves high risk and can lead to capital loss. Please consult your financial advisor before taking any trades. The charts and levels are based on technical analysis and probabilities, not guarantees.  Long
Long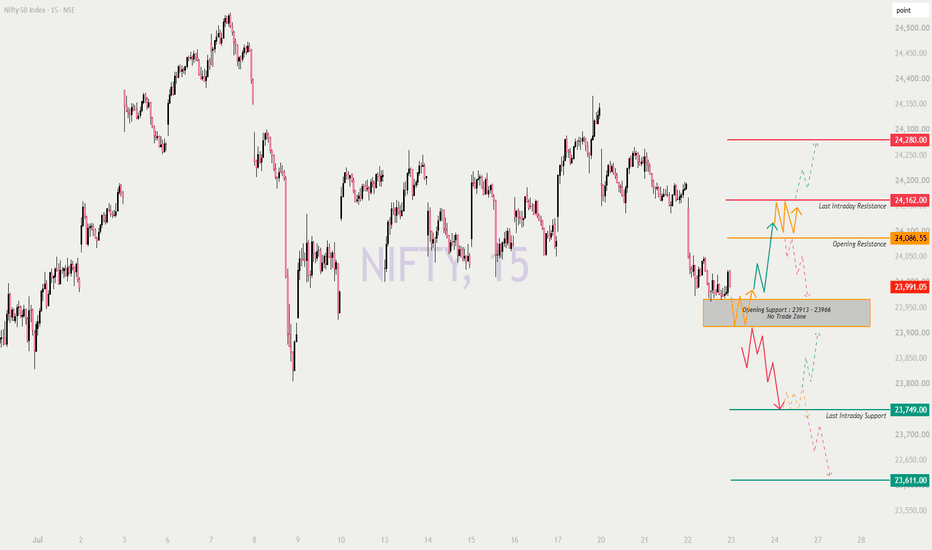
SENSEX – DETAILED TRADING PLAN FOR 23-JUL-2026⚡ SENSEX WEEKLY EXPIRY DAY — TRADE WITH EXTRA CAUTION ⚡
Previous Close: 76,744.86 | Timeframe: 15 Min | Index: S&P BSE SENSEX
Namaste Traders! 🙏 Today is the Sensex Weekly Expiry session — expect sharper intraday swings, quick reversals, and aggressive premium decay as the day progresses. Below is a complete educational trading plan covering the overall trend structure and all three opening scenarios (with 300+ point gap consideration). Trade the levels, not your emotions. Let's begin! 👇
🧭 OVERALL SENSEX TREND STRUCTURE FOR THE DAY
⦿ Upside Structure: 77,089 (Opening Resistance) → 77,367–77,461 (Last Intraday Resistance) → 77,931 (Extended Target)
⦿ Downside Structure: 76,627–76,818 (No-Trade / Opening Support Zone) → 76,002 (Extended Support Target)
⦿ No-Trade / Balance Zone: 76,627–76,818 → marked in gray box on chart — this is where price is likely to chop before choosing direction. Avoid fresh trades here.
⦿ Chart Color Code Reminder:
⦿ 🟢 Green solid/dashed = Bullish/Long bias (dashed = unconfirmed, wait for candle close)
⦿ 🔴 Red solid/dashed = Bearish/Short bias (dashed = unconfirmed, wait for candle close)
⦿ 🟠 Orange solid/dashed = No-trade / Sideways / Uncertain zone — avoid fresh directional bets here
⚠️ Expiry Day Note: With a 300+ point gap consideration today, moves are likely to be sharp and momentum-driven right from the open. Expiry day price action tends to gravitate towards Max Pain/high-OI strikes as the session progresses — don't fight the pin, trade the structure. 🕰️
🟢 SCENARIO 1: GAP UP OPENING (300+ points, i.e., Open above 77,045)
A gap-up opening of 300+ points on expiry day reflects a strong overnight trigger (global cues/FII flows). Such large gaps often see either strong follow-through or sharp fade — the first 15-min candle close is critical.
⦿ Immediate Resistance Zone: 77,367–77,461 (Last Intraday Resistance)
⦿ Next Target Zone (if trend sustains): 77,931
⦿ Key Support on Pullback: 77,089 (Opening Resistance, now flips to support)
📌 Plan of Action:
⦿ If Sensex opens above 77,045 and holds with a 15-min candle close above 77,367, this confirms bullish continuation → Look for Call buying (CE) on shallow dips towards 77,367–77,400, SL below 77,300.
⦿ If price gaps up but gets rejected at 77,367–77,461 zone, avoid chasing — wait for a retracement into 77,089 zone for a fresh, low-risk entry with confirmation.
⦿ If the gap-up fails to hold above 77,089 and slips back towards the No-Trade Zone, treat it as a gap-fill scenario — book any long profits quickly and shift to a neutral stance.
⦿ On expiry day with such a large gap, avoid holding aggressive CE positions into the last hour if price stalls near resistance — theta decay and pinning risk increase sharply post 2:30 PM. ⏳
🟠 SCENARIO 2: FLAT OPENING (Within ±300 points of 76,744.86, i.e., between 76,445 – 77,045)
Flat openings on expiry day are common as market makers often keep price anchored near high-OI strikes early in the session. The 76,627–76,818 zone is a marked No-Trade Zone — respect it strictly.
⦿ Key Resistance Zone: 77,089 (Opening Resistance)
⦿ Key Support Zone: 76,627–76,818 (No-Trade / Opening Support Zone)
⦿ Expected Range (base case): 76,627 – 77,089
📌 Plan of Action:
⦿ If Sensex opens flat and stays within 76,627–77,089, this is a strict no-trade / sideways zone — best suited for premium selling strategies (Iron Condor/Credit Spreads) rather than naked option buying, since expiry day theta will punish directionless buying. 🧘
⦿ A confirmed breakout above 77,089 (candle close + follow-through) opens the path to 77,367 → 77,931. Enter CE only after confirmation, SL below 77,000.
⦿ A confirmed breakdown below 76,627 opens downside towards 76,002. Enter PE only after candle close below 76,627, SL above 76,818.
⦿ Since this is expiry day, expect false breakouts near the No-Trade Zone — wait for a strong follow-through candle with volume, not just a single close outside the range. 🎯
🔴 SCENARIO 3: GAP DOWN OPENING (300+ points, i.e., Open below 76,445)
A gap-down opening of 300+ points on expiry reflects strong negative overnight sentiment and can trigger fast PE writing unwinding, leading to sharp initial downside moves. Avoid shorting blindly at the open.
⦿ Immediate Support Zone: 76,002 (Extended Support Target)
⦿ Key Resistance for Pullback: 76,627–76,818 (No-Trade Zone flip)
⦿ Deeper Downside (if broken): Watch for further extension below 76,002 with trailing SL
📌 Plan of Action:
⦿ If Sensex opens below 76,445 and continues below 76,627 with a sustained 15-min close, this confirms bearish continuation → Look for Put buying (PE) on pullback towards 76,627–76,700, SL above 76,750.
⦿ If price holds near 76,002 and forms reversal candles (hammer/bullish engulfing), avoid fresh shorts — a bounce towards 76,627 becomes likely. This is a counter-trend trade, suitable only for experienced traders with tight SL.
⦿ If the gap-down recovers quickly and reclaims 76,818, treat it as a gap-fill/reversal day — shift bias to neutral and track 77,089 as the next resistance hurdle.
⦿ On expiry day, sharp V-shaped recoveries are common due to short covering — never hold naked PE positions without SL once price shows reversal signs near support. ⚠️
🎯 RISK MANAGEMENT TIPS FOR OPTIONS TRADING (EXPIRY DAY SPECIAL)
⦿ Risk only 1-2% of total capital per trade — with a 300+ point gap, expiry day volatility can swing premiums drastically within minutes. 🛡️
⦿ Always trade with a predefined Stop Loss — never average a losing options position on expiry day hoping for reversal.
⦿ Avoid buying far OTM options on expiry — theta decay accelerates hour by hour, and most OTM premiums decay to zero by close.
⦿ Stay out of the No-Trade Zone (76,627–76,818) — this is where premium sellers benefit and option buyers bleed via decay.
⦿ Practice partial profit booking — on expiry day, book profits fast; don't get greedy waiting for the "perfect" target.
⦿ Track India VIX and Max Pain levels — price often gravitates towards Max Pain by end of session, especially after a big gap opening.
⦿ Avoid fresh option buying trades in the last 45–60 minutes of expiry — this period is dominated by unpredictable pinning action and rapid premium decay.
⦿ With a 300+ point gap, be extra cautious of a gap-fill move in either direction — don't assume the gap direction will hold without confirmation.
⦿ If writing options (experienced traders only), use hedged strategies (spreads) rather than naked writing to protect against sudden volatility spikes.
⦿ Always align options trades with confirmed price action on the underlying — expiry day, especially with large gaps, is not the day for guesswork.
📝 SUMMARY & CONCLUSION
Today's session (22-Jul-2026) — being a Sensex Weekly Expiry with a 300+ point gap consideration — demands extra discipline and structure-based trading. The framework is clearly defined: 76,627–76,818 (No-Trade Zone) sits at the center, with 77,089 and 77,367–77,461 marking upside resistance levels extending to 77,931, while 76,002 marks the key downside support target.
⦿ Gap Up (300+): Bullish bias sustains above 77,367, with extended target at 77,931.
⦿ Flat Opening: Expect range-bound chop between 76,627–77,089 — avoid directional buying, prefer spreads.
⦿ Gap Down (300+): Bearish bias sustains below 76,627, with extended target at 76,002.
Across all scenarios, respect the No-Trade Zone, wait for confirmed candle closes at key levels, and stay alert to expiry-day theta decay and last-hour pinning action. With such a large potential gap, gap-fill risk is elevated in both directions — never assume, always confirm. Dashed lines (green/red) represent "maybe" trend zones requiring extra confirmation, while solid lines represent higher-conviction levels.
On expiry day, capital protection matters more than chasing the "big move." Plan your trade, trade your plan, book profits early, and never let greed override your stop loss. 📈📉
⚠️ DISCLAIMER
I am not a SEBI registered analyst. This post is shared purely for educational purposes and represents a personal technical view for learning chart-reading and risk management concepts. It should not be construed as investment or trading advice. Please consult a qualified financial advisor and conduct your own research before making any trading or investment decisions. Trading in equity/options, especially on expiry days with large gap openings, carries substantial risk of financial loss. 🙏 Long 
Education

Education
 Education

 Short
Short
XAUUSD: ABC Pullback Could Trigger Next Bullish WaveGold is still holding a constructive bullish structure after the strong recovery from the lower base. From Kelly’s view, the market has already created an impulsive move higher, and the current pullback may simply be an ABC correction before price attempts another upside continuation.
The key idea is simple: gold may correct first, but the bullish structure remains active while price holds above the trendline and the main buy zone.
⟡ Market structure
The chart shows gold recovering strongly from the 3,960 area, then building higher lows along the rising trendline. Price pushed into the 4,130–4,140 region before slowing down, which is normal after a strong bullish leg.
Gold is now trading around 4,118, close to the short-term support area. The first reaction zone sits around 4,100–4,105, where a small buy scalping setup may appear.
The more important zone is the 4,068–4,075 area. This is marked as the possible end of the ABC correction. If buyers defend this zone, gold may start a new upward wave towards the upper trendline and the 4,150–4,160 target area.
➤ Key levels
◌ 4,100–4,105: buy scalping zone and short-term reaction area
◌ 4,068–4,075: main buy zone and possible ABC completion
◌ 4,118–4,123: current price reaction area
◌ 4,130–4,140: nearest resistance zone
◌ 4,150–4,160: upside target and trendline target area
◌ Below 4,068: area where the bullish setup starts to weaken
⌁ Elliott Wave view
From an Elliott Wave perspective, gold appears to have completed a short bullish wave sequence from the lower base. After that, the current movement may be forming an ABC correction.
Wave A is the first pullback from the recent high.
Wave B may form a small rebound around the 4,100 zone.
Wave C may complete around 4,068–4,075 if price continues to correct deeper.
If wave C ends inside this buy zone and a bullish confirmation candle appears, gold may begin the next continuation phase. The next target would be 4,130–4,140 first, then 4,150–4,160 if momentum expands.
▸ Trading scenario
Preferred scenario: wait for gold to complete the ABC correction around the buy zone before looking for continuation.
Entry zone: 4,068–4,075 if bullish confirmation appears
Scalping entry zone: 4,100–4,105 only if price reacts strongly
Stop loss: below the confirmed wave C low or below 4,060
Take profit 1: 4,130–4,140
Take profit 2: 4,150–4,160
Take profit 3: higher trendline area if bullish momentum continues
Alternative scenario: if gold breaks below 4,068 with strong bearish pressure, the ABC bullish setup weakens. In that case, price may need to form a deeper base before the next recovery becomes reliable.
⌁ Kelly’s view
For Kelly, this is a bullish continuation structure, but the market needs a healthy correction before the next strong move. Buying directly after a strong push is not the cleanest plan.
The better setup is to wait for gold to pull back into support, then watch whether buyers defend the ABC completion zone.
Gold is correcting inside a bullish structure.
If the buy zone holds, the next upside wave may continue towards 4,150–4,160.
Share your view below. Long 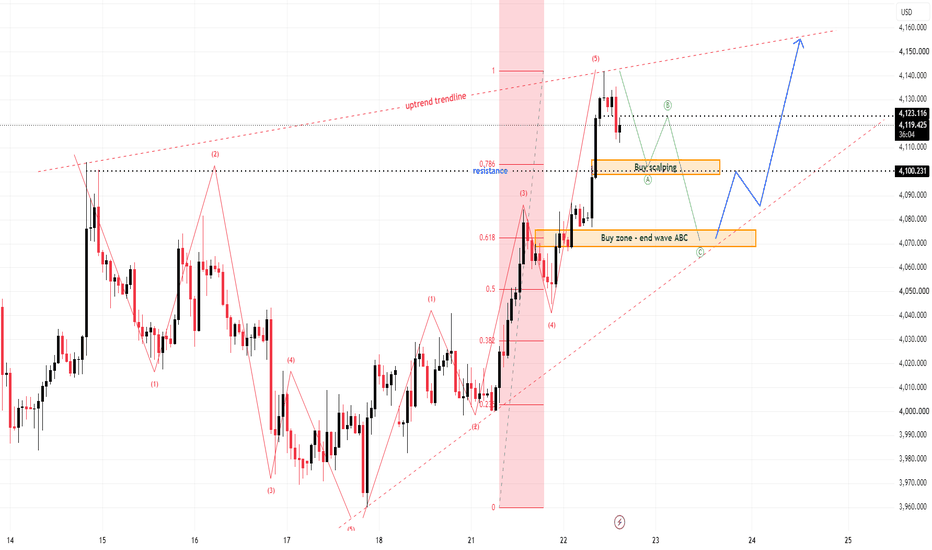
Short 
Smart Money and Retail Traders Create Market TrendsHave you ever wondered why a market suddenly starts trending?
One day, price is moving sideways.
Then, without warning, it breaks out and begins a powerful move.
Retail traders often enter after the move becomes obvious. By that time, large market participants may already have been building positions.
This creates an interesting relationship between two major groups in financial markets:
Smart money and retail traders.
They don't always trade in the same way, and they don't always enter at the same time.
Understanding how their behavior interacts can help explain why markets trend, consolidate, reverse, and sometimes move in unexpected directions.
Who Are Smart Money and Retail Traders?
The term "smart money" is commonly used to describe large and experienced market participants.
This can include:
Banks
Hedge funds
Asset managers
Institutions
Professional trading firms
Retail traders are individual market participants trading with comparatively smaller positions.
The difference is not simply about who is smarter.
It is mostly about size, information, experience, and execution.
Large institutions often have the resources to analyze markets in greater depth and manage positions that are far too large for a typical retail trader.
But even institutions cannot predict the future with certainty.
They are still participants in the same market.
How Large Players Build Positions
Imagine an institution wants to buy a very large amount of an asset.
If it buys everything at once, price may move sharply higher, making the remaining purchases more expensive.
Instead, large participants may build positions gradually.
This can happen while price is moving sideways or during periods of uncertainty.
To the average trader, the market may look boring.
But beneath the surface, significant buying or selling may be taking place.
Eventually, when the balance between supply and demand shifts strongly enough, price begins to move.
This is where a trend can start.
Retail Traders Often Join Later
Retail traders frequently enter after a trend becomes visible.
A breakout occurs.
The chart looks bullish.
News becomes positive.
Social media starts discussing the move.
More traders notice the opportunity and begin buying.
Their participation adds further demand.
This can help accelerate the existing trend.
The same thing happens in reverse during downtrends.
As price falls, fear spreads.
Retail traders begin selling.
Stop losses are triggered.
Leverage positions may be liquidated.
The additional selling pressure can push price even lower.
In this way, retail participation can sometimes amplify a trend that has already begun.
The Psychology of the Crowd
Markets are heavily influenced by human emotion.
When prices rise, people become optimistic.
When prices continue rising, confidence turns into excitement.
Eventually, excitement can become greed.
The opposite happens during declines.
Uncertainty becomes fear.
Fear turns into panic.
These emotional cycles create predictable behavior among large groups of traders.
Smart money is not necessarily trying to "trick" retail traders.
However, large participants understand that markets are driven by liquidity and human behavior.
They know where traders are likely to place orders.
They know that obvious highs, lows, support levels, and resistance zones often attract significant activity.
Understanding this behavior can influence how large positions are executed.
Why Liquidity Matters
Liquidity is one of the most important pieces of the puzzle.
Large traders need other participants to take the opposite side of their transactions.
For example, an institution looking to sell a large position needs enough buyers willing to purchase from them.
This is one reason price often moves toward areas where many orders are concentrated.
These areas may include:
Previous highs
Previous lows
Equal highs and lows
Major support and resistance
Breakout levels
Psychological price levels
When price reaches these areas, trading activity can increase significantly.
Sometimes the resulting movement creates a breakout.
Other times, price briefly moves beyond the level before reversing.
This is why understanding liquidity can provide useful context when analyzing market behavior.
How Trends Become Self-Reinforcing
A trend often begins with a relatively small shift in supply and demand.
As price moves, more traders notice.
New participants enter.
Momentum traders join.
Breakout traders react.
The media begins covering the move.
Retail traders become increasingly interested.
Each new participant can add more buying or selling pressure.
The trend becomes self-reinforcing.
This is one reason markets can move much further than many traders initially expect.
The trend is no longer being driven by the original participants alone.
It is now being supported by an expanding crowd.
When the Crowd Becomes Too Confident
Trends eventually reach a point where optimism or pessimism becomes extreme.
At the top of a strong rally, almost everyone may already be bullish.
New buyers continue entering because they fear missing out.
But if most potential buyers have already entered, there may be less new demand available to push prices higher.
At the same time, experienced participants may begin taking profits.
The market becomes vulnerable to a change in sentiment.
The same principle applies during major sell-offs.
When fear reaches an extreme, sellers may become exhausted.
This is often where market cycles begin to change.
Smart Money vs. Retail Money Is Not Always a Battle
It's tempting to think of the market as a simple battle between institutions and retail traders.
Reality is much more complicated.
Institutions can also be wrong.
Retail traders can also identify trends early.
Sometimes both groups are buying.
Sometimes both are selling.
And sometimes different institutions have completely different opinions about the same asset.
The market is not a game where one group always wins.
It is a continuous auction involving millions of participants with different goals, time horizons, and strategies.
What Retail Traders Can Learn
Retail traders cannot compete with institutions on size.
They don't need to.
Their biggest advantage is flexibility.
A retail trader can enter or exit a position quickly.
They can focus on smaller opportunities.
They can remain patient and wait for the right setup.
Instead of trying to predict what large institutions are doing, traders can focus on observing what price is actually showing.
Look for changes in:
Market structure
Volume
Liquidity
Price action
Support and resistance
Trend strength
The goal is not to follow "smart money" blindly.
The goal is to understand the behavior of the market and react accordingly.
Final words
Market trends are not created by one group alone.
Large institutions may provide significant buying or selling pressure.
Retail traders can add momentum and amplify emotional moves.
News and sentiment can attract even more participants.
Together, these forces create the trends we see on our charts.
The most useful lesson is not to think of smart money and retail traders as two opposing teams.
Instead, think of the market as a constantly changing ecosystem of participants.
Some enter early.
Some enter late.
Some provide liquidity.
Some chase momentum.
Some take profits.
And some panic at exactly the wrong time.
When you begin to understand how these different participants interact, price movements start to make more sense.
Because behind every trend is a story.
A story of positioning, liquidity, psychology, and changing expectations.
And the chart is where that story is ultimately revealed.
Truncation (Truncated Fifth) – When 5th Fails to Exceed 3rdA Truncation (or Truncated Fifth) occurs when Wave 5 completes with all five internal sub-waves but fails to move beyond the end of Wave 3. This is a rare Elliott Wave pattern that signals an extremely strong opposing force entering the market.
This chart illustrates both bullish and bearish truncation scenarios.
🟢 Bull Market Truncation :-
In a bullish trend, the market advances with a normal five-wave impulse.
Wave (1) rallies with 5 internal waves.
Wave (2) forms an ABC correction.
Wave (3) extends strongly and becomes the dominant impulse.
Wave (4) corrects the advance.
Wave (5) also develops with five internal sub-waves, but fails to break above the top of Wave (3).
This inability to make a new high is called Bull Market Truncation.
Although Wave (5) contains a complete five-wave structure internally, the overall advance is weaker than expected, showing that buyers are losing momentum while sellers are gradually taking control.
🔴 Bear Market Truncation :-
The same principle applies in reverse during a bearish trend.
Wave (1) declines with five waves.
Wave (2) corrects upward as an ABC pattern.
Wave (3) produces the strongest decline.
Wave (4) retraces the move.
Wave (5) again unfolds in five internal waves, but fails to move below the end of Wave (3).
This creates a Bear Market Truncation, indicating that selling pressure is fading and buyers are beginning to absorb the decline.
⚠️ The Most Important Rule :-
Many traders mistakenly identify any weak fifth wave as a truncation.
That is incorrect.
A valid truncated fifth must still contain five internal sub-waves.
✔ Wave 1 → 5 sub-waves
✔ Wave 3 → 5 sub-waves
✔ Wave 5 → 5 sub-waves
A truncated fifth does not become a three-wave correction simply because it failed to make a new extreme.
📌 Trading Insight :-
A truncation often appears near the end of a mature trend and warns that the current trend is exhausting itself.
When confirmed, it frequently precedes:
A sharp reversal,
A larger corrective phase,
Or the beginning of a new trend in the opposite direction.
Because truncations are relatively uncommon, they should always be confirmed with proper Elliott Wave structure and other technical evidence rather than assumed solely because Wave 5 failed to make a new high or low.
*********************************************************
Warning ⚠
Educational purpose only. Always combine Elliott Wave analysis with sound risk management and confirmation from price action.
*********************************************************
#ElliottWave #ElliottWaveTheory #TruncatedFifth #Truncation #MotiveWave #ImpulseWave #Wave3 #Wave5 #LeadingDiagonal #EndingDiagonal #CorrectiveWave #CorrectiveWaves #Zigzag #DoubleZigzag #TripleZigzag #FlatCorrection #Triangle #FractalMarkets #MultiTimeframeAnalysis #WaveAnalysis #TechnicalAnalysis #ChartAnalysis #ChartPattern #PriceAction #MarketStructure #TradingEducation #TradingPsychology #TradingView #StockMarket #Trading #Trader #Investing #LearnTrading #SwingTrading #IntradayTrading #PositionTrading #PositionalTrading #Nifty #BankNifty #NSE #RECLTD #Stocks #NikhilKanal
Education 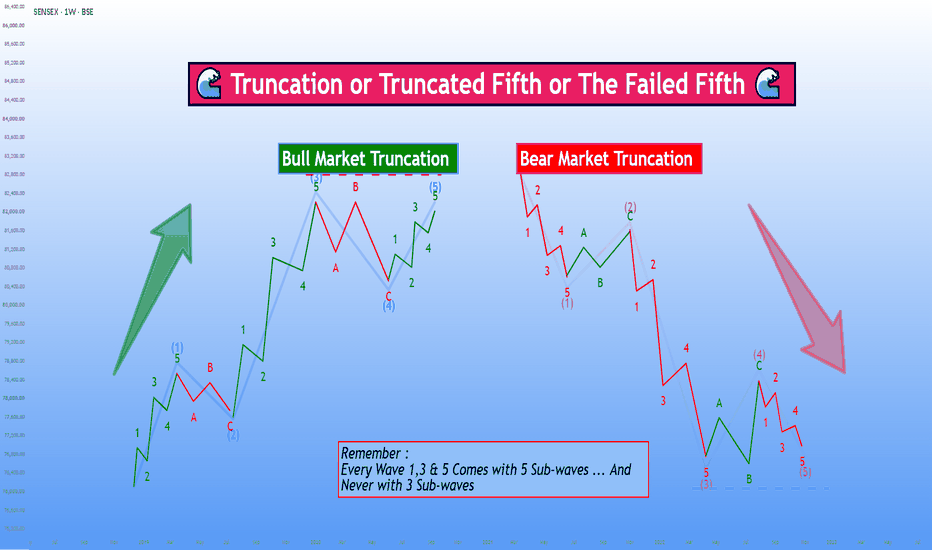
Long 
XAUUSD: Bullish Wave 5 may begin after pullback.Gold is showing a clear recovery structure after completing the previous bearish cycle near the lower area. From Kelly’s view, the chart is now shifting into a bullish Elliott sequence, but price may still need one corrective pullback before wave 5 continues higher.
The key idea is simple: gold is bullish in the short term, but the better setup may come from a clean retest of the buy zone, not from chasing the current push.
⟡ Market structure
The chart shows gold has reacted strongly from the lower base near 3,960 and created a sequence of higher lows. Price has already broken back above the descending pressure line, which is an important sign that sellers are losing control in the short-term structure.
Gold is now trading around 4,075 after a strong recovery move. However, price is approaching the 4,090–4,100 sell wave 4 zone, so a short correction from this area would be normal.
The main support to watch is the 4,040–4,050 buy zone wave 5. If gold pulls back into this area and buyers defend it, the next upside leg may continue towards the Fibonacci 2.618 target near 4,145–4,155.
➤ Key levels
◌ 4,040–4,050: buy zone wave 5 and key pullback area
◌ 4,075: current price reaction area
◌ 4,090–4,100: sell wave 4 / short-term resistance
◌ 4,138: previous Fibonacci reference zone
◌ 4,145–4,155: final wave 5 completion area
◌ Below 4,030: area where the bullish setup starts to weaken
◌ Below 4,000: area where the wave count needs reassessment
⌁ Elliott Wave view
From an Elliott Wave perspective, gold appears to be building a bullish 5-wave recovery after the previous bearish structure ended.
Wave 1 created the first upside reaction from the low.
Wave 2 corrected back but held above the base.
Wave 3 expanded strongly and pushed gold back above the broken trendline.
Wave 4 may now form as a controlled pullback into the 4,040–4,050 buy zone.
If that zone holds, wave 5 may begin and aim for the 4,145–4,155 completion area.
This is why Kelly would not chase the current price directly into resistance. The stronger setup is to wait for wave 4 to finish, then look for confirmation that wave 5 is starting.
▸ Trading scenario
Preferred scenario: wait for gold to pull back into the buy zone wave 5 and show bullish confirmation.
Entry zone: 4,040–4,050 if bullish confirmation appears
Stop loss: below the confirmed wave 4 low or below 4,030
Take profit 1: 4,090–4,100
Take profit 2: 4,138
Take profit 3: 4,145–4,155
Alternative scenario: if gold breaks above 4,100 without a pullback and holds strongly, price may continue directly towards the wave 5 target. In that case, a retest of 4,090–4,100 as support would become the cleaner continuation setup.
⌁ Kelly’s view
For Kelly, the bullish recovery structure is improving, but the market is now close to a short-term resistance zone. That means the best plan is patience.
If gold corrects into 4,040–4,050 and buyers defend the zone, the next wave 5 move may continue towards the higher Fibonacci target.
Gold is building a bullish Elliott structure.
A controlled pullback may prepare the next move higher.
Share your view below. Long 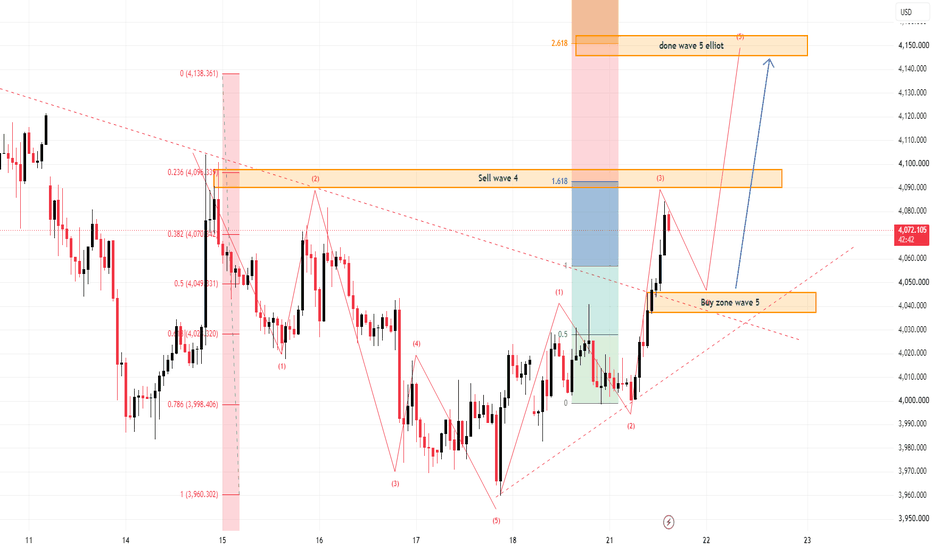
EWP, understanding WXY Pattern Combinations - Part 2(HDFC Bank) In my earlier post, I explained WXY Combinations using Mahindra & Mahindra. Let's reinforce the concept with another live example—HDFC Bank, one of the most influential constituents of the Nifty 50.
Under the Elliott Wave Principle, corrections are not always limited to a single Flat, Zigzag, or Triangle. Quite often, these simpler corrective structures combine to extend both time and price . These are known as Combinations, and are labelled WXY (Double Three) or WXYXZ (Triple Three).
HDFC Bank appears to be undergoing one such WXY Combination after completing a larger-degree impulse wave on 23 October 2025.
Wave "W" – Zigzag
The first corrective structure (Wave W) is a Zigzag.
Wave A was relatively small.
Wave C extended significantly, reaching approximately 2.414 times the length of Wave A.
Wave “W” got completed on 1 April 2026.
The internal wave subdivisions are shown on the chart.
Wave "X" - Counter wave
Wave X developed as a small five-wave impulse, completing on 16 April 2026, and connected the two corrective structures.
Wave "Y" – Expanded Flat
The stock then began forming Wave Y, which currently appears to be an Expanded Flat .
Both Wave A and Wave B display clear three-wave structures, satisfying one of the key characteristics of a Flat.
Since Wave B has retraced more than 100% of Wave A, this correction is classified as an Expanded Flat.
Wave C is currently developing.
What Should We Watch Next?
If this wave count remains valid, Wave C should complete the Expanded Flat by forming at least an equal or lower low than Wave W. Based on the current structure, that places the focus around the 726–727 zone, with Wave C ideally unfolding as a five-wave motive sequence .
Given HDFC Bank's significant weight in the Nifty 50, its ongoing corrective structure could continue to act as a headwind for the index, although the broader market direction will also depend on the behavior of the other index constituents.
Key Learning
One of the biggest challenges in Elliott Wave analysis is recognizing when a correction has not yet finished. WXY combinations often extend corrections in both time and price, testing the patience of traders who assume the first ABC correction marks the end of the move.
Educational purpose only. Not a buy or sell recommendation.
If you wish me to cover any other important concept in EWP, leave a comment, I will post same when I come up with a live example.
 Education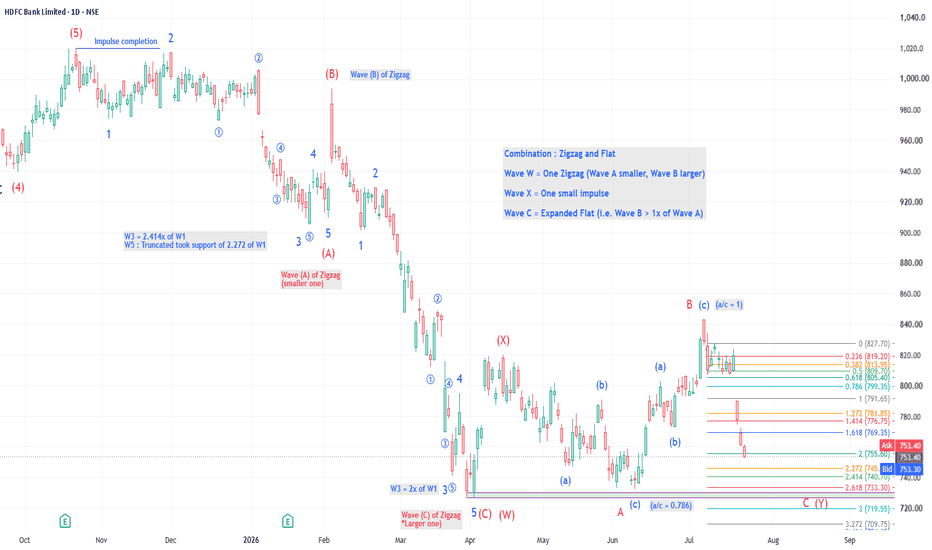
 Long
Long
Nifty : Intraday Trading Plan: 22-Jul-2026
Welcome traders! 👋 Here is a detailed, professional trading plan for Nifty 50 for the upcoming session. We will analyze the chart structure to define our strategy for every possible opening scenario.
🎨 Chart Legend & Color Code
🟠 Orange Line/Box: No Trade Zone / Sideways Market / Caution Area.
🟢 Green Line/Box: Bullish Zone / Support / Long Side.
🔴 Red Line: Bearish Zone / Resistance / Short Side.
⚪ Dashed Line: Probable Trend (Maybe/Maybe Not) – Wait for confirmation!
📈 Overall Nifty Trend (Intraday)
Looking at the chart, Nifty is currently trading at 24,193.95. The market is in a consolidation phase after recent volatility.
Immediate Bias: Neutral to Slightly Bullish.
Key Observation: The price is sandwiched between the Opening Support (24,146) and Opening Resistance (24,230-24,251).
The "Green" Path: If buyers defend 24,146, we could see a solid move up towards 24,317 (Last Intraday Resistance) and potentially 24,375.
The "Red" Path: If sellers push price below 24,146, we might see a slide down to the 24,033-24,056 support zone.
🚀 Scenario 1: Gap Up Opening (100+ Points)
(Expected Open: ~24,295 - 24,300)
If the market gaps up by 100+ points, it will open very close to the Last Intraday Resistance (24,317) and well above the Opening Resistance Zone (24,230-24,251).
🔍 Analysis: A gap up of this magnitude often leads to profit booking. The price is entering the "Red Zone" (Resistance).
🟢 Bullish Action (Long): Do not chase the gap immediately. Wait for the price to sustain above 24,317 (Red Line). If a 15-min candle closes above this level, look for a move towards 24,375 (following the green dashed line).
🔴 Bearish Action (Short): If the price opens near 24,300 and shows rejection candles (Shooting Star, Bearish Engulfing) at 24,317, initiate a Short position. The target would be a gap fill down to 24,250.
🟠 No Trade: Avoid buying right at the open as the Risk:Reward ratio is poor near resistance.
⚖️ Scenario 2: Flat Opening
(Expected Open: ~24,180 - 24,210)
If the market opens flat, it opens right in the middle of the chart, between the Orange Line (24,146) and the Orange Box (24,230-24,251).
🔍 Analysis: This is the classic "Chop Zone". The market lacks direction initially.
🟠 No Trade Zone: The zone between 24,146 and 24,230 is your "Sideways" area. Trading here is dangerous for option buyers due to Theta decay.
🟢 Bullish Action (Long): Wait for a breakout above the Orange Box (24,251). Once confirmed, go Long with a target of 24,317.
🔴 Bearish Action (Short): Wait for a breakdown below the Orange Line (24,146). Once confirmed, go Short with a target of 24,056 (Green Box).
⚪ Dashed Line Logic: The red dashed line shows a potential drop from the resistance zone, while the green solid line shows a potential rise from support. Patience is key here!
📉 Scenario 3: Gap Down Opening (100+ Points)
(Expected Open: ~24,090 - 24,100)
If the market gaps down significantly, it opens below the Orange Line (24,146) and heads straight towards the Last Intraday Support (24,033-24,056).
🔍 Analysis: Panic selling might occur initially. The price is entering the "Green Box" (Strong Support).
🟢 Bullish Action (Long): Watch the 24,033-24,056 zone closely. If the price stabilizes here and forms a reversal pattern (like a Hammer), take a Long position for a bounce back to 24,146 (following the green dashed line up).
🔴 Bearish Action (Short): If the price crashes through 24,033 with high volume, the support has failed. Go Short (follow the trend down).
️ Caution: Gap downs often see a "Dead Cat Bounce". Don't short right at the support line; wait for a breakdown.
🛡️ Risk Management Tips for Options Trading
Trading options requires strict discipline. Here are some golden rules:
Stop Loss is Mandatory: Never trade without a Stop Loss (SL). For options, a 10-15% premium SL or a spot level SL (as mentioned above) is crucial.
🔹 Position Sizing: Never risk more than 2-5% of your total capital on a single trade. If you have ₹1 Lakh, don't lose more than ₹2,000-₹5,000 on one setup.
🔹 Avoid the "Orange Zone": If the market is sideways (Flat opening scenario), option buyers will lose money due to time decay (Theta). Stay out or trade very small quantities.
🔹 Trail Your SL: Once you are in profit, move your Stop Loss to your entry price (Cost-to-Cost). Protect your capital first!
🔹 Don't Average Losers: If a trade goes against you, exit. Do not add more quantity to a losing position hoping for a recovery.
Summary & Conclusion
To summarize the plan for 22-Jul-2026:
Trend: The market is range-bound. Watch 24,146 (Support) and 24,230-24,251 (Resistance).
Gap Up: Watch for rejection at 24,317 (Short) or breakout (Long to 24,375).
Flat: Stay out of the 24,146 - 24,230 zone (Orange/No Trade). Trade the breakout/breakdown only.
Gap Down: Watch for support at 24,033-24,056 (Long for bounce).
Conclusion: The chart suggests a battle between bulls and bears in the 24,146 - 24,251 range. The Orange zones indicate areas of confusion—avoid trading there. Wait for the market to pick a direction (Green or Red lines) before committing your capital. The dashed lines remind us that anything is possible, so always wait for candle confirmation! 📈📉
⚠️ Disclaimer:
I am not a SEBI registered analyst. This post is for educational purposes only. Trading in the stock market and F&O involves high risk and can lead to capital loss. Please consult your financial advisor before taking any trades. The charts and levels are based on technical analysis and probabilities, not guarantees. 🙏 Long