TCS: The Flag That Volume Almost RuinedTCS has been moving sideways for weeks now. Slow charts like this often get ignored. But a slow chart can still be telling a story — you just have to read it patiently. Here is what I am seeing.
The Big Move First
Back in July, TCS made a sharp low near 1,977 and then rallied fast, almost in a straight line, up to about 2,495. That rally was clean and steady — no big overlaps, just strong steps up. I am marking this move as wave A (or wave 1, if you prefer the impulsive count).
The Pause After That
Since early August, the stock has been drifting down in a slow, tilted channel. Notice how the candles overlap each other here — that is very different from the sharp, clean climb before it. Overlapping price action like this usually means the market is resting, not reversing the bigger trend. This looks like a flag — a pause after a strong pole, not a breakdown.
What Volume Is Saying
Volume has been shrinking through this pause. That is a good sign — it tells us sellers are not pushing hard, they are just taking profit. But the latest session broke that pattern. It printed the biggest volume of the whole pause, and yet the candle opened high and closed near its low. That is not the kind of volume you want to see just yet. It looks more like a test that got rejected than a breakout. So for now, this is a caution flag, not a green light.
Invalidation Level:
Every idea needs a level where it breaks. For this setup, that level is around 2,088. This is the 0.786 retracement of the July-August rally. As long as TCS holds above this zone, the flag idea stays alive. A close below 2,088 would mean this is no longer a simple pause — it would call for a fresh look at the chart, not a hope-and-hold approach.
What I Am Watching Next
I want to see two things before trusting this setup: price holding above the 2,088 zone, and a strong up move that comes with rising volume, not shrinking volume. Only then does the flag idea get real support. Until that shows up, this remains a wait-and-watch chart, not a chase-it chart.
Disclaimer:
I am not a SEBI registered research analyst. This post is shared only for education and learning purposes, based on my personal reading of the chart. It is not a buy or sell recommendation. Please do your own research or speak to a registered advisor before taking any trading decision.  Long
Long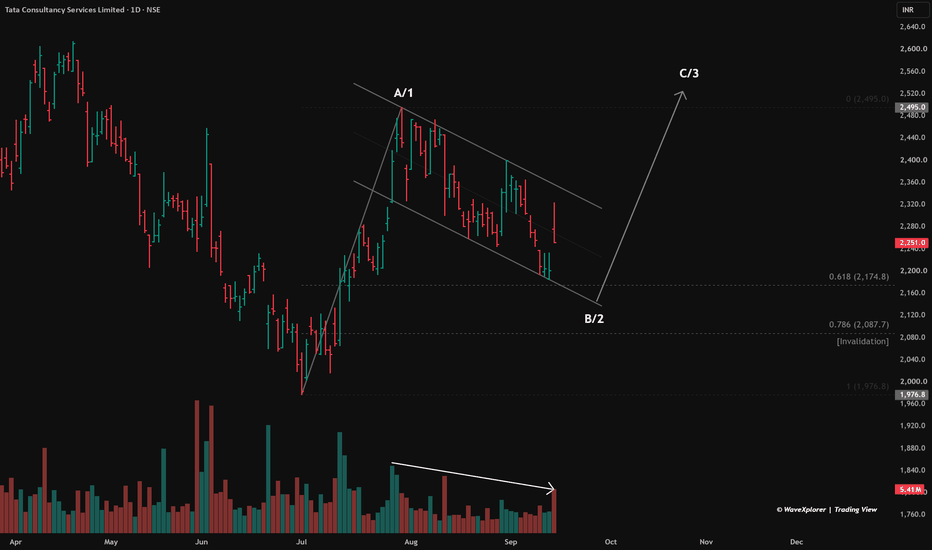
NIFTY — INTRADAY TRADING PLAN | 16-SEP-202615-Minute Chart • Price Action • Opening Scenarios
MARKET BIAS
NIFTY remains in a bearish structure with lower highs and lower lows. The immediate decision zone is 23,152–23,195 .
Primary Bias: Bearish / Sell on Rise
Bullish Shift: Sustained acceptance above 23,360
━━━━━━━━━━━━━━━━━━
KEY LEVELS & ACTION PLAN
23,443 — Major Resistance
Strong overhead supply zone.
• Rejection → Short setup after confirmation
• 15-min close above → Bullish breakout possibility
23,360 — Last Intraday Resistance
First major hurdle during any recovery.
• Rejection → Look for short
• Break + retest → Long toward 23,443
23,152–23,195 — Opening Resistance / Support Zone
KEY DECISION ZONE.
• Sustains above → Bullish intraday setup
• Rejection below → Bearish setup
23,037 — Last Intraday Support
• Hold + reversal → Bounce possible
• 15-min close below → Downside continuation
22,701–22,607 — Buyer’s Support / Consolidation Zone
Wait for selling exhaustion and bullish confirmation before considering longs.
━━━━━━━━━━━━━━━━━━
OPENING SCENARIOS
Using approximately 100 points as the gap reference:
GAP UP → Above ~23,272
Do not chase the gap.
• Sustains above opening → Long on confirmation
• Targets: 23,360 → 23,443
• Falls back below 23,195 → Gap-failure short setup
FLAT / NORMAL OPEN → ~23,072–23,272
Wait for reaction around 23,152–23,195 .
• Hold above → Long toward 23,360
• Reject below → Short toward 23,037
GAP DOWN → Below ~23,072
Do not short blindly at the open.
• Weak recovery + rejection → Short
• Breakdown below 23,037 → 22,701–22,607 becomes next major support
• Reclaim 23,152–23,195 → Avoid shorts; recovery can target 23,360
━━━━━━━━━━━━━━━━━━
EXECUTION RULE
Break → 15-min Close → Retest → Confirmation → Entry
Avoid trading the first 15–30 minutes impulsively, particularly after a large gap.
RISK MANAGEMENT
• Risk only a small portion of trading capital per trade.
• Prefer minimum 1:2 Risk/Reward .
• Maximum 2–3 quality trades; avoid overtrading.
• Never average a losing intraday position emotionally.
• Options traders should account for time decay and volatility.
• Protect capital first; profit comes second.
KEY LEVEL OF THE DAY:
23,152–23,195
The level is not the trade — the reaction at the level is the trade.
━━━━━━━━━━━━━━━━━━
DISCLAIMER
This post is for educational and informational purposes only . I am NOT a SEBI Registered Research Analyst or Investment Adviser . This is not investment advice or a recommendation to buy or sell any security.
Trading in stocks, futures and options involves substantial risk. Please conduct your own research and consult a SEBI-registered professional before making financial decisions.
Trade the setup. Manage the risk. Protect the capital.
BRIAN XAUUSD – GOLD WEAK BELOW 4,338 BRIAN XAUUSD – GOLD WEAK BELOW 4,338
Gold remains under pressure as the market moves into the FOMC decision window.
Price is now trading around 4,275 after another failed recovery attempt, while the broader short-term structure continues to show lower highs and weak buyer follow-through. Fundamentally, the market is still cautious. Gold is marking another down day as traders wait for the two-day FOMC policy meeting, and this keeps positioning defensive ahead of the rate decision.
When gold trades near a one-month low before a major Fed event, the market usually becomes very sensitive to any rejection or breakdown around key value zones. That is exactly what the current chart is showing.
Technical structure
On the H1 chart, gold is trading below the Current VAH / POC immediate volume zone around 4,290 - 4,306.
This zone is important because it was the latest short-term value area. Price tried to stabilize there, but the reaction was weak. As long as gold stays below this zone, buyers do not have real control.
The next important resistance is the Key Rotation Area around 4,338 - 4,365. This is the area where any recovery may face stronger selling pressure. If gold pulls back into this zone and rejects, the bearish continuation view remains valid.
Above that, the Upper Value Rejection zone around 4,500 remains the major seller interest area. This was where the larger bearish rotation started, and it continues to define the upper structure.
On the downside, gold is now approaching the 4,232 area. If sellers keep control below 4,306, the market can rotate lower into this level before any stronger buyer reaction appears.
Important zones
Current price area: 4,265 - 4,280
Gold is trading near the lower part of the structure after losing short-term value.
Current VAH / POC: 4,290 - 4,306
Immediate resistance. Buyers need to reclaim this area to slow the bearish pressure.
Key Rotation Area: 4,338 - 4,365
Main reaction zone if gold attempts a deeper pullback.
Strong Acceptance Zone: 4,290 - 4,310
Previous value support, now acting as a pressure area after the breakdown.
Upper Value Rejection: 4,490 - 4,510
Major seller interest zone and higher resistance.
Downside liquidity: 4,232 - 4,240
Next lower target if sellers continue pushing the auction lower.
Trading scenario
Priority view: sell on recovery below 4,306
Entry:
Look for sell positions only if gold rebounds into 4,290 - 4,306 or higher into 4,338 - 4,365 and shows clear bearish rejection.
Stop Loss:
Above the rejection high or above the reclaimed value zone.
Take Profit:
TP1: 4,250
TP2: 4,232 - 4,240
TP3: 4,200 if FOMC-driven momentum supports another downside expansion
This setup follows the current bearish structure. Gold has already lost short-term value, so chasing sell late near the low is not ideal. The cleaner plan is to wait for a retest and rejection from resistance.
Alternative buy scenario
A buy setup is only interesting if gold sweeps the 4,232 - 4,240 liquidity area and shows strong bullish rejection.
Entry:
Buy only after clear confirmation from the lower liquidity zone.
Stop Loss:
Below the local sweep low.
Take Profit:
TP1: 4,290 - 4,306
TP2: 4,338
TP3: 4,365 if buyers reclaim momentum
This would only be a reaction-buy setup, not a full bullish reversal yet. For a stronger recovery, gold needs to reclaim 4,306 first, then hold above 4,338.
Final view
Gold is still under seller control while trading below 4,306.
The market is heading into the FOMC meeting with weak momentum, and the current chart suggests that sellers are still defending every recovery attempt. The nearest downside area to watch is 4,232 - 4,240. If price reaches this zone, buyer reaction may appear, but confirmation is needed before considering any long setup.
For now, my map is simple:
Below 4,306 = sellers keep control.
Reject 4,306 = downside pressure continues.
Break 4,338 = recovery improves.
Reject 4,338 - 4,365 = bearish structure remains valid.
Lose 4,232 = downside can extend toward 4,200.
Gold is not in a clean bullish position yet. The best approach is patience: wait for either a confirmed rejection from resistance or a strong reaction from the lower liquidity zone.
Will gold defend 4,232 before the FOMC decision, or will sellers force one more deep flush first?
 Long
Long
 Long
Long
 Short
Short
Short 
BTCUSDT: Bears Dominate, Next DownsideBTCUSDT is trading around 78,260 USDT and remains within a descending channel on the H1 timeframe. The price is currently below the EMA34 (approx. 78,630) and EMA89 (approx. 78,930), indicating that sellers retain the short-term advantage.
The 78,500–79,200 range is a notable "Sell Zone," as it aligns with the EMA cluster and the upper boundary of the descending channel. Should BTC rally to this area but face rejection, I lean towards a scenario where the price breaks below 77,500, subsequently extending toward the 75,500 USDT target.
The day's macroeconomic backdrop supports a bearish outlook: Brent crude remains above $100/barrel, the 10-year Treasury yield hovers around 4.84%, and the market is pricing in a roughly 60% probability of a Fed rate hike—factors that are dampening risk appetite ahead of US inflation data.
The bearish scenario would be invalidated if BTC breaks out of the channel and establishes firm support above the 79,200–79,500 level.  Short
Short
#BANKNIFTY Intraday PE & CE Levels(15/09/2026)Bank Nifty is expected to open flat, with the index around 56,606. The chart shows a strong recovery from the recent lower levels, and the index is now trading above the important 56,550 support zone. However, it is approaching the next major resistance near 56,950, so the opening session may remain range-bound until a clear breakout.
On the bullish side, 56550 is the immediate support. If Bank Nifty sustains above this level and moves decisively higher, the index can continue its recovery toward 56750, 56850 and 56950. A sustained breakout above 56950 can further strengthen the bullish momentum.
On the bearish side, failure to hold 56550 can bring selling pressure back into the market. A break below 56450 may lead to a correction toward 56250, 56150 and 56050, with 56,050 acting as an important support.
Overall, 56,550–56,950 is the key trading range for the session. With a flat opening, traders should wait for a confirmed move outside this range. Holding above 56,550 keeps the recovery structure intact, while a sustained breakout above 56,950 can signal further upside. XAU/USD - Bullish Structure, Upward Wave PotentialOANDA:XAUUSD is testing the 4,280–4,350 buy zone again, creating a potential double-bottom structure. Buyers are defending the same area that triggered the previous recovery, but the descending trendline is still the key barrier.
If support holds and Gold breaks above the trendline, I favor a recovery toward:
🎯 Target: 4,500
Macro Market: The fundamental backdrop is still a headwind for Gold. Markets are pricing roughly an 86% probability of a Fed rate hike this week, while elevated Treasury yields and oil above $100 continue to reinforce inflation concerns. Safe-haven demand from Middle East tensions offers some support.
A sustained H2 break below 4,280 would invalidate the bullish setup.
AURICVERSE View: the support is attractive, but I wouldn’t front-run the reversal. Hold the double bottom + break the trendline, and 4,500 becomes the next level in focus. Long 
BTCUSDT: Sell Zone Holds, 75.5 Next TargetBTCUSDT is trading around 77,300 USDT, remaining firmly within a descending channel. Despite multiple attempts to rally, the price has failed to break the pattern of lower highs and continues to fluctuate below the EMA89 (near 77,830), indicating that buying pressure is insufficient to reverse the short-term trend.
The 77,500–78,000 range is the area I am watching most closely. It serves as a "Sell Zone" that aligns with both the EMA and the upper boundary of the descending channel. If BTC rallies to this zone but faces rejection, there is a high probability of a pullback to 76,500, followed by an extension toward the primary target near 75,500 USDT.
Early-week macroeconomic factors also lean toward a "risk-off" sentiment. Brent crude has risen nearly 3% due to supply concerns in the Middle East, while the market is pricing in an approximately 86% probability of a 25bp Fed rate hike this week. US Treasury yields remain elevated, exerting further pressure on crypto and other risk assets.
The bearish scenario would be invalidated if BTC breaks out of the channel and establishes firm support above the 78,300–78,500 level.
Will BTC retest the Sell Zone before sliding further toward 75.5K? Short 
XAUUSD — Bearish Channel Toward 4,175XAUUSD — Bearish Channel Toward 4,175
Gold is still moving inside a clear bearish channel after failing to reclaim the upper resistance trendline. From Kelly’s view, the chart suggests that XAUUSD remains under downside pressure, and the current recovery may only be a short correction before the next bearish wave continues.
The key idea is simple: gold is trading near the sell zone, and if buyers fail to break above this area, sellers may push price back toward lower support and the final target zone.
⟡ Market structure
Gold is currently trading around 4,333, right below the short-term sell zone near 4,335–4,350. This area is important because it sits close to the descending trendline and may act as the next rejection zone.
The broader structure is still bearish. Price is forming lower highs inside the downtrend channel, while each recovery remains limited under resistance. If gold rejects from the current sell zone, the first downside area to watch is the strong support zone around 4,285–4,300.
A clean break below this support may open the next move toward the 4,235–4,245 buy scalping area. If bearish momentum continues, the final target remains near 4,170–4,180.
➤ Key levels
◌ Current price area: 4,333
◌ Sell zone: 4,335–4,350
◌ Strong support: 4,285–4,300
◌ Buy scalping zone: 4,235–4,245
◌ Main bearish target: 4,170–4,180
◌ Bearish invalidation: above 4,360–4,380
⌁ Elliott Wave view
The chart shows a possible bearish Elliott Wave continuation.
Wave (1) may have started after price rejected from the upper channel area.
Wave (2) created a corrective rebound but failed below the downtrend resistance.
Wave (3) may now continue lower toward 4,235–4,245.
Wave (4) could create a short recovery from the buy scalping area.
Wave (5) may complete the bearish structure near 4,170–4,180.
This is why Kelly is not chasing buys at the current price. The cleaner plan is to watch the sell zone and wait for bearish confirmation before following the next downside leg.
▸ Trading scenario
Preferred bearish scenario
Entry: Sell around 4,335–4,350 if price gives bearish rejection
Stop Loss: Above 4,380
Take Profit 1: 4,285–4,300
Take Profit 2: 4,235–4,245
Take Profit 3: 4,170–4,180
Alternative entry
If gold breaks below 4,285 and retests it weakly, sellers may look for continuation toward 4,235–4,245 and then 4,170–4,180.
◌ Invalidation
The bearish view becomes weaker if gold breaks above 4,360–4,380 and holds above the descending trendline. In that case, the current bearish wave structure may be delayed, and price could attempt a stronger recovery first.
⌁ Kelly’s view
Kelly’s main view remains bearish while gold stays below the 4,335–4,350 sell zone and the descending trendline. The market is still moving inside a downward structure, so rebounds are more likely to be watched for rejection than chased as bullish continuation.
If sellers defend the sell zone, gold may continue toward 4,285–4,300, then 4,235–4,245, with the larger target near 4,170–4,180.
Do you think gold will reject from the sell zone first, or retest strong support before the next wave lower? Short 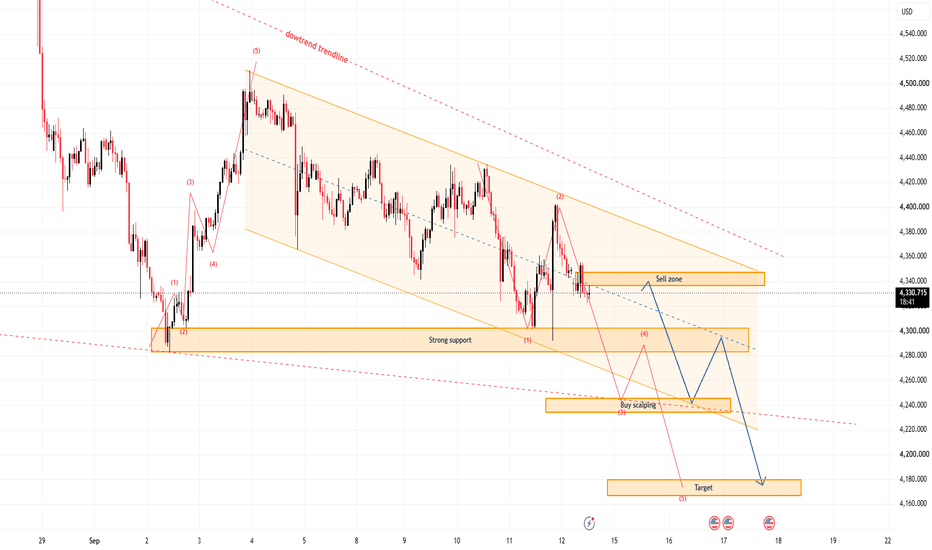
Long 
11th Sep 2026 — Nifty Report — Markets in Bear’s Hold?Nifty Stance: Bearish
Nifty fell 499 pts (-2.09%) this week and closed just above the crucial support of 23357. A rising ADX had given clues last week that Nifty would start to trend, and this week proved it. From Monday to Thursday, Nifty followed a waterfall-type fall with no retracement. But on Friday, Nifty took support at 23357 levels and showed some strength.
Our bearish view continues, and if Nifty makes a sharp fall, it would be a good sign for the bulls, as it would confirm that the near-term bottom is in place. However, if the downward move is slow, it indicates further pain for the bulls as well as investors.
Interestingly, the Nifty midcap and smallcap indices had caught up and were trading near their tops when further news of the West Asia war escalation broke. Since Nifty is significantly lower than its ATH, but the smaller indices are near their tops, it could mean a perfect inflection point, and that time has really come for Nifty to start its next bull run.
Important Things to Watch for the Next Week
Data points to watch from a domestic perspective: WPI and CPO Inflation data, FX reserves, M3 money supply. Our markets are closed on 14th Sep due to Ganesh Chaturthi.
Data points to watch from a global perspective: UK & Euro CPI, UK and Japan interest rate decisions, US Fed interest rate decision & FOMC statement.
IPO Listing: Kanohar Electricals on 15th Sep, Glass Wall Systems on 16th Sep, Asset Reconstruction Company, Karamtara Engineering, LCC Projects, Manipal Payment and Identity Solutions, Rentomojo, Steamhouse, Amtech Esters, Infrax Renewable, Vinod Texworld on 17th Sep
If Nifty goes up, the resistance levels to watch are 23793, 23925, and 24192. If Nifty falls, the support levels are 22781, 22519, and 22453.
DISCLAIMER
Investments in the securities market are subject to market risks, including the potential loss of principal. Past performance does not guarantee future results. Information provided is for educational purposes only and should not be considered financial advice. Investors should read all related documents carefully and consult a certified advisor before investing. Registration granted by SEBI and Enlistment with RAASB/BSE and certification from NISM in no way guarantee performance of the intermediary or provide any assurance of returns to investors. The investor is requested to take into consideration all the risk factors before actually trading in stocks or derivatives. The SEBI RIA license INA000021757 & RA license INH000025045 are for Balachandran RV Short 
 Long
Long
Short 
Long 
 Short
Short
NIFTY — TRADING PLAN FOR 14-SEP-2026 First Move for reveresal ?
If you like and it helps in your trading decision, Please boost/Like us
Key Levels • Opening Scenarios • Price-Action Triggers
Educational Note: This is a price-action framework based on the attached 15-minute chart. It is not a prediction or investment recommendation. Let price confirm the setup before taking a trade.
━━━━━━━━━━━━━━━━━━━━
📌 NIFTY STRUCTURE GOING INTO 14-SEP
NIFTY closed around 23,435 , sitting inside the important 23,387–23,444 opening-support zone.
The immediate battle is between:
🔴 23,504–23,538 — Last Intraday Resistance
🟢 23,387–23,444 — Opening Support / Important Daily Support
🟢 23,340 — First Support for Reversal Price Action
🟢 23,277 — Last Intraday Support
A sustained move above 23,538 can shift the structure toward bullish continuation, with 23,668 as the major upside reference.
━━━━━━━━━━━━━━━━━━━━
🚀 SCENARIO 1 — GAP-UP OPENING BY 100+ POINTS
A gap-up of 100+ points would bring NIFTY directly toward or above the 23,504–23,538 resistance zone.
🟢 BULLISH GAP-UP
If NIFTY opens above resistance and holds above 23,538 after the initial volatility, watch:
23,538 → 23,560 → 23,600 → 23,668
The preferred setup is not to chase the opening spike. Look for a breakout + retest + continuation .
💡 Trading Tip: A large gap-up is not automatically bullish. If the opening strength is immediately sold, avoid chasing longs. Let the first reaction reveal whether resistance has actually converted into support.
🔴 GAP-UP REJECTION
If the opening spike fails inside 23,504–23,538 and price starts accepting below the zone, watch:
23,504 → 23,444 → 23,387
A decisive rejection can create a gap-fill/reversal opportunity.
💡 Trading Tip: On a gap-up, the first failed breakout can be more informative than the first breakout. Wait for 15-minute confirmation rather than reacting to the opening candle.
━━━━━━━━━━━━━━━━━━━━
🔻 SCENARIO 2 — GAP-DOWN OPENING BY 100+ POINTS
A 100+ point gap-down would bring NIFTY near or below 23,340 , immediately testing an important support area.
🟢 SUPPORT RECOVERY
If NIFTY opens below 23,340 but quickly reclaims:
23,340 → 23,387 → 23,444
and successfully holds these levels on a retest, recovery toward 23,504 becomes possible.
💡 Trading Tip: Do not buy simply because the market has gapped down. The reclaim of support is the signal — not the gap itself.
🔴 BREAKDOWN CASE
If NIFTY remains below 23,340 and selling pressure continues, watch:
23,340 → 23,277
A sustained break of 23,277 would indicate that the last intraday support has failed and sellers are gaining control.
💡 Trading Tip: Below 23,277, avoid assuming an immediate reversal. A failed support can become resistance, so wait for either a reclaim or a clean continuation setup.
━━━━━━━━━━━━━━━━━━━━
⚖️ SCENARIO 3 — FLAT / NORMAL OPENING
If NIFTY opens around 23,387–23,444 , expect an initial battle between buyers and sellers.
🟢 LONG SETUP
A sustained move above:
23,444 → 23,504 → 23,538
would strengthen the bullish structure.
Above 23,538 , watch:
23,560 → 23,600 → 23,668
💡 Trading Tip: The best breakout is usually the one that survives its retest. If 23,538 breaks and subsequently acts as support, the setup becomes stronger.
🔴 SHORT SETUP
Failure around 23,504–23,538 , followed by a breakdown of:
23,387 → 23,340
can shift momentum toward the downside.
The major lower reference remains 23,277 .
💡 Trading Tip: Do not short directly into support. A breakdown followed by a failed reclaim generally provides a cleaner risk-defined setup.
━━━━━━━━━━━━━━━━━━━━
🗺️ NIFTY KEY LEVEL MAP
23,668 ───────── 🎯 Major Upside Reference
↑
23,600 ───────── Bullish Momentum
23,560 ───────── Intermediate Target
↑
23,538–23,504 ═══ 🔴 KEY RESISTANCE
│
23,444 ───────── Opening Support
23,387 ───────── Opening Support
│
23,340 ───────── First Support
│
23,277 ═════════ 🔴 LAST INTRADAY SUPPORT
━━━━━━━━━━━━━━━━━━━━
📊 SIMPLE DECISION FRAMEWORK
Above 23,538 → Bulls gain the advantage
23,387–23,538 → Expect two-way action; confirmation required
Below 23,340 → Bears gain momentum
Below 23,277 → Recovery structure comes under serious pressure
━━━━━━━━━━━━━━━━━━━━
💡 TRADING TIPS FOR THE DAY
Do not trade the gap; trade the reaction to the gap .
Give the market time to establish the opening range before taking aggressive positions.
Prefer 15-minute candle confirmation around major levels.
A breakout without follow-through can become a trap.
A level becomes more reliable when price breaks, retests and respects it.
Avoid taking multiple trades in the middle of the range without a clear edge.
━━━━━━━━━━━━━━━━━━━━
🛡️ RISK MANAGEMENT
Define invalidation before entry. If price action invalidates the setup, exit. Do not continuously move the stop.
Risk small. Keep risk per trade within a predefined portion of trading capital.
Reduce aggression on gap openings. The first 15–30 minutes can produce sharp whipsaws.
Never average a losing trade blindly. If the original thesis fails, respect the information.
Protect profits progressively. Consider reducing exposure or protecting the position after a decisive move in your favour.
━━━━━━━━━━━━━━━━━━━━
🔑 FINAL VIEW
23,504–23,538 is the key upside decision zone.
A sustained acceptance above this zone can open the path toward 23,600 and 23,668 .
On the downside, 23,387–23,340 is the first defensive area, while 23,277 is the critical line in the sand for the current recovery structure.
The market does not have to follow the plan. The plan is to follow the market when confirmation appears.
Trade the confirmation, not the prediction. Let NIFTY tell you whether the level is holding or failing.
Educational content only. Markets involve risk. Always size positions according to your own risk tolerance and trading plan.
Long 
 Long
Long

HDFC Bank - Weekly Analysis – Potential Bullish RSI Divergence.NSE:HDFCBANK
HDFC Bank Limited is forming a potential reversal structure on the weekly chart following a prolonged correction from its major peak near ₹1,020.00+ . Price established a major base low near ₹681.90 (with key extended support around ₹652.75 ) and is currently trading at ₹708.25 (-0.54%). A potential bullish RSI divergence is emerging as price forms lower lows/equal lows while the RSI line demonstrates higher lows, pointing toward a base-building process or potential 'W' pattern formation.
🔹 PATTERN: BULLISH RSI DIVERGENCE & KEY RESISTANCE ZONES
• Bullish RSI Divergence (Potential): Price is testing the lower support band near ₹681.90 – ₹708.25 , while the weekly RSI indicator shows a rising trajectory above oversold levels.
• W-Pattern / Base Formation Setup: Consolidation around ₹708.25 – ₹720.00 supports a double-bottom base, with a confirmed entry trigger above ₹720.00 .
• Overhead Trendline Channel: Ascending multi-line resistance band situated between ₹750.00 and ₹760.00 .
• GAP Resistance / SHORT Zone: Major unfilled horizontal gap supply band near ₹790.00 – ₹810.00 aligned with the Round Level 800.00 .
• Previous Breakdown Zone: Major overhead horizontal supply band located between ₹920.00 and ₹950.00 ("Previous Breakdown level can be Target and Resistance Level").
🟢 UPSIDE SCENARIO – BULLISH REVERSAL
• Breakout / Confirmation Level: ₹720.00 (Entry above 720)
• Confirmation Required: Weekly candle close above ₹720.00
• Entry Zone: Above ₹720.00
• Target 1: ₹800.00 (+11.11% move from entry / GAP Resistance & Round Level 800)
• Target 2: ₹850.00 (+18.05% move from entry)
• Target 3 / Round Level Target: ₹900.00 (+25.00% move from entry / Round Level 900)
• Major Resistance Zone: ₹920.00 – ₹950.00 (Previous Breakdown Level)
🔴 DOWNSIDE SCENARIO – BEARISH BREAKDOWN
• Weakening Level: Loss of immediate support at ₹690.00
• Breakdown Level: Below major low at ₹681.90
• Important Support Levels: ₹708.25 , ₹681.90 (Major Base Low), ₹652.75 , and ₹640.00
• Invalidation: A weekly candle close below ₹652.75 invalidates the bullish RSI divergence and W-pattern thesis.
🔹 MY BREAKOUT & EXIT RULE
If price crosses above a key resistance level (such as ₹800.00, ₹850.00, or ₹900.00) and makes a High above that level, but closes below that same level, I consider it a failed breakout/rejection and the BUYER NEEDS TO EXIT THE TRADE.
High above level + Close below level = Failed breakout → EXIT BUY TRADE.
🎯 MY TRADE ROADMAP
Bullish Reversal Path:
₹720.00 Breakout / Base Confirmation Entry
↓
₹750.00 – ₹760.00 Trendline Resistance
↓
₹800.00 – Target 1 (11.11% / GAP Resistance & Round Level)
↓
₹850.00 – Target 2 (18.05%)
↓
₹900.00 – Target 3 (25.00% / Round Level 900)
↓
₹920.00 – ₹950.00 Major Overhead Breakdown Supply Zone
Bearish Breakdown Path:
Rejection near ₹720.00
↓
₹708.25 Current Level
↓
₹681.90 Major Base Low
↓
₹652.75 Key Invalidation Support
🔑 MY VIEW
The preferred technical setup favors a bullish reversal, provided price delivers a confirmed breakout above ₹720.00. The chart structure suggests a potential W-pattern bottom formation combined with bullish RSI divergence along the lower support region.
The bullish thesis strengthens once price trades and closes above ₹720.00, opening the path toward ₹800.00 (Target 1), ₹850.00 (Target 2), and ultimately the psychological round level at ₹900.00 (Target 3). The setup weakens if price fails to clear ₹720.00 and breaks below the primary base support at ₹681.90 / ₹652.75. The breakout is considered confirmed only with a proper weekly candle close above key trigger levels, strictly adhering to the candle-close exit rule if a rejection occurs.
---
This is technical analysis based on chart structure, price levels, and visual patterns shown above. It is not financial advice. Market conditions can change and actual price movement may differ from projected levels.  Long
Long


