Long
Long
 Long
Long
The Secret Sideways Markets : Patterns Hiding Inside PatternsThe Broader Range
Marked by the red horizontal line at the top and the green horizontal line at the bottom is the overall sideways range this stock traded within for an extended period. On the surface, this looks like a simple range, price contained between a ceiling and a floor with nothing more to it.
The Descending Triangle Hidden Within
The pink diagonal line, combined with the same red horizontal line at the top and the green horizontal line at the bottom, forms a descending triangle in its own right. A descending triangle is defined by a flat base and a series of lower highs pressing down toward it, and here that entire structure exists nested inside the larger sideways range
The Wedge Pattern Hidden Within
Later in the same broader range, a different structure quietly forms. The 50 EMA acts as a rising support base, and the yellow lines above it, combined once again with the same red horizontal line at the top, create a wedge pattern.
The Bigger Observation
One broad sideways range. Two completely different patterns forming within it at different points in time, a descending triangle first, and a wedge later, both sharing the same upper resistance line as an anchor. This is the quiet secret most people miss when they label a market simply as sideways. Inside that range, structure is still forming, patterns are still being built, and the market never truly sits idle
Disclaimer: This post is purely educational and observational in nature based on historical price action on a monthly timeframe. It does not constitute financial advice, a forecast, or a recommendation to buy, sell, or hold any security.
 Long
Long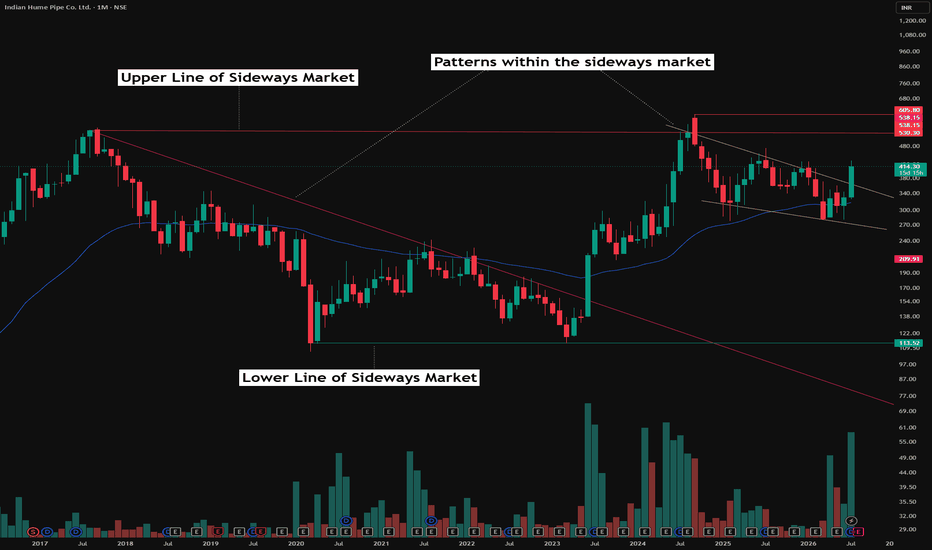
DIXON-Elliott Wave + Fib Confluence | Sell on Rise SetupDixon Technologies (India) Ltd; CMP: 10676.00; Tmeframe: Daily (with Weekly context)
🔍 Structure Insight
Weekly chart suggests Wave (V) TOP already in place
Price now in higher timeframe corrective phase (A-B-C)
Daily chart shows complete 5-wave impulsive decline
👉 Current bounce likely a corrective pullback, not trend reversal
📊 Key Levels to Watch
🔹 Support Zone: 9,600 – 10,000
🔹 Resistance Zones (Fib):
11,100 (0.236)
12,200 (0.382)
14,000 (0.5 – strong supply)
📈 Indicator View
RSI: Recovering from oversold → supports bounce
MACD: Early bullish crossover → short-term momentum
Volume: No strong accumulation yet
🎯 Trading Plan
👉 Bias: SELL ON RISE
🔺 Pullback expected towards: 11,100 – 12,300
🔻 Downside continuation likely after rejection
⚠️ Invalidation
Sustained breakout above 12,500 – 13,000
→ Can shift structure to bullish reversal
🧠 Conclusion
📉 Trend: Bearish (Corrective Phase Ongoing)
🔁 Move: Relief Rally in Progress
🎯 Strategy: Wait for rise, then short
📌 Thanks a ton for checking out my idea! Hope it sparked some value for you.
🙏 Follow for more insights
👍 Boost if you found it helpful
✍️ Drop a comment with your thoughts below!  Short
Short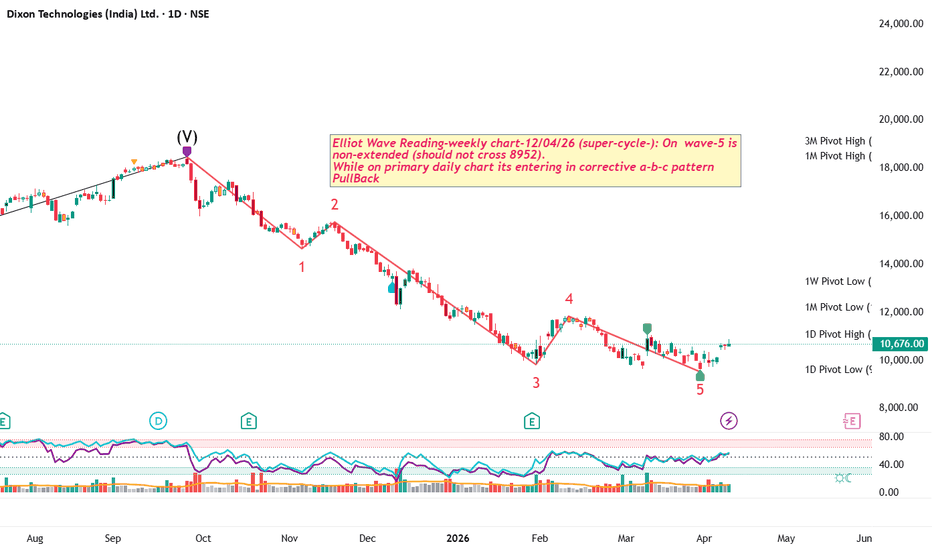
Trading Roadmap | ClassTradical TA · Lesson 11 — Core IndicatorsLesson 11 - Core Indicators (RSI, MACD, Stochastic, Bollinger Bands)
Difficulty: Intermediate
The indicators on your chart are built from the same price data you already see. The four covered here are among the most widely followed in technical analysis — knowing how to read them can add useful context to your setups.
🔵 WHAT INDICATORS ACTUALLY DO
An indicator does not see the future — it reorganizes past price (and sometimes volume) into a different visual form. That can make certain conditions easier to spot: fading momentum, stretched moves, or quiet periods before expansion.
Two useful categories to keep in mind:
- Oscillators (RSI, Stochastic) — move between fixed bounds; often more useful in ranging markets
- Trend/momentum tools (MACD, Bollinger Bands) — follow price openly; often more useful for reading trend strength and volatility
No indicator needs to be traded on its own. Most experienced traders use them as context on top of the structure you learned in earlier lessons.
🔵 RSI — RELATIVE STRENGTH INDEX
RSI measures the speed of recent price changes on a 0–100 scale.
- Above 70 → often described as overbought (momentum stretched to the upside)
- Below 30 → often described as oversold (momentum stretched to the downside)
Important nuance: in a strong trend, RSI can stay overbought or oversold for a long time. A high reading alone is not a sell signal.
One of the more widely watched RSI signals is divergence — price makes a new high while RSI makes a lower high (or the reverse at lows). This can suggest momentum is fading, especially when confirmed by a reversal pattern from Lesson 7.
🔵 MACD — MOVING AVERAGE CONVERGENCE DIVERGENCE
MACD builds directly on the moving averages from Lesson 10. It shows the relationship between a faster and a slower average of price, plus a signal line and a histogram.
Common ways traders read it:
- MACD line crossing the signal line — can indicate a shift in short-term momentum
- Histogram shrinking — the current push may be losing strength
- MACD crossing the zero line — often read as a broader momentum shift
Because MACD is built from moving averages, it lags by design. It tends to work better for confirming momentum than for picking exact tops and bottoms.
🔵 STOCHASTIC OSCILLATOR
The Stochastic compares the latest close to the recent high–low range: readings near 100 mean price is closing near the top of its recent range, near 0 means the bottom.
- Above 80 / below 20 → commonly used overbought/oversold zones
- %K crossing %D inside those zones → a frequently watched trigger
Stochastic tends to shine in sideways markets, where price rotates between support and resistance (Lesson 3). In strong trends it can stay pinned at extremes, so many traders only take its signals in the direction of the larger trend.
🔵 BOLLINGER BANDS
Bollinger Bands wrap a moving average with an upper and lower band that expand and contract with volatility.
- Wide bands → volatile conditions
- Narrow bands (the "squeeze") → quiet conditions that often precede expansion — direction unknown until price shows its hand
- Band walk → in strong trends, price can ride along one band for extended periods; touching a band is not by itself a reversal signal
A squeeze followed by a decisive close outside the bands, supported by volume (Lesson 9), is one of the more commonly watched volatility setups.
In the chart above: notice how the bands tightened in late December while price moved sideways — quiet conditions. The expansion arrived in late January with a strong break to the downside. The squeeze suggested a bigger move may be building, but the direction only became clear once the break happened.
🔵 COMBINING THEM WITHOUT CLUTTER
More indicators does not mean more clarity. A practical approach:
- Pick at most one oscillator and one trend/volatility tool
- Let structure lead: levels, trend, and volume first — indicators as confirmation
- Avoid stacking indicators that measure the same thing (RSI + Stochastic together mostly repeat each other)
🔵 COMMON MISTAKES
- Selling just because RSI is above 70 in a strong uptrend
- Taking every MACD crossover in a ranging market, where whipsaws are frequent
- Treating a Bollinger Band touch as an automatic reversal signal
- Loading five indicators and losing sight of price itself
🐳 PRO TIPS
- Divergence signals often carry more weight on higher timeframes — a 4H or daily divergence tends to matter more than a 5-minute one.
- When an oscillator signal appears at a level you already marked (Lesson 3) inside a clear trend (Lesson 2), the context is doing most of the work — the indicator is just the trigger.
- Try removing all indicators for a week and trading structure only, then add one back. Many traders find this reveals which tool actually helps them.
- Default settings (RSI 14, MACD 12/26/9, Stochastic 14/3/3, BB 20/2) are a starting point — consistency matters more than optimization.
If this lesson helped you, drop a comment with the indicator you rely on most — and let us know which topic you want covered next. 🐳
Full Trading Roadmap | Classical TA Course
Trading Roadmap | Classical TA · Lesson 01 — Mastering the Chart
Trading Roadmap | Classical TA · Lesson 02 — Mastering Trends
Trading Roadmap | Classical TA · Lesson 03 — Support & Resistance
Trading Roadmap | Classical TA · Lesson 04 — Price Channels
Trading Roadmap | Classical TA · Lesson 05 — Single Candle Patterns
Trading Roadmap | Classical TA · Lesson 06 — Multi-Candle Patterns
Trading Roadmap | Classical TA · Lesson 07 — Reversal Chart Patterns
Trading Roadmap | Classical TA · Lesson 08 — Continuation Chart Patterns
Trading Roadmap | Classical TA · Lesson 09 — Volume Analysis
Trading Roadmap | Classical TA · Lesson 10 — Moving Averages
Best Regards, BigBeluga 🐳  Education
 Education

 Long
Long
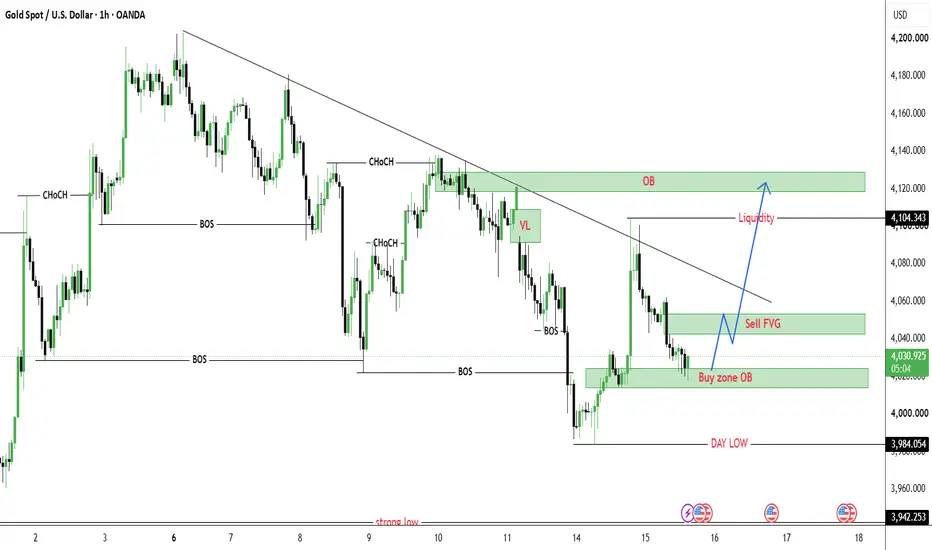
XAUUSD — Buy Zone Holding, Bullish Recovery SetupXAUUSD — Buy Zone Holding, Bullish Recovery Setup
Gold is trading around $4,029 after pulling back into the short-term Buy zone OB. The market reacted from the lower structure near $3,984 and is now trying to build a recovery from the current demand area.
From an SMC perspective, gold has already swept the day low liquidity and started to recover above the buy zone. The recent pullback into $4,017–$4,030 looks more like a liquidity retest than a full bearish continuation. As long as price can hold above this OB area, buyers still have a chance to push gold back toward the Sell FVG zone first, then the higher liquidity around $4,104.
The main plan is to avoid selling low after price has already reached the demand area. If gold holds the Buy zone OB and forms bullish confirmation, the next move can target $4,045–$4,052 first. A clean break above that area would open the path toward the liquidity zone around $4,104 and the upper OB area near $4,120–$4,130.
Buy setup 1
Condition:
Gold holds the Buy zone OB around $4,017–$4,030 and forms bullish rejection with lower timeframe MSS / CHOCH.
Entry: $4,017–$4,030
SL: below $3,984
TP1: $4,045–$4,052
TP2: $4,075
TP3: $4,104
TP4: $4,120–$4,130
Buy setup 2
Condition:
If gold breaks above the Sell FVG area and retests it as support, bullish continuation becomes stronger.
Entry: above $4,052 after breakout retest
SL: below $4,017
TP1: $4,075
TP2: $4,104
TP3: $4,120–$4,130
Buy setup 3
Condition:
If gold sweeps below the current buy zone but quickly reclaims $4,017–$4,030, this can create a stronger liquidity-trap buy setup.
Entry: after reclaim above $4,017–$4,030
SL: below the sweep low
TP1: $4,045–$4,052
TP2: $4,075
TP3: $4,104
Sell scalping setup
Condition:
Selling is not the main priority. A sell scalp is only valid if gold reaches the Sell FVG zone around $4,045–$4,052 and shows clear bearish rejection.
Entry: $4,045–$4,052 after rejection
SL: above $4,075
TP1: $4,030
TP2: $4,017
TP3: $3,984
Key levels
Current price area: $4,029
Buy zone OB: $4,017–$4,030
Day low liquidity: $3,984
Strong low liquidity: $3,942
Sell FVG reaction zone: $4,045–$4,052
Short-term liquidity: $4,104
Upper OB target zone: $4,120–$4,130
Bullish continuation confirmation: clean break above $4,052
Stronger bullish confirmation: clean break above $4,104
Bullish invalidation: clean 2H close below $3,984
My current view is that gold is trying to build a bullish recovery from the Buy zone OB. The Prime Gold plan is to avoid selling into demand and wait for confirmation around $4,017–$4,030. If buyers defend this area, gold may recover toward $4,045, $4,075, $4,104 and potentially the upper OB zone around $4,120–$4,130.
No confirmation, no trade.
 Long
Long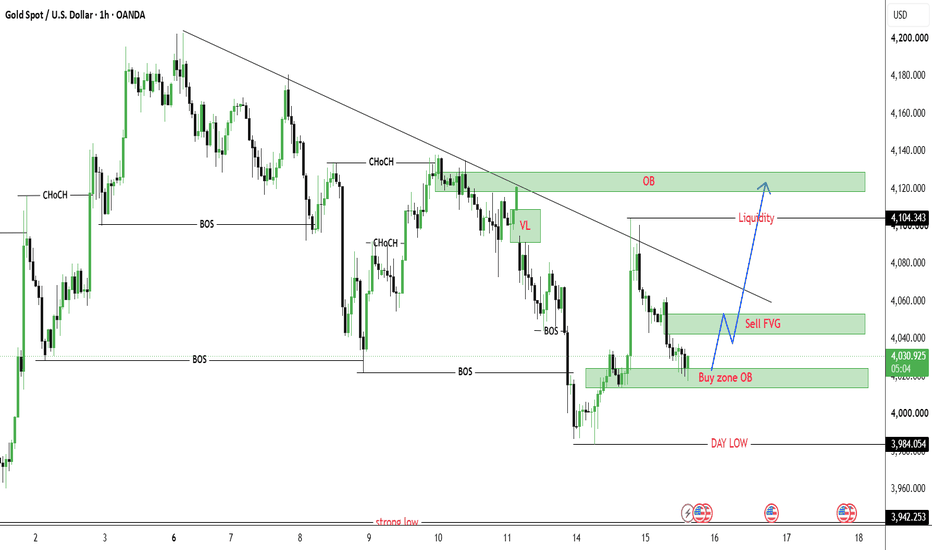
XAUUSD — 4,021 Is Feeding the Bounce XAUUSD — 4,021 Is Feeding the Bounce
Gold is trying to breathe again from the lower side of the range, but this bounce still feels like a market that needs to prove itself before traders fully trust it.
Price swept down into the lower FVG around 4,000 - 4,021.815, then started pushing back toward 4,054.400. That reaction is important because it tells us sellers may have already taken the easy liquidity below the recent low. When price grabs sell-side liquidity and then climbs back above the broken area, it can turn the low into a short-term trap zone.
For newer traders, this is where the story becomes simple. The market dropped hard first, pulled liquidity from weak buyers, then began recovering while the USD paused before CPI and Fed-related comments. That does not mean gold is fully bullish again, but it does mean the lower FVG has woken up as a reaction zone.
My main view is short-term bullish while gold holds above 4,021.815. If buyers can keep price above this level and reclaim 4,054.400, the next area I expect price to hunt is the sell premium zone around 4,085 - 4,100.355. That zone matters because it is where late buyers may start chasing, and where sellers may test the strength of this recovery.
If gold breaks through that premium area cleanly, the upper FVG around 4,125 - 4,140 becomes the next magnet. But I still want to keep the bigger picture honest: sticky inflation, geopolitical tension, and Fed expectations may limit the upside, so this looks more like a controlled recovery than a clean bullish trend reversal.
This bullish bounce becomes weak if gold loses 4,021.815 and fails to recover. If that happens, the lower FVG reaction failed, and price may look for liquidity back near 3,983.545 or even 3,960.275.
Key price zones to watch
Current reaction area: 4,054.400
Main demand / lower FVG zone: 4,000 - 4,021.815
Bullish confirmation zone: clean reclaim above 4,054.400
Main upside reaction zone: 4,085 - 4,100.355
Upper FVG target: 4,125 - 4,140
Lower support if buyers fail: 3,983.545
Major lower liquidity: 3,960.275
Invalidation: clean close below 4,021.815
Do you see this as a real bounce from the lower FVG, or just a liquidity pullback before sellers return near the premium zone?
Long 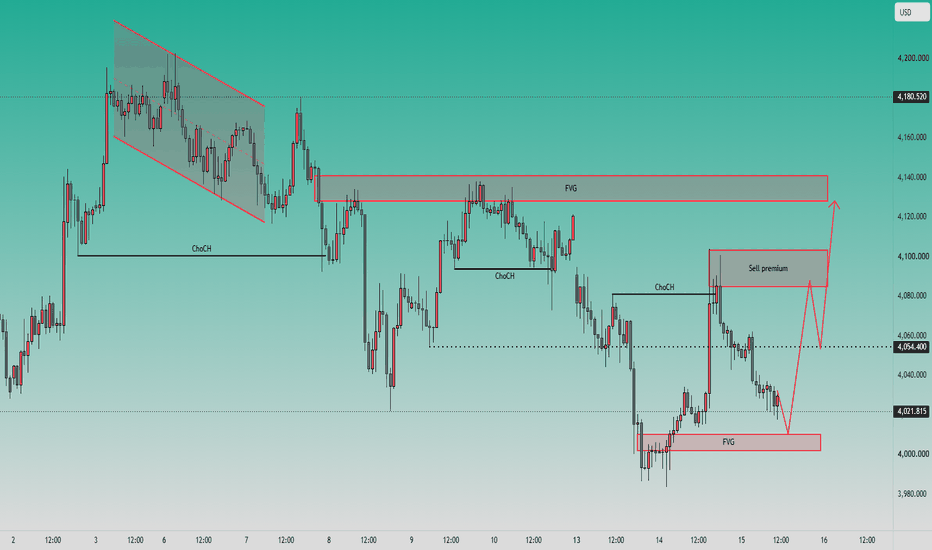
XAUUSD: Bearish Wave 5 May Persist TodayGold is showing weakness again after failing to hold the recovery structure above the short-term resistance area. From Kelly’s view, the current chart suggests that price may be developing a bearish wave 5 move, with sellers still active below the 4,035–4,040 sell zone.
The key idea is simple: gold is trying to rebound, but the structure still favors downside continuation while price remains below resistance.
⟡ Market structure
The chart shows gold completed a short recovery after reacting from the lower area, but buyers failed to sustain momentum above the 4,062 resistance level. Price then started forming lower highs again and is now trading near 4,026.
The support zone around 4,015–4,025 is currently being tested. If this area breaks with clear bearish pressure, gold may continue lower towards the Fibonacci 1.618 target zone around 3,960–3,970.
The sell zone around 4,035–4,040 is important. As long as price remains below this area, the bearish intraday structure remains active.
➤ Key levels
◌ 4,035–4,040: sell zone wave 4 and short-term resistance
◌ 4,026: current reaction area
◌ 4,015–4,025: support area under pressure
◌ 4,062: key resistance and bullish invalidation zone
◌ 3,960–3,970: Fibonacci 1.618 target and wave 5 downside area
◌ Above 4,062: area where the bearish wave setup weakens
⌁ Elliott Wave view
From an Elliott Wave perspective, gold appears to be forming a bearish 5-wave structure after the recovery failed near resistance.
Wave 1 created the first downside reaction from the recent high.
Wave 2 corrected higher but failed below resistance.
Wave 3 pushed price back into the support zone.
Wave 4 may now be forming around the 4,035–4,040 sell area.
If this zone holds, wave 5 may continue lower towards the 3,960–3,970 target.
This is why Kelly would not treat the current support reaction as a reversal yet. Price still needs to reclaim resistance before the bullish view becomes stronger.
▸ Trading scenario
Preferred scenario: wait for price to reject from the 4,035–4,040 sell zone before expecting wave 5 continuation.
Sell zone: 4,035–4,040 if bearish confirmation appears
Stop loss: above 4,062 or above the confirmed rejection high
Take profit 1: 4,015
Take profit 2: 3,990
Take profit 3: 3,960–3,970
Alternative scenario: if gold breaks above 4,062 and holds with strong acceptance, the bearish wave 5 setup weakens. In that case, the market may shift back into a corrective recovery structure.
⌁ Kelly’s view
For Kelly, this is a bearish intraday setup. Gold is still trading below the sell zone, and the Elliott structure suggests one more downside leg may develop if sellers defend resistance.
The cleaner plan is to avoid chasing price at support and wait for a retest reaction around 4,035–4,040.
Gold is still under short-term pressure.
If the sell zone holds, wave 5 may continue towards the Fibonacci target below.
Share your view below. Long 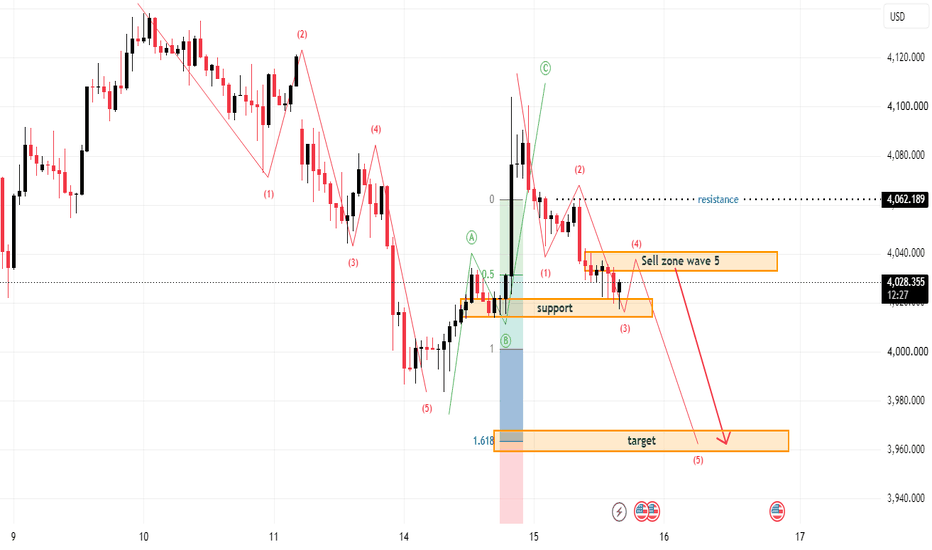
Flute RSI: A Potential Wave 2 Completion Signal Before Wave 3Introduction
One of the challenges of Elliott Wave analysis is identifying when a corrective Wave 2 has truly ended and when a new impulsive Wave 3 is about to begin.
Over the past several months, I have been studying a recurring relationship between price structure and RSI behavior that appears repeatedly before many significant bullish advances.
I call this pattern Flute RSI.
This article presents the concept, its market psychology, and several examples. The research is ongoing, and I welcome feedback from traders, technicians, and Elliott Wave practitioners.
The Core Observation
In many corrective structures:
Price continues making lower highs.
RSI also makes lower highs.
RSI breaks its downward trendline before price does.
RSI then pulls back and successfully retests the broken trendline.
Price subsequently completes its correction and begins a strong advance.
The key insight is that momentum appears to improve before price confirms the change.
Why " Flute RSI "?
The name comes from the appearance of the chart.
Price and RSI often form parallel downward trendlines during the correction, resembling the body of a flute.
When RSI breaks the trendline and later returns to test it, the move resembles a musician covering a flute hole before producing the next note.
After this "tap" occurs, the market frequently enters a powerful advance phase.
Pattern Definition
Stage 1 – The Correction
Price forms a series of lower highs.
RSI forms a matching series of lower highs.
Trendlines can be drawn on both price and RSI.
At this stage price and momentum are moving in harmony.
Stage 2 – The RSI Breakout
The first structural change appears in RSI.
Before price can break resistance, RSI breaks above its own descending trendline.
This suggests momentum is improving beneath the surface even though price has not yet confirmed.
Stage 3 – The Pullback
Price remains weak and may even fall further.
Many traders assume the bearish trend remains intact.
However, RSI holds above its broken trendline and begins forming support.
This is the critical phase of the setup.
Stage 4 – The Retest
RSI returns to the breakout area and successfully tests it as support.
What was previously resistance now becomes support.
This transition is what I consider the defining characteristic of the pattern.
Without a successful retest, I do not consider the setup complete.
Stage 5 – The Expansion
After RSI support is confirmed:
Price often forms its final corrective low.
Selling pressure diminishes.
A strong upward move begins.
Price eventually breaks its primary resistance trendline.
Many of the examples studied subsequently produced rapid advances.
Elliott Wave Connection
My working hypothesis is that Flute RSI frequently appears near the completion of a corrective Wave 2.
By the time price is still finishing its correction, RSI has already communicated a change in momentum structure.
When viewed through an Elliott Wave lens:
Wave 2 is completing.
Momentum begins improving.
Wave 3 emerges shortly afterward.
This remains a hypothesis and is one of the areas of ongoing research.
Market Psychology
The psychology behind the pattern may be straightforward.
During the correction:
Most traders focus on price.
Momentum starts improving first.
Early accumulation occurs.
RSI reflects the change before price does.
As price remains weak, many traders continue expecting downside.
Once the correction is complete, the market advances rapidly, leaving late sellers trapped.
Examples Studied
Some of the charts currently documented include:
Deepak Nitrate
TCI Express
Medicamen Biotech
Max Healthcare
Nifty Realty Index
docs.google.com
In each case, RSI demonstrated an earlier structural improvement than price.
Further testing across broader datasets is underway.
Limitations
This research is still in development.
The following work remains in progress:
Statistical win-rate analysis
Failure-case documentation
Risk/reward evaluation
Objective screening criteria
Cross-market validation
Multi-timeframe testing
At this stage, Flute RSI should be considered a research observation rather than a validated trading system.
Questions for the Community
I would appreciate feedback from traders and analysts:
Have you observed a similar RSI behavior before major advances?
Have you found examples where the pattern failed?
Does the setup appear on markets outside equities?
Have you observed a similar relationship with other momentum indicators?
Constructive criticism and counterexamples are especially welcome.
Conclusion
The Flute RSI concept is built on one simple idea:
Momentum may reveal a change in market structure before price confirms it.
Whether this observation ultimately proves statistically robust remains to be determined. However, the pattern has appeared often enough in my research to warrant further investigation.
I look forward to refining the concept with feedback from the TradingView community.
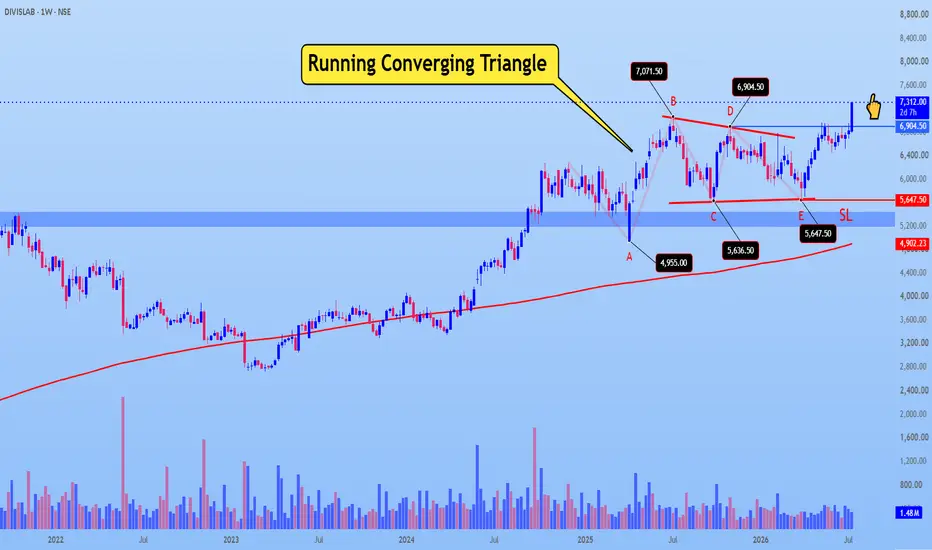
Author's Note: This is ongoing independent research and not investment advice. Future work includes large-scale testing, win-rate calculation, and identification of failure scenarios. DIVISLAB : Running Converging Triangle (ABCDE) Breakout !!!After a strong impulsive rally, DIVISLAB spent several months consolidating in a Running Converging Triangle (A-B-C-D-E).
🔍 Structure Breakdown:
A: Sharp corrective decline after the previous uptrend.
B: Strong recovery, creating the first lower high.
C: Pullback that respected the major demand zone.
D: Another rally, but failed to make a new high, confirming contracting resistance.
E: Final retest of support around ₹5,647, completing the triangle.
Throughout the correction, the stock consistently respected the long-term 200 SMA, indicating that the primary trend remained bullish.
✅ Bullish Confirmation
The price has now broken above the triangle's upper trendline, signaling that the consolidation phase is likely over.
As long as the price sustains above the breakout level, the probability favours the beginning of the next impulsive advance.
📌 Key Levels
Breakout: Above the triangle resistance.
Invalidation / Stop Loss: ₹5,647 (Below Wave E).
Trend Support: 200 SMA remains strongly bullish.
🎯 Elliott Wave Perspective
Running Triangles typically appear as Wave 4 or Wave B corrections. Their purpose is to consume time rather than retrace much of the previous trend. Once complete, they are often followed by a strong directional move in the trend's original direction.
If this interpretation is correct, DIVISLAB could be entering its next impulsive bullish wave.
⚠️ This is an educational Elliott Wave analysis, not financial advice. Always manage your risk and wait for confirmation before taking any trade.
#DIVISLAB #ElliottWave #RunningTriangle #TriangleBreakout #SwingTrading #PositionalTrading #StockMarket #NSE #TechnicalAnalysis #TradingView #PriceAction #WaveAnalysis #Investing #ChartAnalysis #TradingView #Forex #PriceAction #NikhilKanal #iElliottician #IndianEW #EWinHindi #XAUUSD #Gold #ElliottWave NIFTY : Trading levels and Plan for 15-Jul-2026Hello Traders! 👋 Below is a complete, educational trading roadmap for NIFTY 50, covering Gap Up, Flat, and Gap Down (100+ points) opening scenarios. The plan is built around key support-resistance levels visible on the chart, along with practical risk management guidance for options traders. Please go through the entire plan before acting on any level. 🎯
🔑 Important Levels on Chart
🔸 Last Intraday Resistance → 24,375.00
🔸 Opening Resistance (relevant for Gap Up) → 24,140.00
🔸 Opening Support/Resistance (No-Trade Orange Zone) → 24,035.15 / 24,032.00
🔸 Last Intraday Support → 23,901.00
🔸 Extended Downside Level → 23,710.00
📌 Chart Legend: 🟠 Orange Line = Sideways/No-Trade Zone | 🟢 Green = Bullish/Long Bias | 🔴 Red = Bearish/Short Bias | Dashed Lines = Unconfirmed move ("trend may or may not sustain" — trade with caution and trail SL)
🟢 SCENARIO 1: GAP UP OPENING (100+ points → Open above ~24,135-24,150)
📚 Understanding the setup: A strong gap-up opening reflects positive overnight sentiment, but such openings frequently invite early profit booking. Confirmation before entry is essential — don't chase the first candle.
🟢 Action Plan:
🔹 A sustained move and 15-min candle closing above 24,140 confirms bullish strength — this is your cue to look at Call Option (CE) buying on shallow dips near 24,140-24,150.
🔹 First target for the move → 24,209 (Last Intraday Resistance).
🔹 On a strong breakout and closing above 24,209, the door opens for an extended rally toward 24,375 — remember this is a dashed/unconfirmed zone, so keep trailing your stop-loss rather than holding blindly.
🔹 If price gaps up but immediately reverses near 24,140-24,150 with weak red candles (as shown in the orange zig-zag pattern), treat it as exhaustion — avoid fresh buying. Wait for price to retest 24,035 (Opening Support/Resistance) for the next directional clue.
🔹 Stop-Loss for long positions → Below 24,032 on 15-min closing basis.
⚠️ Risk Tip: Right after a gap-up open, option premiums are often overpriced due to IV spike. Let the first 15-min candle close before entering to avoid buying into inflated premiums.
🟠 SCENARIO 2: FLAT OPENING (Open within the 24,032–24,140 range)
📚 Understanding the setup: A flat open signals market indecision. This zone marked in orange is essentially a No-Trade Zone — both buyers and sellers are testing each other without a clear winner yet.
🟠 Action Plan:
🔹 If NIFTY opens flat around 24,035-24,040 and continues to oscillate between 24,032 (support) and 24,140 (resistance), refrain from directional option buying — sideways price action combined with time decay is a losing combination for buyers. 🚫
🔹 A confirmed breakout above 24,140 with strong volume → shift to the Gap Up bullish playbook (CE buying, targets 24,209 → 24,375).
🔹 A confirmed breakdown below 23,901 with strong volume → shift to the Gap Down bearish playbook (PE buying, target 23,710).
🔹 Experienced traders may explore premium-selling strategies (like Iron Condors or hedged Short Straddles) during this range-bound phase, since sideways movement favors time decay — but only with proper hedges in place.
⚠️ Risk Tip: Flat markets punish impatient option buyers the most. Wait for a clean breakout/breakdown candle close rather than guessing direction early.
🔴 SCENARIO 3: GAP DOWN OPENING (100+ points → Open below ~23,935)
📚 Understanding the setup: A sharp gap-down usually stems from negative global cues or heavy overnight selling pressure. However, gap-downs can either extend into panic selling or attract aggressive dip-buyers — so wait for confirmation.
🔴 Action Plan:
🔹 A sustained move and 15-min candle closing below 23,901 confirms bearish continuation — look at Put Option (PE) buying on pullback rallies toward 23,935-23,950.
🔹 First bearish target → 23,710 (extended downside zone). Since this is a dashed/unconfirmed level, keep trailing your SL as confirmation isn't guaranteed.
🔹 If price gaps down but quickly reverses (dashed green recovery pattern) and reclaims 23,901, followed by a move back above 24,032-24,035, avoid fresh short positions — this hints at a V-shaped recovery. Wait for confirmation above 24,035 before considering long positions.
🔹 Stop-Loss for short positions → Above 24,032 on 15-min closing basis.
⚠️ Risk Tip: Gap-down opens often produce a "dead cat bounce." Avoid shorting impulsively at the open — wait for a retest and rejection near resistance before initiating PE positions.
🛡️ Risk Management Tips for Options Trading
🔸 Always enter with a predefined Stop-Loss — never average into a losing options trade.
🔸 Limit risk per trade to 1-2% of total capital — options carry inherent leverage risk.
🔸 Avoid buying options in the first few minutes of market open — inflated IV can hurt entries.
🔸 Book partial profits at the first target and trail SL to breakeven to protect gains.
🔸 Avoid overnight option holding unless backed by strong technical/fundamental reasoning — theta decay is a buyer's enemy.
🔸 Prefer hedged spread strategies over naked buying/selling to control downside risk.
🔸 Combine technical levels with OI data, PCR, and India VIX for stronger confirmation before entry.
📝 Summary & Conclusion
Today's structure revolves around three critical zones — 24,140 (Opening Resistance), 24,032-24,035 (No-Trade Zone), and 23,901 (Last Intraday Support).
✅ Gap Up (100+ pts): Sustained move above 24,140 → CE buying, targets 24,209/24,375.
✅ Flat Opening: Stay out between 24,032-24,140; act only after breakout/breakdown confirmation.
✅ Gap Down (100+ pts): Sustained move below 23,901 → PE buying, target 23,710; watch for reversal signs too.
Successful trading is built on patience, discipline, and strict adherence to risk management — not on predictions. Trade your plan, not your emotions! 💪📈
⚠️ Disclaimer
I am not a SEBI registered analyst. This content is shared purely for educational purposes to help traders understand chart-based support-resistance concepts and risk management in options trading. This is not a recommendation to buy or sell any security. Please consult a qualified financial advisor and do your own research (DYOR) before making any investment or trading decisions. Trading in equities and derivatives carries significant financial risk. 🙏📉📈  Long
Long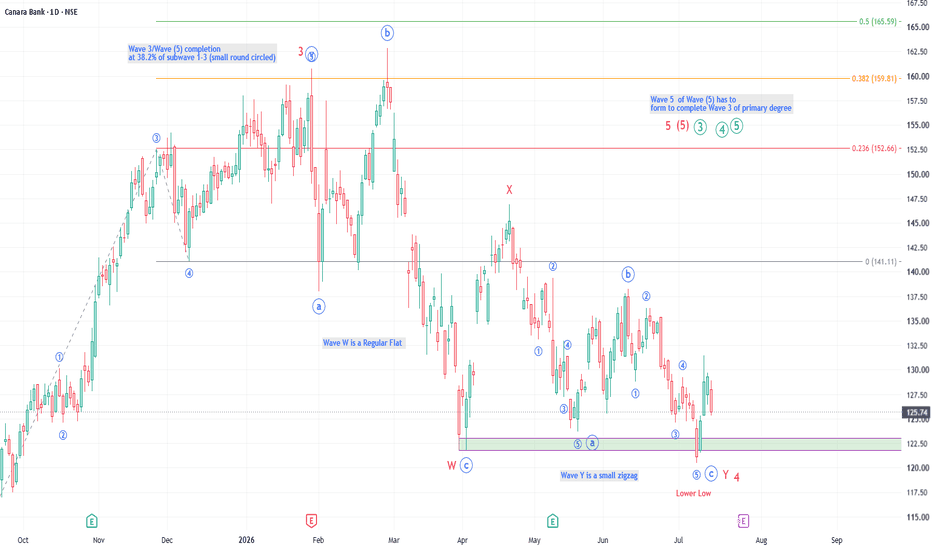
The Quiet After the PeakThis post is educational and observational in nature based on historical price action. It is not a forecast or a trading recommendation.
The Ascending Broadening Pattern
Marked in red is an ascending broadening pattern. This structure forms when price creates a series of higher highs and higher lows, but instead of contracting into a narrower range, the highs and lows keep widening further apart over time. Unlike triangles that compress, this pattern expands, reflecting increasing volatility even as the overall trend continues upward.
The White Flip Zone
Marked in white is a flip zone. This level originally acted as resistance, rejecting price on prior attempts. After the eventual breakout, price sustained above this zone and it began functioning as a consistent support area on subsequent visits. That shift, from a level that once held price down to one that now holds it up, is what defines a flip zone.
The Consolidation After the All Time High
Marked with dotted white lines is a consolidation pattern that formed after the stock made a new all time high. This kind of pause is common once price reaches uncharted territory with no historical resistance above it. With no prior price memory to react to, the market often takes time to consolidate, digest the move, and build a base before its next decision.
Disclaimer: This post is purely educational and observational in nature based on historical price action. It does not constitute financial advice, a forecast, or a recommendation to buy, sell, or hold any security.  Long
Long
Education

Core of Technical AnalysisCore of Technical Analysis
Technical Analysis is the study of past price movements, volume, and market trends to predict future price direction.
3 Main Principles:
Market Discounts Everything
All news, emotions, and fundamentals are already reflected in price.
Prices Move in Trends
Markets usually move in uptrend, downtrend, or sideways trends.
History Repeats Itself
Human psychology creates repeating chart patterns.
Key Tools:
Charts (Candlestick, Line, Bar)
Support & Resistance
Trendlines
Indicators (RSI, MACD, Moving Averages)
Volume Analysis
Patterns (Head & Shoulders, Double Top, Triangle) Education

Global Financial MarketsGlobal financial markets are systems where people, companies, and governments buy and sell financial assets across the world. They help move money from those who have extra funds to those who need funds.
Main Types of Global Financial Markets:
Stock Markets – Buying and selling shares of companies (e.g., NYSE, NSE).
Bond Markets – Governments and companies borrow money by issuing bonds.
Foreign Exchange (Forex) Markets – Trading currencies like USD, EUR, INR.
Commodity Markets – Trading gold, oil, wheat, etc.
Money Markets – Short-term borrowing and lending.
Derivatives Markets – Contracts based on assets like stocks or currencies.
Importance:
Provide funds for business growth
Support international trade
Create investment opportunities
Help manage financial risks
Affect global economies
Example:
If the US stock market falls sharply, markets in Asia and Europe may also be affected because markets are connected globally.  Education

 Education