Long
Long

HDFC Bank - Weekly Analysis – Potential Bullish RSI Divergence.NSE:HDFCBANK
HDFC Bank Limited is forming a potential reversal structure on the weekly chart following a prolonged correction from its major peak near ₹1,020.00+ . Price established a major base low near ₹681.90 (with key extended support around ₹652.75 ) and is currently trading at ₹708.25 (-0.54%). A potential bullish RSI divergence is emerging as price forms lower lows/equal lows while the RSI line demonstrates higher lows, pointing toward a base-building process or potential 'W' pattern formation.
🔹 PATTERN: BULLISH RSI DIVERGENCE & KEY RESISTANCE ZONES
• Bullish RSI Divergence (Potential): Price is testing the lower support band near ₹681.90 – ₹708.25 , while the weekly RSI indicator shows a rising trajectory above oversold levels.
• W-Pattern / Base Formation Setup: Consolidation around ₹708.25 – ₹720.00 supports a double-bottom base, with a confirmed entry trigger above ₹720.00 .
• Overhead Trendline Channel: Ascending multi-line resistance band situated between ₹750.00 and ₹760.00 .
• GAP Resistance / SHORT Zone: Major unfilled horizontal gap supply band near ₹790.00 – ₹810.00 aligned with the Round Level 800.00 .
• Previous Breakdown Zone: Major overhead horizontal supply band located between ₹920.00 and ₹950.00 ("Previous Breakdown level can be Target and Resistance Level").
🟢 UPSIDE SCENARIO – BULLISH REVERSAL
• Breakout / Confirmation Level: ₹720.00 (Entry above 720)
• Confirmation Required: Weekly candle close above ₹720.00
• Entry Zone: Above ₹720.00
• Target 1: ₹800.00 (+11.11% move from entry / GAP Resistance & Round Level 800)
• Target 2: ₹850.00 (+18.05% move from entry)
• Target 3 / Round Level Target: ₹900.00 (+25.00% move from entry / Round Level 900)
• Major Resistance Zone: ₹920.00 – ₹950.00 (Previous Breakdown Level)
🔴 DOWNSIDE SCENARIO – BEARISH BREAKDOWN
• Weakening Level: Loss of immediate support at ₹690.00
• Breakdown Level: Below major low at ₹681.90
• Important Support Levels: ₹708.25 , ₹681.90 (Major Base Low), ₹652.75 , and ₹640.00
• Invalidation: A weekly candle close below ₹652.75 invalidates the bullish RSI divergence and W-pattern thesis.
🔹 MY BREAKOUT & EXIT RULE
If price crosses above a key resistance level (such as ₹800.00, ₹850.00, or ₹900.00) and makes a High above that level, but closes below that same level, I consider it a failed breakout/rejection and the BUYER NEEDS TO EXIT THE TRADE.
High above level + Close below level = Failed breakout → EXIT BUY TRADE.
🎯 MY TRADE ROADMAP
Bullish Reversal Path:
₹720.00 Breakout / Base Confirmation Entry
↓
₹750.00 – ₹760.00 Trendline Resistance
↓
₹800.00 – Target 1 (11.11% / GAP Resistance & Round Level)
↓
₹850.00 – Target 2 (18.05%)
↓
₹900.00 – Target 3 (25.00% / Round Level 900)
↓
₹920.00 – ₹950.00 Major Overhead Breakdown Supply Zone
Bearish Breakdown Path:
Rejection near ₹720.00
↓
₹708.25 Current Level
↓
₹681.90 Major Base Low
↓
₹652.75 Key Invalidation Support
🔑 MY VIEW
The preferred technical setup favors a bullish reversal, provided price delivers a confirmed breakout above ₹720.00. The chart structure suggests a potential W-pattern bottom formation combined with bullish RSI divergence along the lower support region.
The bullish thesis strengthens once price trades and closes above ₹720.00, opening the path toward ₹800.00 (Target 1), ₹850.00 (Target 2), and ultimately the psychological round level at ₹900.00 (Target 3). The setup weakens if price fails to clear ₹720.00 and breaks below the primary base support at ₹681.90 / ₹652.75. The breakout is considered confirmed only with a proper weekly candle close above key trigger levels, strictly adhering to the candle-close exit rule if a rejection occurs.
---
This is technical analysis based on chart structure, price levels, and visual patterns shown above. It is not financial advice. Market conditions can change and actual price movement may differ from projected levels.  Long
Long
XAUUSD 4349 squeeze — 4600 still the draw XAUUSD 4349 squeeze — 4600 still the draw
This pullback is ugly, but not random.
Gold already did the big move. It swept lower liquidity, built from the +OB area, then ripped straight into the upper buy-side pool near 4,600. After that? Rejection. Normal. Price was stretched.
Now we’re sitting around 4,349 inside this falling channel.
Looks weak at first glance. But I don’t read it as full bearish control yet.
This looks more like a corrective channel after a strong bullish displacement. Sellers are pushing price down, but not breaking the whole higher-timeframe structure clean. They’re just dragging price back into discount.
Main bias is bullish recovery while gold holds above the lower channel and the 4,240 - 4,300 demand area.
The zone I care about is below current price. If gold sweeps into 4,300 - 4,240 and starts rejecting, that is where buyers can reload. Not in the middle. Not while price is chopping.
Confirmation is simple. I want to see gold break out of this small bearish channel and reclaim above 4,400. If that happens, 4,500 comes next. Then 4,600 becomes the real liquidity draw again.
Trading scenario:
Buy idea only if gold sweeps 4,300 - 4,240 and reclaims fast, or breaks above 4,400 with clean candles.
Entry zone: 4,300 - 4,400 after confirmation
Deeper buy zone: 4,240 - 4,300 if price sweeps lower and rejects
Stop loss: below 4,220
TP1: 4,400
TP2: 4,500
TP3: 4,600
No reclaim, no chase. Simple.
If gold breaks hard below 4,220, this bullish recovery idea gets cooked. Then the correction can turn into a deeper selloff.
For now, I’m reading this as bearish channel pullback, discount reload, 4,600 liquidity still waiting.
You think gold sweeps 4,300 first, or breaks the channel right away?
 Long
Long
XAUUSD — Medium-Term Bearish Wave Toward 3,836
Gold is showing a medium-term bearish Elliott Wave structure after failing to recover above the descending channel resistance. From Kelly’s view, the chart suggests that XAUUSD is still moving inside a broader downside trend, and the current rebound may only be a correction before the next bearish wave continues.
The key idea is simple: gold may retest support first, then create a short recovery, but as long as price stays below the descending trendline and resistance structure, the priority scenario remains bearish for next week.
⟡ Market structure
Gold is currently trading around 4,349, still below the main descending channel. The previous bullish trendline has already been weakened, and price is now moving under bearish pressure.
The first important level to watch is the 4,282–4,300 strong support area. If gold breaks below this zone, the next downside path may open toward 4,230, then the 4,090–4,110 Buy zone wave 4.
For the medium-term structure, if sellers continue to control the market, gold may extend lower toward the final Done wave 5 area near 3,836–3,850.
➤ Key levels
◌ Current price area: 4,349
◌ Short-term resistance: 4,360–4,390
◌ Strong support: 4,282–4,300
◌ Next downside level: 4,230
◌ Buy zone wave 4: 4,090–4,110
◌ Main bearish target: 3,836–3,850
◌ Bearish invalidation: above 4,430–4,450
⌁ Elliott Wave view
The chart is showing a possible bearish continuation structure.
Wave (1) started after price rejected from the upper zone.
Wave (2) created a corrective rebound but failed below the descending resistance.
Wave (3) may now continue lower toward 4,230 and 4,096.
Wave (4) could later create a short recovery from the lower buy zone.
Wave (5) may complete the larger bearish cycle near 3,836–3,850.
This is why Kelly does not treat the current bounce as a confirmed bullish reversal. The recovery is still under resistance, and the market needs a strong breakout above the trendline before the bearish wave count becomes weaker.
▸ Trading scenario
Preferred bearish scenario
Entry: Sell on rejection around 4,360–4,390, or after price breaks below 4,282 and retests weakly
Stop Loss: Above 4,450
Take Profit 1: 4,282–4,300
Take Profit 2: 4,230
Take Profit 3: 4,090–4,110
Take Profit 4: 3,836–3,850
Alternative scenario
If gold breaks above 4,430–4,450 and holds above the descending trendline, the bearish setup becomes weaker. In that case, price may attempt a stronger recovery before the next sell setup appears.
◌ Invalidation
The bearish view becomes weaker if gold reclaims 4,430–4,450 with strong bullish momentum. A clean hold above this zone would suggest that the current downside wave is losing strength.
⌁ Kelly’s view
Kelly’s main view for next week remains bearish while gold stays below the descending channel resistance. The structure still favors selling rebounds rather than chasing buys.
If sellers break 4,282–4,300, gold may continue toward 4,230, then 4,090–4,110. The larger Elliott Wave target remains near 3,836–3,850 if bearish momentum extends.
Do you think gold will break strong support next week, or create one more rebound before wave (5) continues lower? Short 
 Short
Short
 Long
Long
XAUUSD — Bullish Retest Toward 4,425XAUUSD — Bullish Retest Toward 4,425
Gold is showing a short-term bullish recovery after completing the previous downside wave near the lower support area. From Kelly’s view, the current chart suggests that XAUUSD may be forming a corrective bullish structure, with price now reacting from the 4,334–4,340 buy retest support zone.
The key idea is simple: if gold holds above this support, the next recovery leg may continue toward the 4,420–4,435 strong resistance area.
⟡ Market structure
Gold recently completed a bearish 5-wave sequence and is now trying to rebuild from the lower zone. Price is trading around 4,351, slightly above the buy retest support.
The current structure looks like a possible ABC recovery. Buyers are trying to defend the 4,334–4,340 area, while the next major upside target remains the strong resistance zone near 4,420–4,435.
However, gold is still trading below the descending trendline, so the bullish setup needs confirmation. A clean move above 4,380–4,400 would strengthen the recovery and open the way toward the upper resistance.
➤ Key levels
◌ Current price area: 4,351
◌ Buy retest support: 4,334–4,340
◌ Key support: 4,300–4,315
◌ First bullish confirmation: above 4,380
◌ Main resistance: 4,420–4,435
◌ Strong breakout confirmation: above 4,435
◌ Bullish invalidation: below 4,300
⌁ Elliott Wave view
The chart suggests that the previous bearish wave may have already completed near the 4,300 area.
After that, gold started to form a short-term bullish recovery:
Wave A may be the first rebound from the low.
Wave B may be the retest into 4,334–4,340.
If this support holds, wave C may push price toward 4,420–4,435.
This is why Kelly is watching the current retest zone carefully. The bullish idea is valid only if buyers continue to defend support and price starts to break above the short-term resistance levels.
▸ Trading scenario
Preferred bullish scenario
Entry: Buy around 4,334–4,340 if price gives bullish confirmation
Stop Loss: Below 4,300
Take Profit 1: 4,380
Take Profit 2: 4,400
Take Profit 3: 4,420–4,435
Alternative entry
If gold breaks above 4,380–4,400 and retests this area as support, buyers may look for continuation toward 4,420–4,435.
◌ Invalidation
The bullish view becomes weaker if gold breaks below 4,300 and fails to recover back above the buy retest support. In that case, the recovery structure may fail and sellers could regain control.
⌁ Kelly’s view
Kelly’s main view is cautiously bullish while gold holds above 4,334–4,340. The market is showing signs of recovery, but price still needs to confirm strength above 4,380–4,400.
If buyers defend the current support, gold may continue toward 4,420–4,435, where the next key decision zone is waiting.
Do you think gold will complete wave C toward resistance, or retest the lower support one more time first? Education 
TRADING SECRET - How To Watch VolumeMost traders watch price first. I prefer to watch what volume is doing while price becomes quiet. One of the most useful patterns in BTCUSDT, Crypto, Gold and other liquid markets is simple: price compresses, volume dries up, then volume suddenly expands when the breakout begins.
1. Quiet Price + Falling Volume = Something Is Changing
When price moves sideways inside a tight range and volume gradually decreases, participation is drying up. Buyers are no longer aggressively chasing price, but sellers are also failing to push it lower. The market is entering a temporary balance.
This does not tell us the breakout direction yet. What it tells us is that energy is being compressed.
2. The Breakout Is Where Volume Matters
The important moment comes when price finally leaves the range. A breakout accompanied by a clear increase in volume is usually more meaningful than one happening on weak participation.
A simple sequence to remember:
Consolidation → Volume Dry-Up → Breakout → Volume Expansion
For a bullish setup, I want price to break resistance while volume expands. That tells me new demand is actually entering the market instead of price simply drifting above the level.
3. Volume Can Help Avoid Fake Breakouts
Imagine BTCUSDT has been trapped below resistance for several hours. Price briefly pushes above the level, but volume remains weak and the next candles immediately fall back into the range.
That is very different from a breakout where volume suddenly increases and price closes strongly above resistance.
Breakout + Weak Volume = Be Careful
Breakout + Strong Volume = Better Confirmation
Volume should confirm what price is trying to do.
4. How I Would Trade It
I do not enter simply because volume becomes low. I first mark the consolidation range and wait.
If price breaks resistance with expanding volume, I can either enter after confirmation or wait for a retest of the breakout level. The Stop Loss should sit where the breakout idea becomes invalid, while the target can be the next major resistance or previous swing high.
The cleaner setup is:
Tight Range + Falling Volume → Strong Breakout + Rising Volume → Retest → Continuation
This keeps me from predicting the move before the market actually shows its hand.
5. One Important Detail
Volume is not identical across every market. On BTCUSDT, exchange volume can be very useful, but crypto liquidity is spread across different exchanges. In spot Forex, traders often work with tick volume rather than centralized exchange volume.
So I never use volume alone. I combine it with market structure, support/resistance and price reaction.
Final Thought
When price becomes quiet, watch participation. When price breaks out, watch whether volume confirms the move.
Many traders react to the breakout candle. Better traders were already watching what happened before the breakout.  Education
NIFTY 50 — Reversal Setup Building at Channel Support (15m)Chart Read (15-min timeframe)
Nifty has been sliding inside a well-defined descending channel for several sessions, printing a clean sequence of lower highs and lower lows down from the ~24,400 zone. That's the dominant trend context — so any reversal call here is a "counter-trend bounce until proven otherwise" setup, not a trend change yet.
What's changed in the last few candles:
Price tagged the lower rail of the channel (~23,387–23,400) and is showing a higher low + reaction candles rather than a clean continuation lower — the first sign of seller exhaustion at support.
RSI is turning up from the 40s/50s toward the low 60s, with the faster RSI line crossing back above the signal line — early bullish momentum shift, not yet an overbought/divergence confirmation.
Current price ~23,398–23,435, holding just above the day's low (23,387.20).
Options / Institutional Flow Note
Per current options chain activity, the built-up Put OI base is unwinding while fresh Call OI is being added — i.e., the positioning read has shifted from a put-heavy (bearish/hedging) skew toward call accumulation. That's typically read as institutional/smart-money positioning tilting bullish near this support zone, and it lines up with the price-action reversal signs above.
(Flag for readers: OI shifts can also reflect short-covering or hedge unwinding rather than fresh conviction — worth confirming with volume and the next 1–2 sessions of OI change before treating it as a strong directional signal.)
Levels to Watch
Support / invalidation: 23,380–23,350. A 15m close below this negates the reversal idea and reopens the channel's downside.
Immediate resistance: 23,500, then 23,600–23,650 (prior swing structure).
First real test: ~23,700–23,750 — this is where the channel's mid-line and the last swing high sit; reclaiming it would be the first real technical evidence the downtrend is breaking, not just bouncing.
Bottom Line
This is a potential bullish reversal off channel support, backed by (1) price rejecting the lower trendline, (2) RSI turning up, and (3) options positioning tilting from puts to calls. It is still counter-trend until Nifty closes back above the channel's mid-line (~23,700+). Treat 23,350 as the line in the sand.
________________________________________________________________________________
Not investment advice — shared for educational/technical-analysis discussion only. Please do your own research and manage risk before trading.  Long
Long
XAU/USD - Buyers Take Control Next WaveOANDA:XAUUSD is reacting again from the 4,280–4,360 support zone, an area that already produced a strong rebound earlier this month. However, price is still trading below the descending trendline and around the Ichimoku structure, so the bullish reversal is not confirmed yet.
If buyers defend this zone and price breaks decisively above the trendline, I favor a recovery toward:
🎯 Target: 4,510
Macro Market: Gold is facing a difficult backdrop after US PPI rose 0.4% in August and annual producer inflation reached 5.4%, lifting the probability of a Fed rate hike to around 70%. The US 10-year yield is also close to 5%, while the Dollar remains firm.
A sustained H2 break below 4,280 would weaken the recovery scenario.
AURICVERSE View: technically, Gold is sitting at an attractive support area, but macro remains a headwind. I want to see support hold + trendline breakout before treating 4,510 as the next upside objective. Long 
Education

 Education

Education

Long 
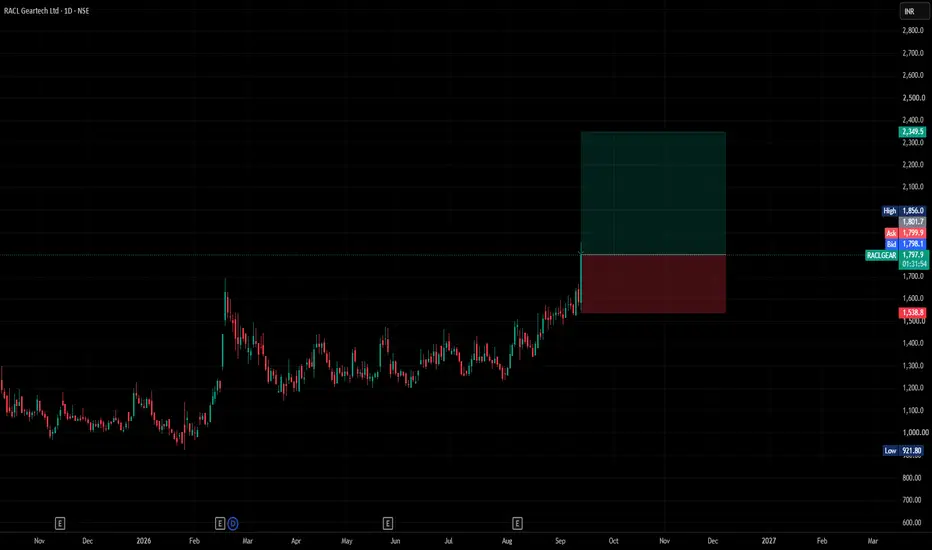
RACLGEAR Technical Analysis & Setup
Symbol: RACLGEAR (RACL Geartech Ltd.) — Daily Timeframe (NSE)
Current Price: ₹1,803.20 (-1.54% intraday move)
Market Structure: Following a multi-month accumulation range above the structural low of ₹921.80, the stock formed a strong series of higher highs and higher lows, breaking out through resistance near the ₹1,800.00 region with expanding bullish candles.
Key Technical Trade Levels
Entry Zone: ~₹1,801.70 – ₹1,804.90 (Breakout continuation level)
Stop Loss (SL): ₹1,538.80 (Defined risk level below the recent consolidation base support)
Immediate High: ₹1,856.00
Intermediate Target 1: ₹2,204.20 (Horizontal projection level)
Macro Horizon Target: ₹2,349.50 (Upper green target zone)
Structural Base Low: ₹921.80
Trade Bias & Summary
The stock displays a strong bullish trend structure exiting a multi-month accumulation base. As long as price holds above the ₹1,538.80 support zone on daily closes, the setup favors upside continuation toward testing intermediate resistance at ₹2,204.20, with macro expansion potential reaching toward ₹2,349.50.
Disclaimer: This post is for educational and technical analysis purposes only and does not constitute financial or investment advice. Always manage your position sizing and risk control parameters responsibly.  Long
Long
Long

Long 
XAU/USD - Breakout Control, Bulls Eye 4.550OANDA:XAUUSD is attempting to break the descending trendline after buyers defended the 4,325–4,390 buy zone. Price is also recovering around the Ichimoku structure, suggesting bearish momentum is starting to weaken.
If Gold can hold above the trendline and 4,390, I favor continuation toward:
🎯 Target: 4,550
Macro Market: Gold is slightly stronger today as a softer US Dollar provides support. However, Brent above $100 and the US 10-year yield near 4.84% are keeping inflation and Fed-hike risks elevated. Markets are therefore focused on upcoming US inflation data, which could determine whether this breakout gets real follow-through.
A sustained H2 move below 4,325 would weaken the bullish scenario.
AURICVERSE View: buyers have defended the floor; now they need to prove the trendline has truly changed sides. Hold the breakout, and 4,550 becomes the next level on my radar. Long 
 Short
Short
BTCUSDT: Hits Sell Zone, 76.5K Back to AimBTCUSDT is trading around 79,250 USDT, having just retraced into the 79,200–79,700 sell zone. This area is significant as it aligns with the upper boundary of a descending channel and a cluster of EMAs; meanwhile, the price structure from the 82,315 peak down to 80,604 continues to show a series of lower highs.
If BTC faces continued rejection below the 79,500–79,700 range, I lean towards a scenario where the price drops to 78,000 and subsequently extends down to 76,500–76,800 USDT. The fact that the price is testing resistance while within a descending channel suggests the current rebound is more of a retest than a trend reversal.
Macro factors also lend slight support to a correction scenario. Brent crude is approaching $100 per barrel, fueling inflation concerns and keeping the probability of a Fed rate hike high; additionally, Reuters notes that Bitcoin remains below 80K amidst cautious "risk-on" sentiment.
The bearish scenario would lose momentum if BTC breaks out of the channel and holds firmly above the 79,700–80,000 level.
Will the sell zone continue to cap BTC, or do the bulls have enough strength to reclaim the 80K mark? Short