NIFTY : Trading levels and Plan for 07-Sep-2026🗓️ 07-SEP-2026 | EDUCATIONAL MARKET FRAMEWORK
⏱️ TIMEFRAME: 15 MIN
📍 REFERENCE CLOSE: 23,938.40
━━━━━━━━━━━━━━━━━━━━━━━━━━━━━━━━━━
🔑 KEY LEVELS FOR THE SESSION
🔴 MAJOR RESISTANCE
24,124
🟥 LAST INTRADAY RESISTANCE ZONE
24,047 – 24,061
🟠 OPENING RESISTANCE / SUPPORT
23,991
⚫ REFERENCE CLOSE
23,938
🟢 IMMEDIATE SUPPORT
23,836 – 23,857
🟩 MAJOR BUYER SUPPORT
23,559 – 23,632
━━━━━━━━━━━━━━━━━━━━━━━━━━━━━━━━━━
🚀 SCENARIO 1 — GAP-UP OPENING
100+ POINT GAP UP
Expected Opening Zone:
23,938 + 100 = 24,038+
A 100+ point gap-up would place NIFTY directly around the 24,047–24,061 resistance zone.
🟢 BULLISH CONFIRMATION
If NIFTY opens above 24,038 and:
• Holds above 24,047–24,061
• Gives a clean 15-min candle close above resistance
• Retests the breakout zone successfully
• Forms higher highs and higher lows
➡️ Bullish continuation setup may develop.
🎯 UPSIDE REFERENCE
24,061 → 24,124
⚠️ GAP-UP TRAP
If NIFTY opens above 24,038 but fails near 24,047–24,061, watch for:
Gap Fill → 23,991 → 23,938
📚 EDUCATIONAL RULE
A gap-up is not automatically bullish.
Acceptance above resistance is more important than the size of the gap.
━━━━━━━━━━━━━━━━━━━━━━━━━━━━━━━━━━
⚖️ SCENARIO 2 — FLAT / NEUTRAL OPEN
OPENING AROUND 23,900–23,990
🟢 BULLISH SETUP
If price holds above 23,991 and successfully converts it into support:
23,991 → 24,047–24,061 → 24,124
Look for:
• 15-min candle close above 23,991
• Retest and rejection from lower levels
• Increasing momentum
• Higher-low formation
➡️ Bullish continuation can be considered after confirmation.
🔴 BEARISH SETUP
If NIFTY repeatedly fails around 23,991 and breaks 23,938:
23,938 → 23,857 → 23,836
A decisive breakdown of 23,836 can expose the 23,559–23,632 major buyer-support zone.
⚠️ RANGE CONDITION
If NIFTY remains trapped between:
23,857 ↔ 23,991
Avoid aggressive directional trades.
WHEN THE MARKET IS UNDECIDED,
YOUR BEST TRADE MAY BE NO TRADE.
━━━━━━━━━━━━━━━━━━━━━━━━━━━━━━━━━━
🔻 SCENARIO 3 — GAP-DOWN OPENING
100+ POINT GAP DOWN
Expected Opening Zone:
23,938 − 100 = 23,838 or lower
A 100+ point gap-down would bring NIFTY directly into:
🟢 23,836–23,857 SUPPORT ZONE
🔴 BEARISH CONFIRMATION
If NIFTY opens below 23,838 and:
• Fails to reclaim 23,836–23,857
• Retests the zone from below
• Produces lower highs
• Gives a strong 15-min breakdown
➡️ Bearish momentum can continue.
🟢 GAP-DOWN REVERSAL
If NIFTY gaps down but quickly reclaims:
23,836–23,857
and establishes acceptance above the zone:
23,938 → 23,991
A reclaim is confirmation — not an automatic buy signal.
━━━━━━━━━━━━━━━━━━━━━━━━━━━━━━━━━━
🧠 PROFESSIONAL EXECUTION RULES
1️⃣ WAIT FOR THE MARKET TO SHOW ITS HAND
The first 5–15 minutes can contain significant volatility.
Avoid entering simply because the opening is green or red.
2️⃣ USE 15-MIN CANDLE CONFIRMATION
For important levels, give greater importance to:
CANDLE CLOSE + RETEST + PRICE ACCEPTANCE
rather than a temporary intraday spike.
3️⃣ DO NOT CHASE BREAKOUTS
Prefer:
BREAK → RETEST → CONFIRMATION → ENTRY
4️⃣ RESPECT BOTH SIDES
23,991 is the immediate pivot.
Above it, bulls have an opportunity.
Below it, sellers may regain control.
━━━━━━━━━━━━━━━━━━━━━━━━━━━━━━━━━━
💰 RISK MANAGEMENT
⚠️ CAPITAL PROTECTION COMES BEFORE PROFIT GENERATION.
• Risk only a small, predefined percentage of trading capital per trade.
• Always define the STOP LOSS BEFORE entering.
• Position size should be calculated from the stop-loss distance, not from how confident the setup feels.
• Avoid averaging a losing intraday position merely because price has moved against you.
• Do not revenge-trade after a failed setup.
• Reduce position size during high-volatility openings.
• Maintain a daily maximum-loss limit.
📐 POSITION-SIZING FORMULA
POSITION SIZE =
MAXIMUM RUPEE RISK ÷ STOP-LOSS DISTANCE
Example:
Maximum acceptable risk = ₹1,000
Stop-loss distance = 20 points
Maximum quantity = 1,000 ÷ 20 = 50 units
This is an educational example only.
━━━━━━━━━━━━━━━━━━━━━━━━━━━━━━━━━━
📚 EDUCATIONAL TAKEAWAY
The objective of this plan is NOT to predict every NIFTY move.
The objective is to prepare for multiple outcomes BEFORE THE MARKET OPENS.
A professional approach asks:
“What will I do if price moves up?”
“What will I do if price moves down?”
“What will I do if price does nothing?”
When all three answers are defined in advance, emotions have less control over execution.
━━━━━━━━━━━━━━━━━━━━━━━━━━━━━━━━━━
⭐ KEY LEVELS TO REMEMBER
24,124 — MAJOR RESISTANCE
24,047–24,061 — INTRADAY RESISTANCE
23,991 — OPENING PIVOT
23,938 — REFERENCE CLOSE
23,836–23,857 — IMMEDIATE SUPPORT
23,559–23,632 — MAJOR BUYER SUPPORT
━━━━━━━━━━━━━━━━━━━━━━━━━━━━━━━━━━
⚠️ DISCLAIMER
THIS CONTENT IS STRICTLY FOR EDUCATIONAL AND INFORMATIONAL PURPOSES.
I am NOT A SEBI-REGISTERED RESEARCH ANALYST OR INVESTMENT ADVISER.
This trading plan does not constitute investment advice, a recommendation, solicitation, or a guarantee of market performance.
The levels and scenarios presented are based on technical analysis and should be treated as a framework for studying market behaviour, not as guaranteed entry or exit signals.
Trading and derivatives involve substantial risk, including the possibility of significant financial loss.
Please conduct your own research, use appropriate risk management, and consult a SEBI-registered professional before making investment decisions.
━━━━━━━━━━━━━━━━━━━━━━━━━━━━━━━━━━
TRADE THE SETUP.
MANAGE THE RISK.
NEVER TRADE THE PREDICTION.  Long
Long
Bharti Airtel Ltd- Swing Trade Setup Bharti Airtel Ltd: CMP: ₹1,910.8; RSI: 64.88
📈 Technical Structure Turning Bullish
After a prolonged corrective phase, Bharti Airtel appears to be completing a higher-degree correction and is now attempting a fresh impulsive move upward.
🔹 Elliott Wave View
The decline from ₹2,174 to ₹1,740 looks like a completed A-B-C corrective structure. The recent rally suggests the beginning of a new impulsive Wave-1, with a breakout confirmation now underway.
🔹 Pivot Point (PP) Analysis
Price has reclaimed the key pivot zone around ₹1,900 and is attempting to sustain above it. Holding above this level keeps the bullish bias intact.
🔹 MA Ribbon
The short-term moving averages have turned upward and price has reclaimed the MA ribbon after months of consolidation. This indicates a positive shift in momentum and trend strength.
🔹 RSI Strength
RSI has moved above 55 and is making higher highs, confirming improving momentum without entering overbought territory.
🔹 Volume Confirmation
The breakout candle is supported by higher-than-average volumes, indicating institutional participation rather than a mere short-covering rally.
🎯 Trading Plan
✅ Buy Above: ₹1,920 (closing basis)
🎯 Target-1: ₹2,055
🎯 Target-2: ₹2,165
🛑 Stop Loss: ₹1,835
💡 A decisive breakout above the falling trendline could trigger the next leg of the uptrend. Risk-reward remains favourable for positional traders.
📌 Thanks a ton for checking out my idea! Hope it sparked some value for you.
🙏 Follow for more insights
👍 Boost if you found it helpful
✍️ Drop a comment with your thoughts below!  Long
Long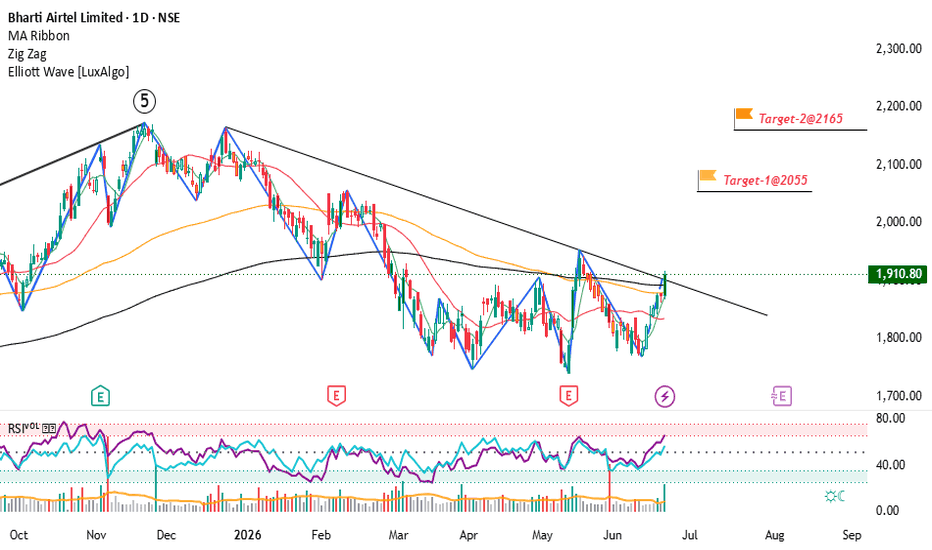
 Education

Trading Masterclass #1Institutional trading means trading like hedge funds, banks, prop firms, and professional desks. They do not trade based on emotions, random tips, or gambling. They use systems, probabilities, risk control, position sizing, discipline, and psychology.
Retail traders often lose because they focus only on “entry.” Institutions focus on:
Risk Management
Capital Protection
Position Sizing
Probability
Psychology
Consistency
Repeatable Edge
In options trading, if you think like institutions, your results can improve significantly
 Education

 Education

 Education

BRIAN XAUUSD – GOLD REBOUNDS, BUT 4,591 IS THE REAL TEST BRIAN XAUUSD – GOLD REBOUNDS, BUT 4,591 IS THE REAL TEST
Gold is closing the week with a strong recovery attempt, but the chart is still not giving a fully clean bullish continuation yet.
After the sharp value breakdown from the previous upper structure, gold dropped deeply into the lower area near 4,300. Buyers reacted from that zone and pushed price back above 4,400, showing that demand is still present.
However, the main resistance has not been cleared.
The current recovery is happening below the POC - VAL sell zone around 4,591. This is a very important level because it represents the previous value area where sellers were active before the breakdown. If gold can return into that zone, the market may face another strong rejection before deciding the next larger direction.
Technical structure
On the H2 chart, gold is trading around 4,425 - 4,430 after rebounding from the lower value base.
The nearest support is the Buy zone POC around 4,251. This is the first major buyer zone below the current price and also a key area where price may react if another correction happens.
Below that, there is a POC scalping area around 4,150 - 4,170, followed by the deeper Buy zone VAL around 4,086. These are the lower value zones where buyers may appear again if gold makes a deeper reset.
For now, the short-term structure is in recovery mode, but the larger value map still shows that gold has not fully reclaimed control. The market needs to prove whether this rebound is real accumulation or only a correction before another sell reaction.
Important zones
Current price area: 4,425 - 4,430
Gold is recovering after the strong downside move.
POC - VAL sell zone: 4,580 - 4,595
Main resistance and potential seller reaction zone.
Buy zone POC: 4,245 - 4,260
First major buyer reaction area if price pulls back.
POC scalping zone: 4,150 - 4,170
Secondary reaction area if selling pressure expands.
Buy zone VAL: 4,080 - 4,095
Deep value support and strongest buyer zone on the chart.
Trading scenario
Priority view: wait for buy reaction from 4,245 - 4,260
Entry:
Look for buy positions only if gold pulls back into the Buy zone POC around 4,251 and shows clear bullish rejection.
Stop Loss:
Below the local sweep low or below the POC support zone.
Take Profit:
TP1: 4,370 - 4,400
TP2: 4,450
TP3: 4,580 - 4,595
This setup follows the idea that buyers may defend the lower value structure again, but confirmation is needed. I would not chase buy while price is floating in the middle of the range.
Alternative scenario
If gold continues higher without pullback and reaches 4,580 - 4,595, I will watch for a sell reaction.
That zone is the old POC - VAL resistance, so sellers may use it to push price lower again. A rejection from this area can send gold back toward 4,450 first, then 4,251 if bearish pressure returns.
If gold breaks and accepts above 4,595, the bearish pressure weakens and the recovery structure becomes much stronger.
Final view
Gold has shown that buyers are not finished yet, but the market is still inside a recovery phase, not a confirmed bullish breakout.
The cleanest plan is to wait for price to return to value. If 4,245 - 4,260 holds, buyers may create another strong rebound. If gold pushes straight into 4,591, that becomes the key resistance test.
For me, the map is simple:
Hold 4,251 = buyers can rebuild momentum.
Lose 4,251 = deeper correction toward 4,170 or 4,086.
Reject 4,591 = sellers still control the upper value.
Break above 4,595 = bullish recovery becomes stronger.
Gold is not weak, but it is also not free yet. The next reaction around 4,251 or 4,591 will likely decide the next major move.
Will gold pull back into value first, or will buyers push directly into the 4,591 sell zone before the next decision?
 Long
Long
Elliott Wave Theory - Better Profit StrategyElliott Wave Theory is a way of reading how price moves through repeating cycles of impulse and correction. Instead of treating every candle as random, the theory assumes that strong trends often develop in a 5-wave move, followed by a 3-wave correction labeled A-B-C.
In a bullish cycle, Waves 1, 3 and 5 move with the main trend, while Waves 2 and 4 are pullbacks. After Wave 5, the market can enter an A-B-C correction before the next larger move begins. The same logic works in reverse during bearish trends.
''Why Elliott Wave Can Help Traders Make Better Trading Decisions''
If price is already accelerating through Wave 3 or reaching the end of Wave 5, chasing the move can give you poor risk-to-reward. But if the market is completing a correction near support, you may be able to enter closer to the point where the next expansion begins.
That is where Elliott Wave can improve profitability: better timing, better location and clearer invalidation.
A trader can use the wave structure to answer three practical questions: Where is the trend?
The 5-wave sequence helps identify the dominant direction.
Where could the pullback finish?
Waves 2, 4 and especially the A-B-C correction help locate areas where price may reset.
Where is the trade wrong?
If price breaks the structure that should hold for the wave count to remain valid, the setup can be invalidated early instead of being held blindly.
How I Trade Elliott Wave
For a bullish setup, I first look for a clear 5-wave expansion. After Wave 5, I wait for price to correct through A-B-C rather than buying the top.
The area around Wave C becomes interesting only when it reaches a meaningful support zone and price starts showing strength again. I then look for confirmation such as a rejection, structure break, reclaim of support or renewed bullish momentum.
My preferred sequence is:
5-wave impulse → A-B-C correction → key support → confirmation → entry
For bearish setups, the process is simply reversed.
One of the strongest opportunities can also appear after Wave 2, because Wave 3 is often the most aggressive part of the trend. But the goal is still the same: wait for the correction instead of chasing the impulse.
AURICVERSE Takeaway
Elliott Wave is most useful when it helps you understand market rhythm.
Impulse tells you the direction.
Correction gives you the location.
Confirmation gives you the trade.
The mistake is trying to force every swing into a perfect wave count. The better approach is to use Elliott Wave together with structure, support/resistance and risk management.
The goal is not to predict every wave.
The goal is to stop chasing price and start entering where the next move has a better chance of beginning. Education 
Simple Strategy - How To Make Profit With TrendlineTrendlines are simple, but traders often overcomplicate them. The idea behind the 3rd-touch setup is straightforward: if price has respected the same rising trendline twice, the third return can become a potential entry area.
1. Why the 3rd Touch Matters
A trendline needs at least two clear touches. Touch 1 creates the first swing low, Touch 2 confirms the trendline, and Touch 3 becomes the potential trading opportunity.
By the third touch, the market has already shown that buyers were willing to defend this structure before. Still, remember: a trendline is a zone to watch, not an automatic Buy signal.
2. First Check the Trend
For a bullish setup, I want to see a clear sequence of Higher Highs + Higher Lows. Then I connect the important rising lows with a trendline.
If price is already making Lower Highs, breaking support or moving sideways with no clear direction, I usually skip the setup. A simple rule: trade with the trend, not against it.
3. What to Look for at Touch 3
When price returns to the trendline for the third time, I wait for buyers to react. Confirmation can be a bullish rejection candle, strong bullish candle from support, liquidity sweep and quick recovery, or a small break above the recent local high.
The setup becomes: Uptrend → Pullback → 3rd Touch → Buyer Reaction → Entry. This is much better than buying the trendline blindly.
4. Entry, Stop and Target
Keep the execution simple. Entry: after bullish confirmation near the trendline. Stop Loss: below the recent Higher Low or below the structure that invalidates the setup. Target: previous swing high or the next resistance.You do not need to catch the exact bottom. You only need a setup where the potential reward is worth the risk.
If you start with $100, the goal should not be to double it quickly. The first goal is to protect the account. If you risk 1% per trade, your planned loss is only $1.
The correct order is: Find the setup → Define the stop → Calculate position size → Take the trade.
Final Thought
The 3rd-touch strategy works best when four things come together: Trend + Support + Confirmation + Risk Control. The trendline gives you the location, while price action tells you whether buyers are actually there.
So instead of thinking “Price touched my line, I should buy,” think “Price returned to a proven area. Now I want confirmation.”  Education
XAU/USD - Buyers Rebuild Wave, 4.700 Comes BackGood day, Traders!
OANDA:XAUUSD has staged a sharp recovery after the selloff from 4,700, with buyers stepping in strongly around the recent low near 4,300. Price has now reclaimed the 4,390–4,450 area, although it is still working through the H4 Ichimoku Cloud.
For me, 4,390–4,450 is the key zone. If the pullback remains supported here and XAUUSD can establish itself back above the cloud, the recovery has room to extend toward:
🎯 Target: 4,700
The macro backdrop has also improved for Gold. Fed Governor Christopher Waller’s more cautious comments pushed the market-implied probability of a September rate hike down from roughly 63% to around 50%, helping Treasury yields and the US Dollar ease. Gold subsequently jumped about 2% on Thursday.
The major risk comes later today with US Nonfarm Payrolls. A softer jobs report could further reduce Fed tightening expectations and support Gold, while a strong upside surprise could quickly revive Dollar and yield pressure.
A sustained H4 move back below 4,390 would weaken the recovery setup.
AURICVERSE View: the reaction from 4,300 changed the short-term picture, but the real confirmation comes from holding the reclaimed zone and clearing the cloud. If buyers achieve both, 4,700 is back on the radar.
Do you see this as a real recovery, or just a bounce before NFP? Long 
Long 
BTCUSDT: Bulls in Control, New TargetsBTCUSDT is trading around 80,810 USDT following a strong breakout from the descending channel that had been in place since late August. Notably, the breakout was accompanied by a clear surge in volume and pushed the price back above both the EMA34 (around 79,540) and the EMA89 (around 78,660), signaling a shift to a more positive H1 market structure.
After the rapid rally above 81,500, I am not keen on chasing the price. A more favorable scenario involves a pullback to the 79,700–80,200 zone, where the price holds the breakout level and buying pressure returns. If this occurs, I anticipate further upside toward 82,500, followed by a primary target zone around 83,600 USDT.
Macro factors currently offer mild support for a bullish outlook, as the DXY has dropped below 99.00 and Treasury yields have cooled, boosting risk-on sentiment. BTC also reclaimed the 80K mark during the previous session. However, the market is awaiting the US Non-Farm Payrolls (NFP) report today—with a forecast of approximately +56K jobs—so volatility could spike sharply following the data release.
The bullish scenario would weaken if BTC loses the 79,500 level, particularly if it falls back below the 78,600–78,700 range. Long 
 Long
Long
HUL Trend reversal can take upside 15-25% upsideBusiness Profile
HUL is India’s leading FMCG company with a strong portfolio across Home Care, Beauty & Personal Care, and Foods & Refreshment. Its key strengths are powerful brands, nationwide distribution, pricing power and premiumisation opportunities.
Valuation & Earnings
At ~₹1,974, valuation remains premium at around 42–43× P/E, so a large rerating may be difficult. However, Q1 FY27 showed 10% underlying sales growth, while FY26 delivered ₹63,763 Cr turnover and ₹10,324 Cr PAT before exceptional items—giving scope for earnings acceleration.
Latest Technical Pattern
HUL is testing the ₹1,950–₹1,975 long-term support zone, close to the lower boundary of its multi-year consolidation. Weekly RSI is around 30, indicating oversold conditions; a sustained reversal above ₹2,000 could be the first confirmation, while ₹1,900–₹1,920 is the key downside invalidation zone.
Efficiency
The business remains highly efficient with ~28–29% ROCE and ~21–24% ROE, while leverage is extremely low at about 0.03× debt/equity. Strong cash generation and negative net debt further strengthen the balance sheet, making HUL fundamentally resilient despite its premium valuation.

 Long
Long


