ICICIBANK Triangle + Falling Wedge Played Out—Apex Decision ZoneOverview
ICICIBANK has delivered a textbook multi-pattern setup on the Daily timeframe. Two classic chart patterns formed back to back — a Symmetrical Triangle spanning over a year, followed by a Falling Wedge within the correction — and both have now played out with price rallying over 120 points from the breakout zone.
The stock now sits at a critical Triangle Apex Zone — and the next move from here could be significant.
Pattern 1 — Symmetrical Triangle (April 2025 to March 2026)
A large symmetrical triangle formed over approximately 11 months on the Daily chart. The upper boundary connected a series of lower highs, while the lower boundary connected higher lows — classic converging structure indicating a period of indecision between buyers and sellers.
Price tested both boundaries multiple times before eventually breaking down in early 2026, leading to the correction phase.
Pattern 2 — Falling Wedge (April to June 2026)
During the correction, a Falling Wedge formed — two downward-sloping converging lines compressing price between approximately ₹1,380 and ₹1,186. The Falling Wedge is a bullish reversal pattern — it signals exhaustion of selling pressure.
Price broke out of the wedge at ₹1,265, confirmed the reversal, and rallied to a high of ₹1,404 — a move of approximately 139 points from the breakout level.
Where We Are Now
Price has pulled back slightly from the ₹1,404 high and is currently sitting at ₹1,387 — right at the Triangle Upper Band / Apex Zone near ₹1,393.
This is the most important level on the chart right now. The triangle's upper boundary, which previously acted as resistance for over a year, is now being tested from below.
Key Levels
🟡 Triangle Apex Resistance — 1,393
🟢 Falling Wedge Breakout Zone — 1,265
🟡 Next Resistance if triangle breaks — 1,500
🔴 Low of the move — 1,186
Two Scenarios Going Forward
🟢 Scenario A — Triangle Breakout Confirms
A daily close above ₹1,393–1,400 with good volume would confirm a breakout above the triangle upper band. This opens the path toward ₹1,500 — the measured resistance level above.
🔴 Scenario B — Rejection at Apex
If price fails to close above ₹1,393 and reverses, the triangle upper band has acted as resistance again. In this case watch ₹1,265 as the key support to hold the bullish structure.
What This Setup Teaches
Patterns within patterns are common in markets. A large triangle sets the broader context. A smaller falling wedge within the correction gives the entry signal. Understanding which pattern to trade and which to use as context is a key skill in technical analysis.
The triangle told us the structure. The falling wedge told us the timing.
Conclusion
ICICIBANK has completed a clean two-pattern sequence and is now testing a critical decision zone. The next daily close above or below ₹1,393 will define the next leg.
Watch the close carefully.
For educational purposes only. Not financial advice. Always manage your risk. Suzlon Energy Ltd Chart AnalysisTechnical Outlook
Currently trading within a long-term descending channel, a structure that has been guiding price action for several months after finding support near the lower boundary of the channel, the stock witnessed a sharp recovery and is now approaching the upper trendline resistance around ₹59.
One of the most notable features on the chart is the highlighted "Order Block" around ₹50 this area previously attracted strong buying interest and has acted as an important demand zone during the recent recovery the fact that price is holding above this level suggests that buyers remain active and are willing to accumulate shares at higher prices.
The current setup is particularly interesting because the stock is testing the upper boundary of the descending channel a decisive breakout above this resistance could signal a shift in market structure from correction to expansion such breakouts often attract fresh participation as traders look for confirmation that the downtrend has ended.
Price Projection
The projected move on the chart is based on the height of previous impulsive rallies within the same structure. Historically, Suzlon has demonstrated the ability to generate strong upside moves after establishing support near the lower boundary of the channel.
If the breakout is confirmed, the first major objective lies near the ₹70-75 zone, followed by a potential move toward ₹85-90. These levels are not predictions but rather technical projections derived from previous price swings and the overall channel structure.
Fundamental Outlook
One of the key participants in India's renewable energy sector, particularly in wind energy solutions. The company continues to benefit from increasing government focus on clean energy, rising renewable capacity targets, and growing investment in sustainable infrastructure.
Investors should closely monitor order inflows, project execution, profitability trends, debt management, and future capacity expansion. Continued improvement in these areas would strengthen the company's long-term growth story and provide additional support for the ongoing technical recovery.
Investment Perspective
The current setup presents a classic "pre-breakout" scenario. Price has recovered strongly from major demand zone and is now challenging long-term resistance. The ₹50-51 order block remains the key support area, while the ₹58-60 zone serves as the immediate hurdle for bulls.
A sustained breakout above channel resistance could significantly improve the technical outlook and potentially initiate the next phase of the uptrend. Until then, traders and investors should closely monitor price behavior around the current resistance zone for confirmation of strength.  Long
Long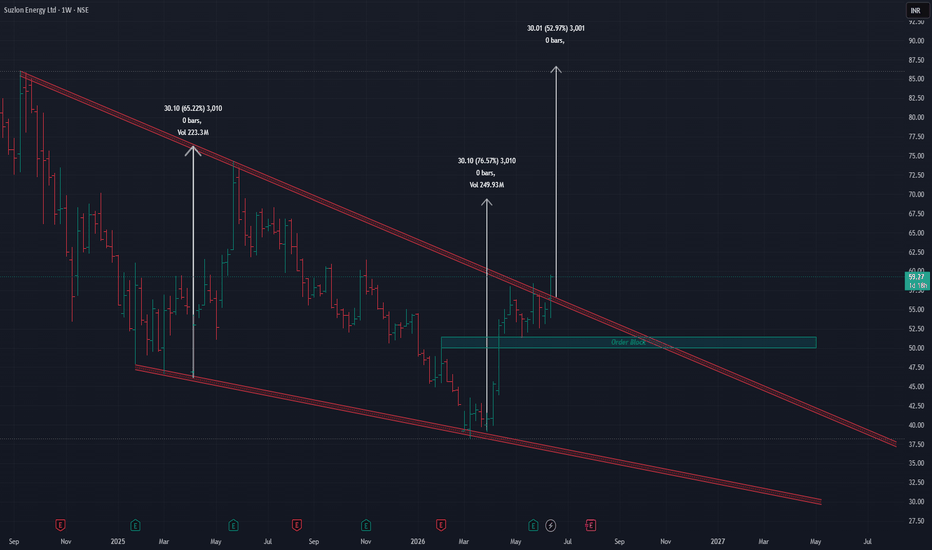
 Long
Long
Reliance (1H): Ending Diagonal Pattern At Major Support FloorLooking at Reliance Industries Limited (RELIANCE) on the 1-hour chart, a classic Elliott Wave setup is developing right at a major historical price floor.
Let us break down the wave structure, look at the recent global market development, and plan a risk-managed approach for the week ahead.
The Macro Picture: The 5-3-5 Zigzag
Looking at the broader structure from the 1,473.40 peak, the market has been correcting in a clear 5-3-5 Zigzag pattern:
Wave A: A clean 5-wave impulse down to 1,312.60.
Wave B: A 3-wave (A-B-C) corrective bounce that topped out near 1,371.10.
Wave C: A final 5-wave leg down to clear out the remaining sellers.
The Highlight: Ending Diagonal Wedge in Wave 5
The final leg of Wave C is the most important part of this chart. It is forming an Ending Diagonal Wedge, which is visible between the two narrowing blue trendlines.
This pattern is significant for three reasons:
Seller Exhaustion: The overlapping micro-waves (i to v) show that even though the price is grinding lower, the selling momentum is drying up.
Key Support Alignment: The wedge is sitting directly on a major horizontal support zone.
RSI Bullish Divergence: While the price made a lower low, the RSI indicator made a clear higher low (the solid line at the bottom). This indicates that the downward trend is losing strength.
The Monday Reality Check: Managing the US Market Sell-Off
On Friday, US indices faced a major sell-off after Indian markets closed, with the Nasdaq dropping over 4% and the S&P 500 down over 2.5%. This global weakness means Reliance will likely face heavy selling pressure and a potential gap-down open on Monday.
This global panic is exactly why a rule-based strategy is necessary. We do not guess or buy blindly at the open. Instead, we let the market choose between two paths:
Path A (The Throw-Over): Panic causes a brief plunge below the green support line to flush out weak hands, but institutional buyers quickly step in and push the price back up into the wedge. If this happens, the bullish setup stays alive.
Path B (Structural Breakdown): Heavy local selling cuts cleanly below the green support line on high volume. If this happens, the ending diagonal pattern is dead, Wave C is extending deeper, and we completely stay out of the trade.
The Strategy: Safe Entry vs Invalidation
To protect capital in an uncertain market, we only enter when the price confirms a reversal.
Bullish Entry Trigger
Trigger Level: A clean hourly candle close above 1,308.50 (the peak of minor wave iv).
Reasoning: Waiting for a close above 1,308.50 breaks the lower-high structure, confirms a breakout above the upper blue trendline, and proves that buyers have overcome the global market weakness.
Invalidation Level (Stop Loss)
The Line in the Sand: The green Support / Invalidation line.
Reasoning: If the price breaks and holds below this floor, the analysis is wrong. The trade idea is cancelled immediately to preserve trading capital.
Disclaimer: This post is for educational purposes only and is not financial advice. I am not a SEBI-registered analyst. Please do your own research and manage your risk carefully.  Long
Long
Sensex - What next?The price has formed a falling wedge pattern, which is bullish in a smaller time frame. As tomorrow is a trading holiday, on Friday, the price can open gap up or down depending on the global market situation.
Nearby resistance is at the 76500 zone, and support is at the 75300 zone.
Buy above 76160 with the stop loss of 75980 for the targets 76320, 76500, 76680, 76840 and 77040.
Sell below 75800 with the stop loss of 75980 for the targets 75660, 75400, 75240, 75060 and 74960.
Always do your analysis before taking any trade.
 Short
Short
 Long
Long
 Long
Long
 Long
Long
 Long
Long
RELIANCE: Triple Support Confluence at 1,304 – Bounce or Break?Technical Context
Reliance Industries Limited (RELIANCE) is moving inside a large "Megaphone" shape (a Broadening Wedge ) on the weekly chart. This means the price swings are getting bigger and more volatile. After falling from its high point of 1,611 , the stock has landed exactly at a major "floor" near 1,304 .
This 1,304 level is very important because three things are happening at once:
200-WMA: The price is touching a long-term moving average that big banks and funds usually protect.
0.618 Fibonacci: It is at a "Golden Ratio" support level, which is a common place for a bounce.
Hidden Bullish Divergence: Even though the RSI (momentum) looks low at 37 , the price is staying higher than its previous low. This often means the uptrend is still alive.
Bullish Scenario
Thesis: The buyers will defend the 1,304 floor, leading to a strong bounce back toward the top of the megaphone.
Trigger: A strong weekly close above 1,350 .
Targets: First target is 1,450 , with a long-term goal of 1,650 or higher.
Invalidation: If the price closes the week below 1,290 , this "buy the dip" idea is cancelled.
Bearish Scenario
Thesis: If the floor at 1,304 breaks, the stock will fall quickly toward the bottom green line.
Trigger: A weekly close below 1,290 .
Targets: First drop to 1,215 (green support line), and then down to 1,114 .
Invalidation: If the price quickly climbs back above 1,400 .
Summary
RELIANCE is at a "make or break" moment. The 1,300 level is the most important price to watch right now. Because of the Hidden Bullish Divergence and the 200-WMA , there is a high chance of a bounce. However, if the price falls below 1,300 , it could lead to much lower prices.
Disclaimer: This analysis is for educational purposes only and does not constitute investment advice. Please make your own decisions before making any trading decisions. Long 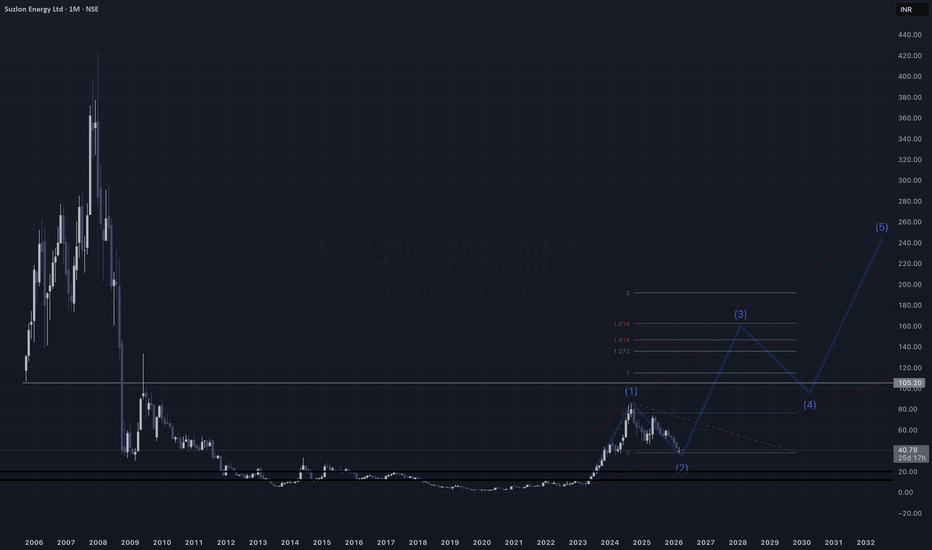
AIOT/USDT QUICK SCALPBased on the chart provided for AIOT/TetherUS Perpetual on the 15-minute timeframe, here is a technical breakdown of the current price action and the setup you have highlighted.
Current Market Context
Asset: AIOTUSDT.P (AIOT Perpetual Futures)
Timeframe: 15m (Short-term intraday)
Trend: Strongly Bearish. The price has undergone a massive sell-off from a high of approximately 0.05776 down to the current level of 0.02992.
Momentum: The steep angle of the red candles and the position below the moving average (the grey line) suggest intense selling pressure with very little retracement during the drop.
The Setup: Long Position Analysis
You have plotted a "Long" risk/reward tool at the bottom of this crash. Here is what the technicals suggest about this move:
1. Support & Bottom Fishing
The price is currently hovering around 0.02992, which appears to be a local psychological support. You’ve placed your "Stop Loss" just below the recent wick low at 0.02683.
The Logic: This is a "mean reversion" or "bounce" play. After such a vertical drop, the asset is technically oversold, and traders often look for a relief rally.
2. Risk-to-Reward (R:R)
Entry: ~$0.02992
Stop Loss (SL): $0.02683 (Protecting against a continuation of the crash)
Take Profit (TP) Target: Your green box extends back up toward the 0.057 area.
Analysis: While the R:R ratio looks mathematically attractive, targeting the previous all-time high immediately is highly ambitious. In a downtrend this strong, the first major hurdles will be the EMA (grey line) and previous "lower highs" near 0.039 and 0.045.
Key Risks & Considerations
⚠️ Caution: "Catching a falling knife" is one of the riskiest strategies in crypto.
Lack of Consolidation: Currently, there is no "base" or sideways movement to indicate that sellers are exhausted. We see one small green candle, but it hasn't yet engulfed the previous red candle.
The "Dead Cat Bounce": In crashes like this, any upward movement is often just a temporary pause before the price makes a new lower low.
Volatility: AIOT appears to be a high-volatility asset. Tight stop losses can be easily hunted by "wicking" before the actual move happens.
Summary of the Trade Plan
Bullish Case: If $0.02745 (the recent Low) holds, a recovery to the 0.035 - 0.040 zone is a reasonable first target for a relief rally.
Bearish Case: If the price closes a 15m candle below 0.02683, the bearish momentum is likely to continue, and the long setup is invalidated.
Recommendation: Look for a "Double Bottom" pattern or a break above the grey moving average on the 15m chart to confirm that the trend is actually shifting before committing to a full position.  Long
Long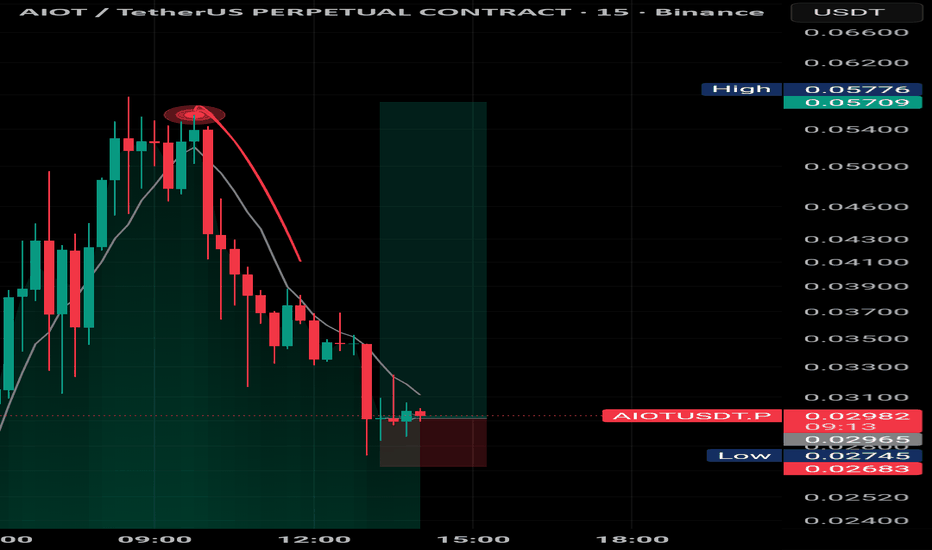
 Long
Long
 Short
Short
 Long
Long
$TRX is currently trading inside a rising wedge on the 12H chartAMEX:TRX is currently trading inside a rising wedge on the 12H timeframe, with price sitting around 0.289–0.290 after another rejection near the upper wedge resistance around 0.291–0.292.
Price attempted to break the upper wedge, but the breakout failed and sellers immediately pushed it back inside the structure. This type of rejection often leads to a rotation toward the lower boundary of the wedge.
Right now, momentum is slightly weakening after the rejection, which increases the probability of a move toward the lower wedge support around 0.282–0.284.
If price continues drifting lower, the wedge support becomes the next reaction zone, where buyers previously stepped in multiple times.
However, if TRX manages to reclaim 0.292 with strong candles, the rejection becomes a fake move and the market could expand toward 0.298–0.302.
Trade Plan:
With the rejection from the upper wedge, traders may look for a short-term move toward the lower wedge support.
Stop Loss: 0.2920
Resistance: 0.292
Support zone: 0.282–0.284
For now, price is rotating inside the wedge, and the next move will likely test one of the structure boundaries.
➖➖➖➖➖
Follow Crypto Sat 🟨  Short
Short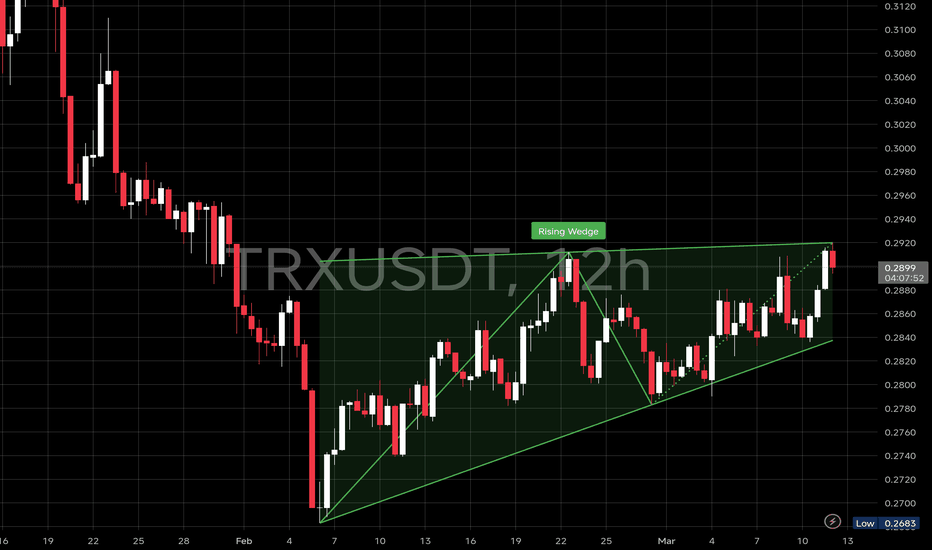
 Long
Long