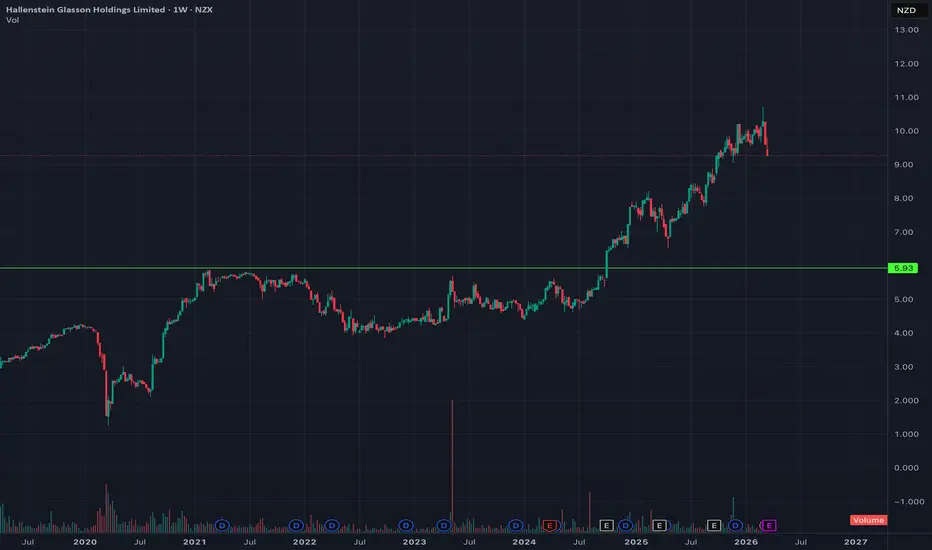
LongEarning report in 7 days expected buying prior also considering shorts in anticipation of the fuel shortage Longby kiwiktrader0
Bearish potential NZ index double top potential This one could be making the same sort of pattern after a very long uptrend Fractal repeat, not the last push high to take out the bulls before it falls, have we just seen a repeat of that recently Shortby William_Playfair1
Bremworth Limited NZXBremworth breaking out of large triangle (3mo chart) This is not the ideal entry for me as I don't like to chase Triangles are rarely reversals, but it is a sort of basing pattern Fundamentally it has a 3.4x P/E which is low... healthy current ratio of 4x and low debt to equity, 42% insider ownership so it all looks promising.... Short to medium term this could get to $1.60, so roughly 90%... probably do that relatively quickly, Longer term I think this could get to $4.80 which would be a 6x bLongby dionvuletich4
NTL New Talisman Weekly ChartFull disclosure I own this stock already but follow it because it is in my portfolio... Currently breaking out of flag pattern, with potential target of $0.14 Doesn't sound like much.. but that is >100% above where we are right now This stock is not for the faint hearted - if you are risk adverse stay clear... this is 100% not advice... Just highlighting technical setups for those who are interested in what they look like in real timeLongby dionvuletich0
Bullish on New Talisman GoldStarted to take a position in NTL in 2022, so was holding the bag for over two years. In 2024, decided to add to my position instead of take a 60% loss. Firstly, because they got a new CEO that appears reasonably competent, and seemed actually focussed of getting the mine into production - which I came to doubt was actually the focus for the previous Management. Then came a trickle of good news; New Government, open to being more supportive of extractive industries, New gravity mill was on ordLongby flyinkiwi10Updated 54
Pacific Edge PEB BreakoutAnother post noting a breakout on PEB, Likely to start moving higher, just need a small catalyst to trigger...Longby dionvuletich0
PEB Pacific Edge NZBreakout and retest with bollinger band squeeze I've posted multiple times about this stock and it is no doubt high risk and speculative, but technically it is showing bullish signs in my opinion and looking ready to move Full disclosure I've owned this stock for a while now, and looking at long term (years) play Longby dionvuletich0
PEB Pacific Edge - Looking to moveI'm already in this, but structure is interesting as it looks like a strong move is coming shortly Triangle breakout and retest complete... Watch this space!Longby dionvuletich2
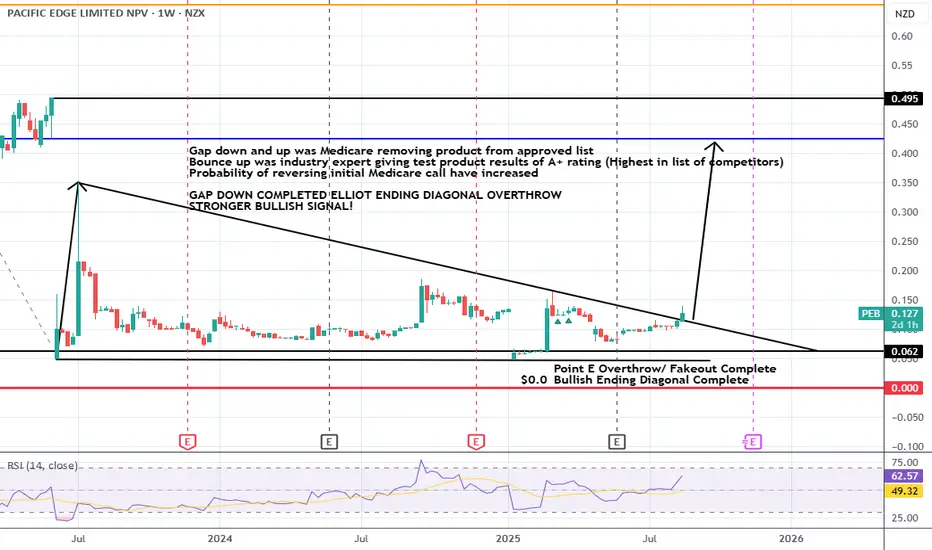
PEB Pacific Edge NZXPEB I already own this as a long term investment, but interesting chart right now.... Currently had gap down due to bad Medicare news removing product from approved test list, but shortly afterwards one product was ranked highest A+ for test credibility so this may remove the previous restriction in Medicare and open market again Technically this has a long term Elliott Wave 'Ending Diagonal' with an overthrow pattern which is technically a reversal signal, this was followed by a strong move uLongby dionvuletich1
What do you do about Spark?This analysis is provided by Eden Bradfeld at BlackBull Research—sign up for their Substack to receive the latest market insights straight to your inbox. Ah, Spark. Shocker of a result on Friday — losing in all segments (save their IoT business, which is negligible anyway). Since Jolie Hodson became CEO in 2019 the stock has decreased roughly 40%. In the last year the stock is down ~52%. The company has hocked off their tower business, closed their haywired “Spark Sports” streaming business, aby BlackBull MarketsUpdated 0
SPARK LONG FROM THIS SUPPORT Hey everyone! The price of Spark New Zealand (SPK.NZ) has recently dipped, and I believe it's a great buying opportunity right now. 💡 Targets: Target 1: NZD 3.445 Target 2: NZD 3.835 Target 3: NZD 4.100 These targets seem very achievable given the stock's performance and current market conditions. 📈 Important Notes: Please invest responsibly. I'm not a financial advisor—this is just my personal opinion and analysis. Only invest what you can afford to lose, especially if you're new to investLongby ginman90s20
NTL New Talisman NZXAlready bought this back in November, but this is an update as it has currently broken out of a triangle and also a bollinger band squeeze pattern Likely to move higher relatively quickly now that the consolidation has completedLongby dionvuletichUpdated 55
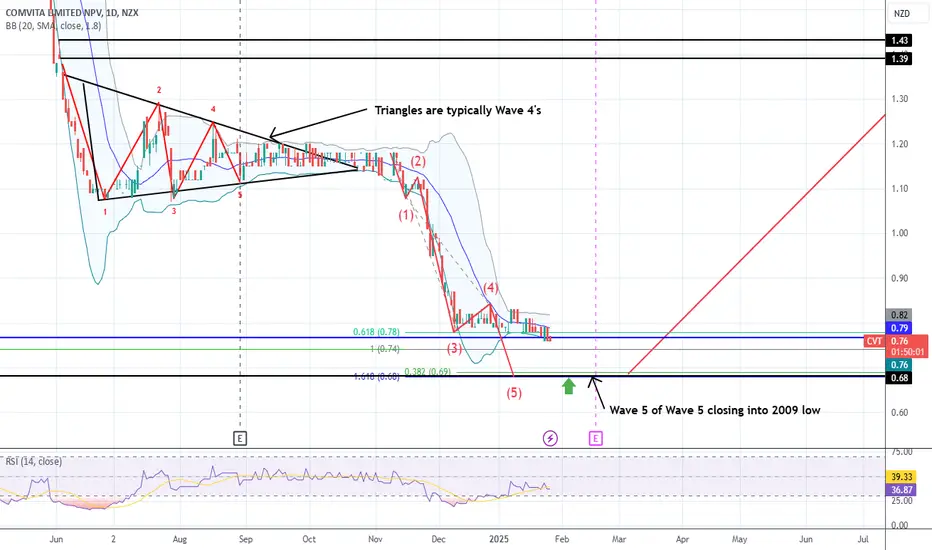
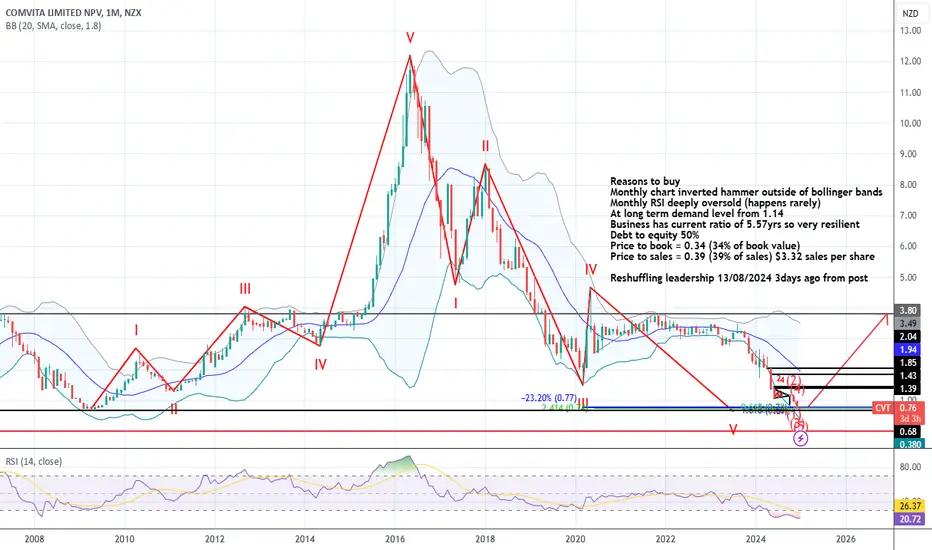
CVT DailyCVT closing in on 2009 low, I've entered within the triangle, scaling in as a small early position (this is a multi year trade) Currently broken lower as most triangles continue on, and there is a 5 wave structure lower and showing a fib cluster for a potential end of wave 5 Will buy again around the wave 5 cluster low if there are some bullish candles start showing up or clear divergence and a small candle...by dionvuletich0
CVT Monthly UpdateClose to 2009 low, looking for a reason to buy on the lower timeframes at support Indicators are oversold as well on the monthly chartby dionvuletich10
SDL NZ On medium to long term buy watchlistCurrently in a restructure, small cap stock with good fundamentals i.e. profitable and current ration of 2.0 is a software based company so has the ability to scale quickly without large investment Will be eyeing up a position around $0.42, with first target around $1.50 and possible exit around $2.45 This is a monthly chart so is a long term trade... Option B could be sell enough to get original money back at $1.50 and reinvest elsewhere while holding the rest till $2.45 to cash inLongby dionvuletich1
NTL New Talisman Gold Mines LtdBuying long term position in high risk gold miner today Exploration company but just purchased plant to start producing gold... Technically this has bollinger band squeeze at $0.023 cents per share - it definitely is a penny stock! don't think I've ever bought something so low in 20 years...!! Could have massive reward to risk if it turns profitable i.e. reward to risk >50X I'm happy to lose the entire investment in this as the potential reward to risk is massive (and very rare...) especially Longby dionvuletich3
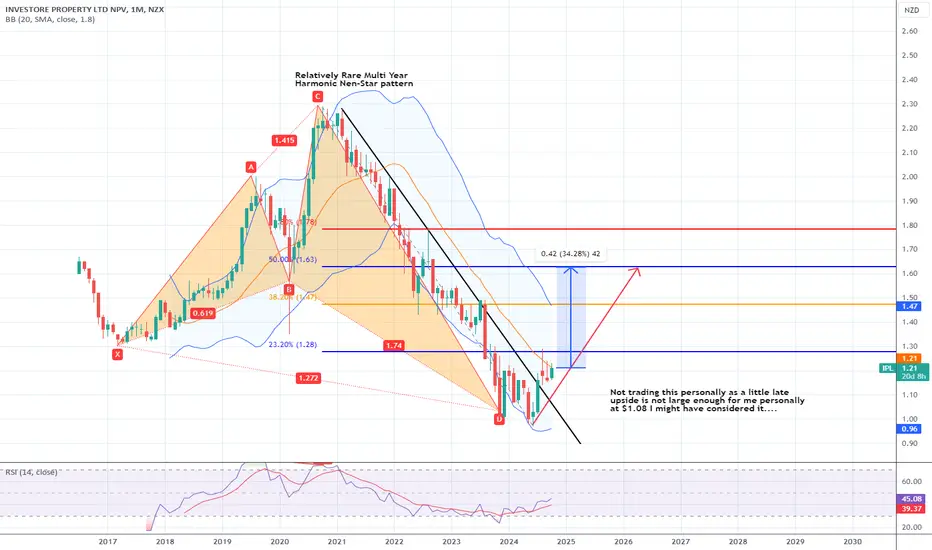
IPL Investore Property Limited Thought it was interesting to see a Nen star pattern on a monthly chart Personally the upside is not large enough as there are a couple of fundamental negatives which are putting me off this stock Posting out of interest only...Longby dionvuletich0
FBU Weekly Closer view of ButterflyAppears to have expanding triangle in the CD leg of a larger butterfly pattern Hoping it drops to around $1.80 and will buy around there with any buying pressure showingby dionvuletich1
FBU Monthly Fletcher Building On trading halt while they do a $700mil capital raise Hoping it drops to ~$1.80 ish for a long term buy due to technicals but fundamentally needs a restructure of debt or more equity... Carrying too much debt from memory due to their residential developments with long cash cycle payments which is problematic when the market stalls and buyers dry up Basically too much inventory... Hopefully they can convert some of these back into liquid cash.... and move on and perhaps focus a little more on by dionvuletich0
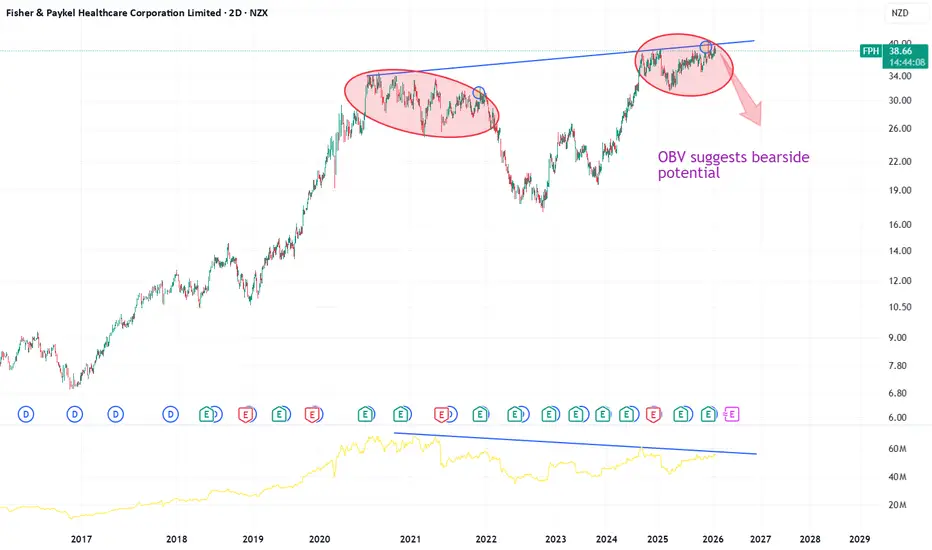
FPH Fisher and Paykel Monthly Possible Butterfly ZonesNo action, but FYI only Bit early, but possible butterfly levels on FPH on Monthly chart Indicator is climbing up into the overbought zone, but that does not mean much right now likely to keep climbing in short to medium term, but parabolic moves are also quickly reversed as there are no real levels of support on large bars Levels to watch...Shortby dionvuletich0
PEB Daily Breakout... large gap to closeHigher risk trade but also high potential reward to risk... Full disclosure I own this stock already as a long term play Looking to close gap and sell out half of holding and reinvest it elsewhere...Longby dionvuletich0
PEB NZ Pacific Edge Limited MonthlyI'm already in this one but is breaking out of another triangle There are gaps to close and the upside is relatively high compared to risk This is a loss making cancer diagnostic company but technically at support and breaking outLongby dionvuletich0
FBU Fletcher Building Monthly Near buying levels...FBU Fletcher building near buying levels Currently getting near demand level, currently has forward dividend of 11% but earnings have shrunk dramatically to loss making and likely going to restructure business or resize operations No action as yet as there is no clear signal right now to buy, but it is definitely on my watchlist and hoping it drops in the next 2-3 months so I can buy lower at multiple support levels and lift my dividend % when it turns around again The gap between the preferrLongby dionvuletich0
Rakon Daily 5 Wave projectionRakon NZ Possible 5 wave cluster levels close to longer term demand level Will be buying when it gets between 0.48-0.42c Fibonacci projection clusters are there and long term demand levelRLongby dionvuletich1
 LongLong
 Short
 Long
 LongLong
 LongLongLongLong
 LongLong

 LongLong
 Long
 ShortLongLongLong