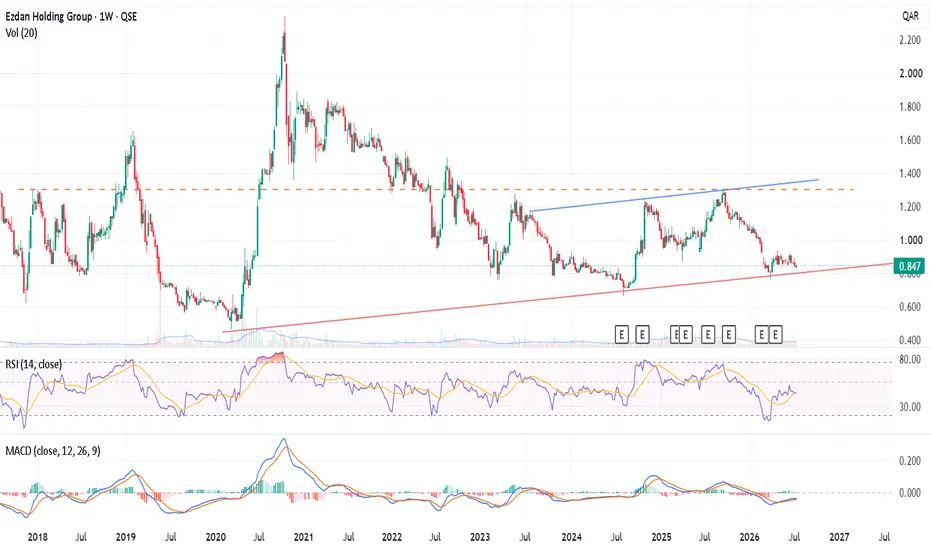
Ezdan Holding, Qatar : Accumulation Zone or Breakdown Risk?ERES (1W): Testing Key Macro Trendline Support – Accumulation Zone or Breakdown Risk?
Market Overview
Ticker: Ezdan Holding Group (ERES / QSE)
Timeframe: 1-Week (1W)
Current Price: 0.847 QAR
Sentiment: Neutral / Accumulation at Key Structural Support
Technical Analysis
1. Major Multi-Year Ascending Trendline
On the weekly frame, Ezdan Holding Group is trading right against a critical, long-term ascending support trendline (marked by the solid red line) extending back from the majo
QGMD- QatarTrend Overview
The stock is currently trading within a descending triangle pattern, which is characterized by a flat support base and a series of lower highs.
Current Price: 1.402 QAR (down -0.57%).
Key Support: The horizontal blue line at approximately 1.394 QAR acts as a critical demand zone that the price is currently testing.
Resistance: The descending blue trendline shows consistent rejection of higher prices, with the most recent lower high around 1.450 QAR.
Technical Indic
QAMCO at a Crossroads… Breakout or Breakdown?The stock is currently trading in a sensitive zone, with a reversal candlestick suggesting potential interest in revisiting the buyback area before attempting to close the artificial price gap. This setup leaves a constructive impression on the chart. However, the visible harmonic formation also projects deeper downside targets, notably around QAR 1.173, placing the stock at a critical juncture that will define the next directional move.
🔹 Positive Scenario
Sustained price action above QAR 1.57
CBQK IS PREPARING TO GO LOWERCBQK is making a reversal to go at least to 4.129 before starting to go higher.
If you4re holding a profitable position, close it and wait for the price to give us another entry to take to go higher.
And if you just bought and you're are in minor losses, close your position before making bigger ones to stuck with.
Follow for more!
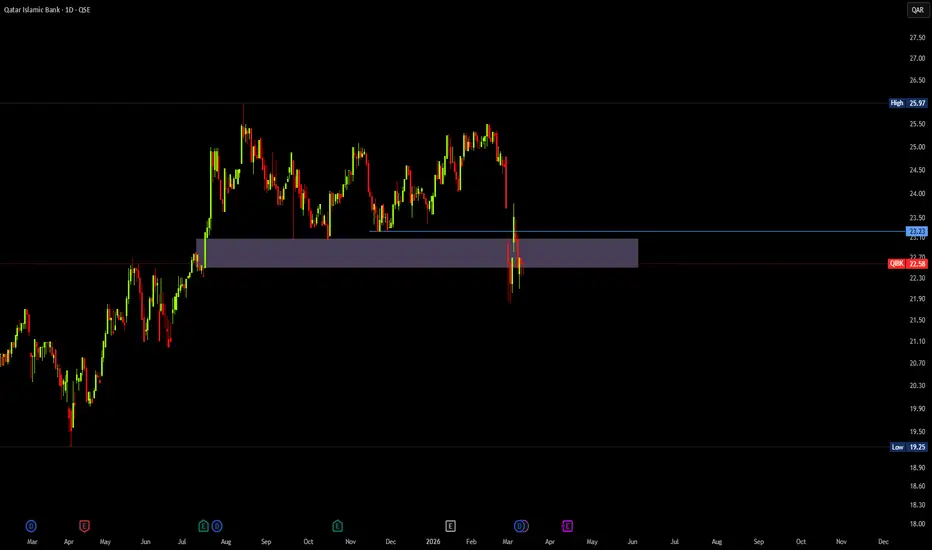
DON'T BUY QIBKIn the middle of the current crisis, people are searching for stocks they can buy to hold when the up movement is coming.
Well, now the situation on QIBK doesn't allow us to have an entry to hold for the next weeks or even months, since the price is pushing lower so hard.
Follow for more!
QGTS IS STILL FALLING DOWNBeen a long time since I last posted on Qatari Market,
On QGTS, there was a reversal created one day before what happened in the middle east so the price fell lower, (Why technicals and fundamentals complete each other).
What I read yesterday was that the price will start going higher, but what the chart shows is the opposite, for short term traders you have nothing to do for now, just wait for the price to give us a clean entry.
Follow for more!
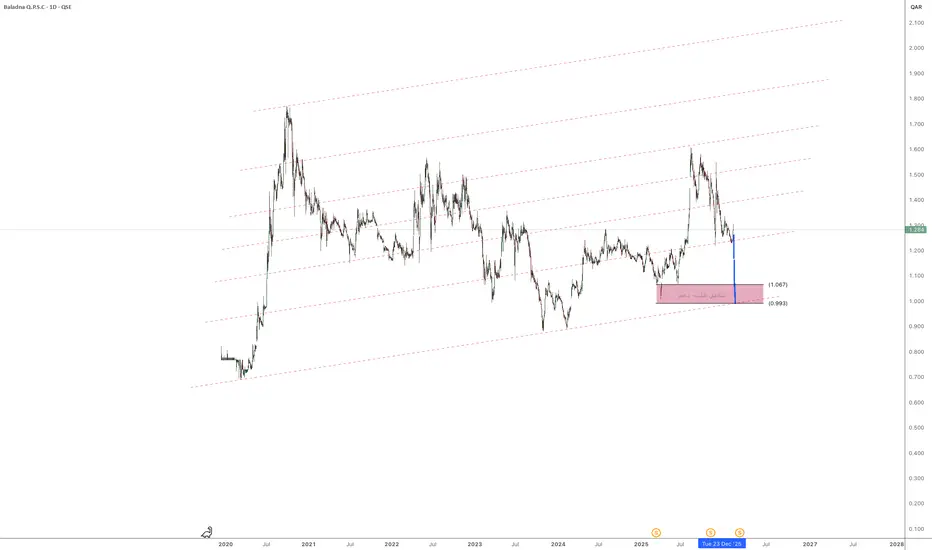
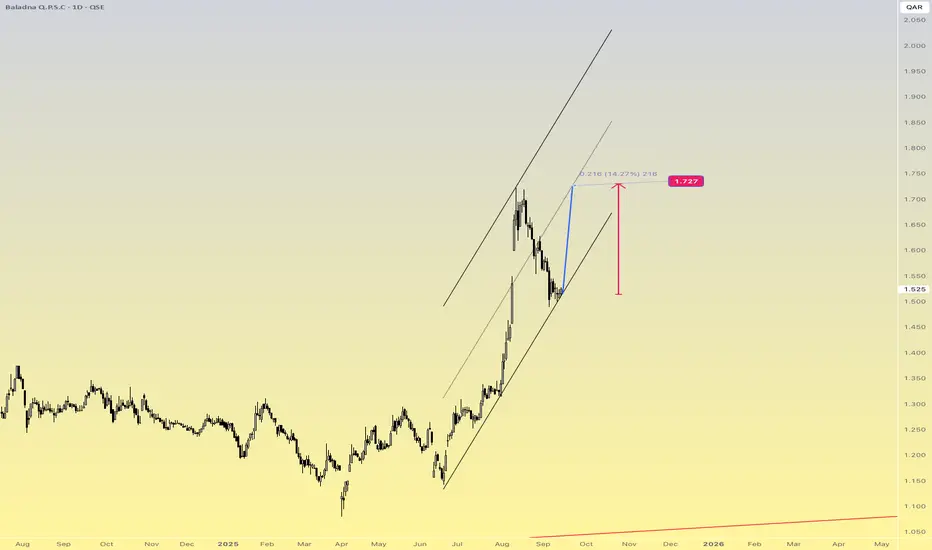
Baladna Q.P.S.C. (QSE) – Daily ChartBaladna Q.P.S.C. (QSE) – Daily Chart
🎯 Trading Logic
For swing traders:
Watch for reversal confirmation inside 1.00–1.07 zone.
Stop-loss below 0.97.
Upside risk/reward attractive if entry near support.
For investors:
1.00 area is historically accumulation-friendly.
Breakdown below it changes long-term thesis.
The 1.00 QAR area is the decision zone.
This is not a panic structure — it’s a test of demand.
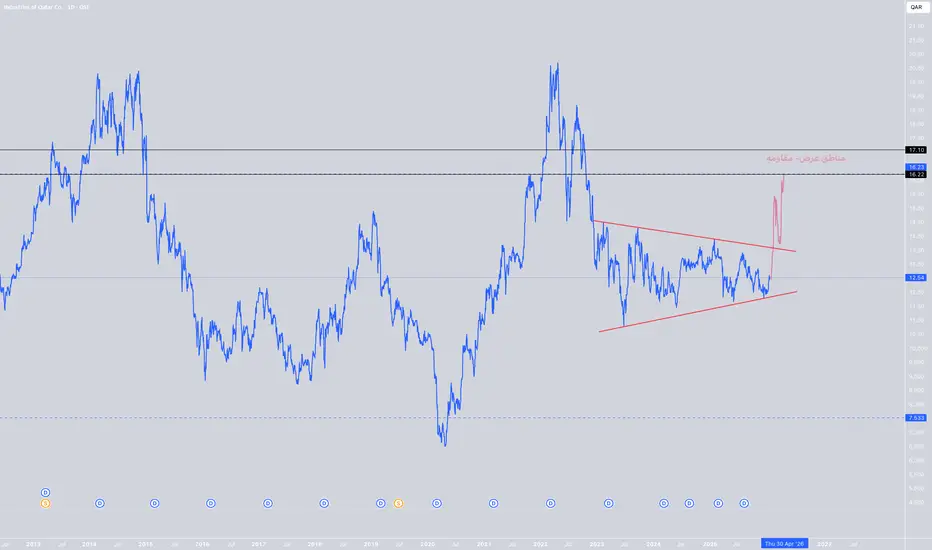
IQCDStock: Industries Qatar
🔹 Big Picture
The stock has been in a broad sideways range since the 2022 peak.
Price is currently moving inside a symmetrical triangle (higher lows + lower highs).
This structure usually represents accumulation before a strong move.
🔹 Key Price Levels
🟥 Resistance / Supply Zones
16.20 – 16.30
Major resistance + upper boundary of the supply zone.
17.10
Very strong historical resistance (previous major peak).
🟩 Support Zones
12.20 – 12.40
Current support + lower b
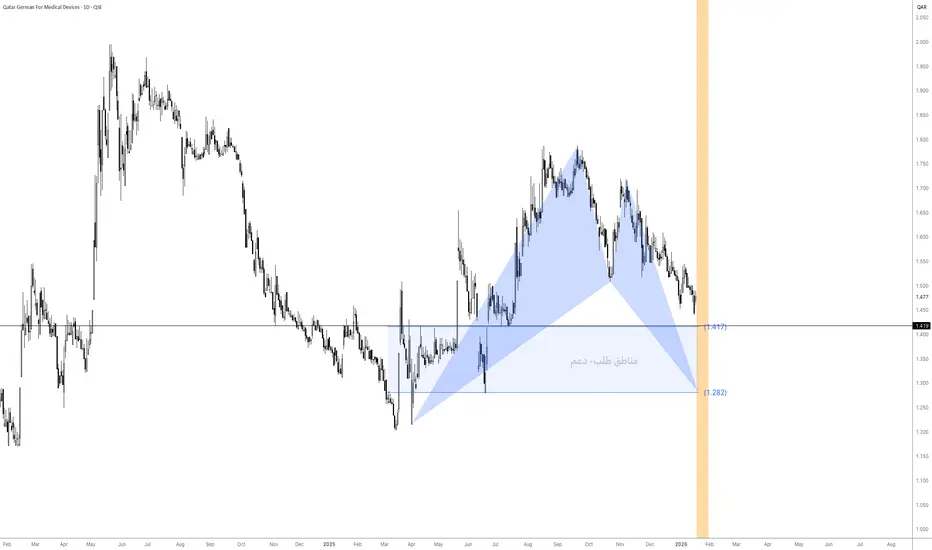
qgmdThe medium-term trend is bearish, following a clear rejection from the previous highs around 1.75–1.80.
The current price action represents a corrective move within a broader downtrend, not a confirmed trend reversal.
🟦 Demand Zone (Support)
The highlighted blue zone marks a strong historical demand area:
Upper support: 1.417
Lower support: 1.282
This zone previously:
Triggered strong bullish impulses
Acted as a consolidation base
Produced multiple upside reactions
➡️ It is a selective
QGMD - Weekly ChartThe stock is trading near its first downside target at 1.508 QAR which represents the previous low. A weekly close below this level ( currently the more probable scenario due to weak RSI momentum ) would likely open the way toward 1.375 QAR located below the ascending trendline, where a technical retest may occur.
If selling pressure persists and the price fails to hold 1.375 QAR the next downside target would be the secondary low at 1.281 QAR.
This bearish outlook remains valid unless Q4 2025
Al Faleh Educational Holding Co . [FALH]Stock completed its History correction as ABC
1st wave completed and 2nd Wave came in correction of Double Three Combination WXY with Running Triangle.
Upcoming is the Motive Powerful wave starting and expected to reach 3.369 QR.
I expected to reach the full wave with 5th wave that can hit 4 Qr next year Q1-Q2 2026 .
Highly & Strongly recommended for BUY 💥
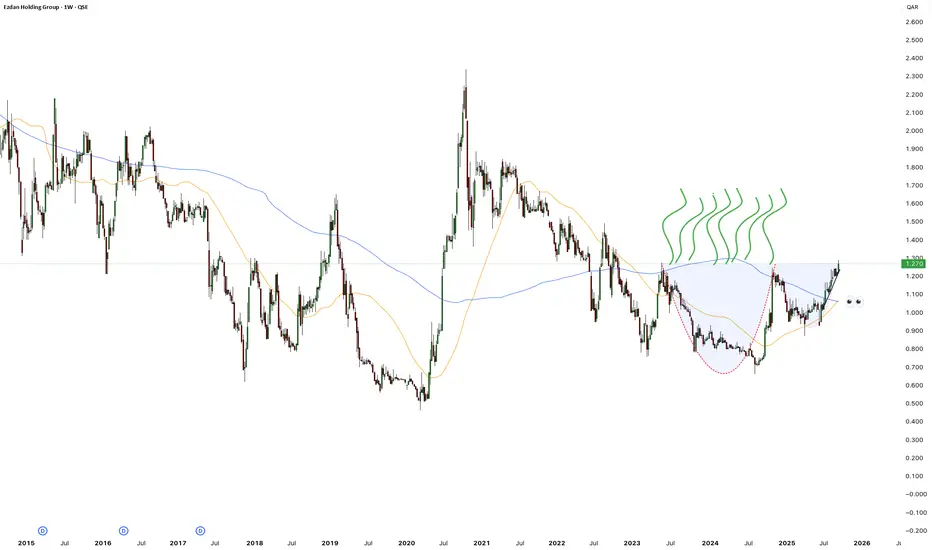
eres🔹 Chart Structure
The chart shows a long downtrend since 2017, followed by a prolonged base around 0.80–1.00 QAR.
Recently, the stock formed a rounded bottom (cup-like pattern), suggesting accumulation and a potential trend reversal.
Price is now testing the 1.25–1.30 QAR zone, which aligns with the 200-week moving average (blue line) — a key resistance area.
🔹 Moving Averages
50-week MA (orange) has started to turn upward, showing early bullish momentum.
200-week MA (blue) remains above p
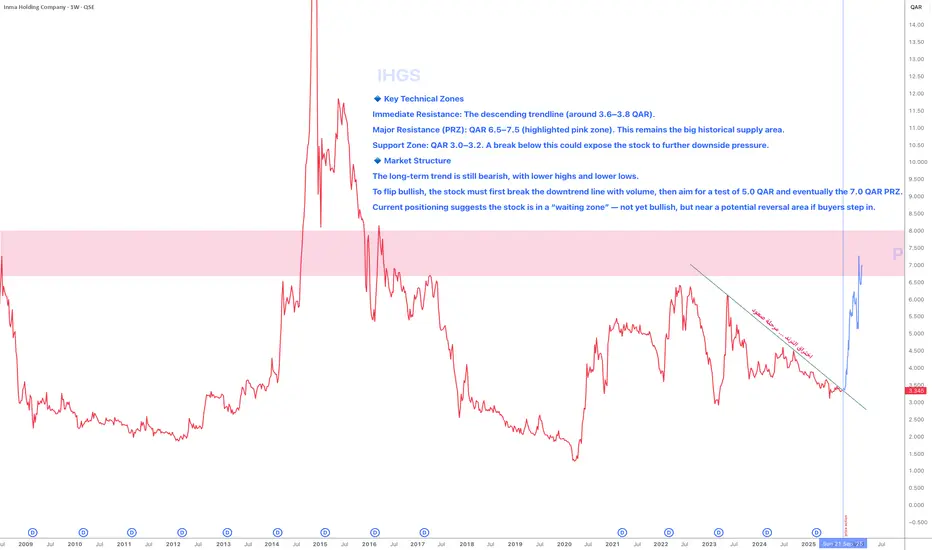
IHGS🔹 Key Technical Zones
Immediate Resistance: The descending trendline (around 3.6–3.8 QAR).
Major Resistance (PRZ): QAR 6.5–7.5 (highlighted pink zone). This remains the big historical supply area.
Support Zone: QAR 3.0–3.2. A break below this could expose the stock to further downside pressure.
🔹 Market Structure
The long-term trend is still bearish, with lower highs and lower lows.
To flip bullish, the stock must first break the downtrend line with volume, then aim for a test of 5.0 QAR a
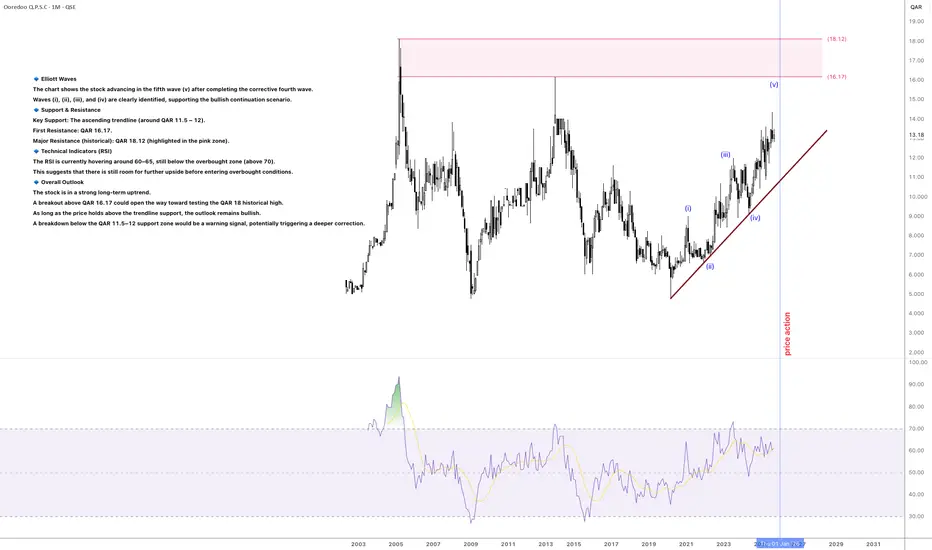
ords🔹 Elliott Waves
The chart shows the stock advancing in the fifth wave (v) after completing the corrective fourth wave.
Waves (i), (ii), (iii), and (iv) are clearly identified, supporting the bullish continuation scenario.
🔹 Support & Resistance
Key Support: The ascending trendline (around QAR 11.5 – 12).
First Resistance: QAR 16.17.
Major Resistance (historical): QAR 18.12 (highlighted in the pink zone).
🔹 Technical Indicators (RSI)
The RSI is currently hovering around 60–65, still below
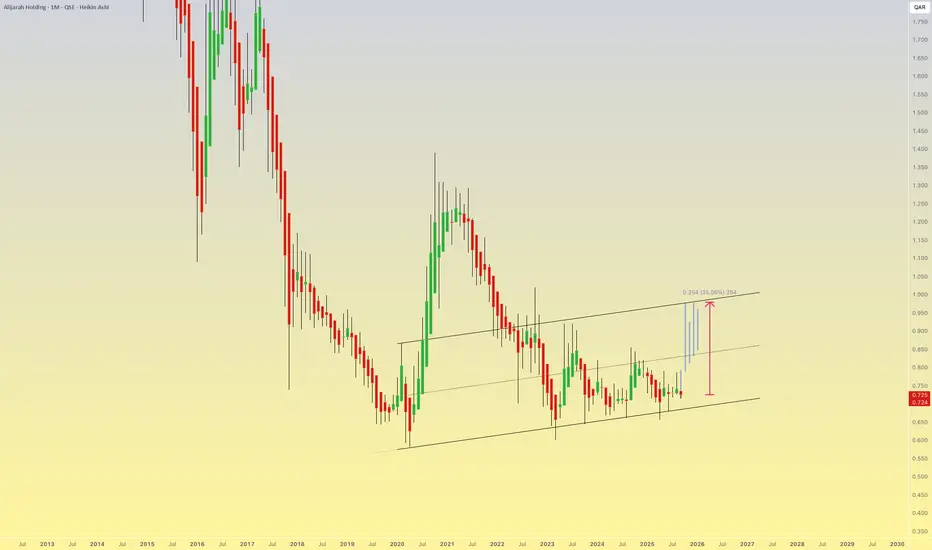
nlcs .qa[/b1. Overall Trend
Since 2014, the stock has been in a long-term downtrend.
However, from around 2019 it started moving within an upward price channel (support and resistance trendlines).
2. Current Setup
Current price: QAR 0.724 (as of mid-September 2025).
The chart shows a clear ascending channel from 2019 onwards.
The stock is now approaching the upper boundary of the channel around 0.95–1.00 QAR.
Projection on the chart suggests ~35% potential upside if price moves toward the top of
BLDNThe stock has a wave path and two possibilities, both of which lead to a very close rise above 2 Qatari Riyals and above very, very soon... The targets are on the chart... Good luck to all.
Target prices 2.054 - 2.065
Wave either ABC or could be 12345 impulse wave ( 1st wave of only 5 waves coming ).
Highly recommended for Buy 👌.
bldn Technical Pattern Observed:
The chart shows a Symmetrical Triangle pattern that has formed since around 2021.
The price has recently broken out of the triangle to the upside, which is typically seen as a bullish signal indicating a potential trend reversal or continuation.
📈 Projection Targets:
Target 1 (T-1): QAR 1.679
Target 3 (T-3): QAR 2.148
These targets are derived by projecting the height of the triangle from the breakout point upwards.
📊 Analyst Commentary (from chart text):
"I expect t