QIBK: Two situations: Trading rangeOn QIBK as you see on the chart we are in a trading range situation. If we have the breakout with force the vwap indicator and the resistance line by a big green candle with a large green volume it's mean that we will have a big probability to have an uptrend. In other hand, if we have the breakout with force the support line by a big red candle with a large red volume it's mean that we will have a big probability to have a downtrend...Thanks!
Is is over LASHA bank ?!It is important to understand the current market conditions that exist. In this case, the analysis suggests that the stock in question may not be a favorable investment opportunity due to decreasing investor confidence and potential for a trend reversal.
The first indicator of this stock is the predicted negative targets and decreasing volumes. Negative targets means that there is a projection that the price of the stock will decrease, while decreasing volumes suggest that fewer investors are
QIBK potential moves are closeQIBK (Qatar Islamic Bank) is a banking and financial services organization based in Qatar. As a forex technical analyst, based on the current market trends and historical data, I have prepared a detailed analysis of QIBK stock and have suggested an entry point, stop loss, and two take-profit levels.
Starting with the daily chart, we can see that QIBK has been trading in an overall uptrend. The stock recently consolidated and formed a base around the $16.50 level for several weeks before breakin
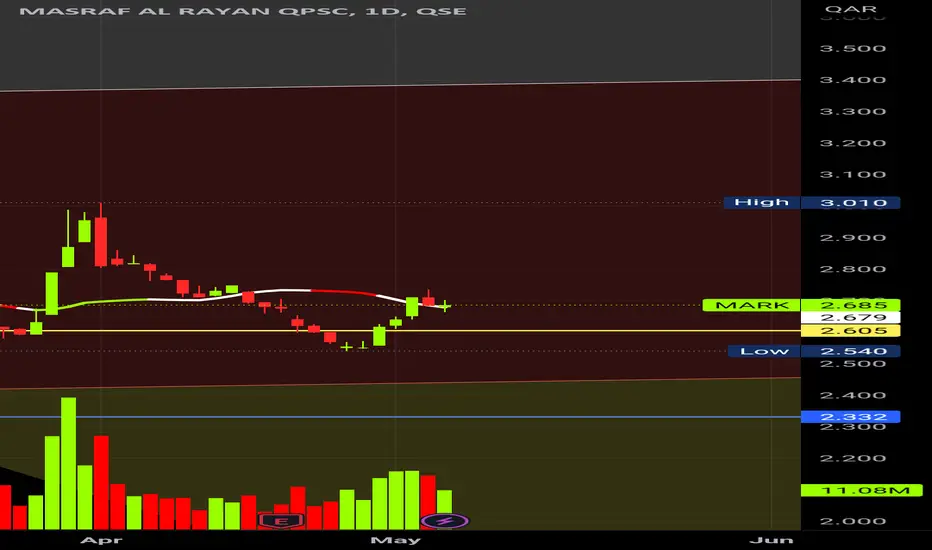
Quick analysis on MARKGood afternoon dear Qatari traders, I received some questions from some day traders about whether if it's possible to buy MARK tomorrow's trading session and I want to share my idea to the public.
You must wait for the confirmation of the break of the VWAP since it broke it and came back to pullback on it, be patient and wait for tomorrow's session to end to see how the market will close.
Follow for more analysis and if you got any questions don't hesitate to ask!
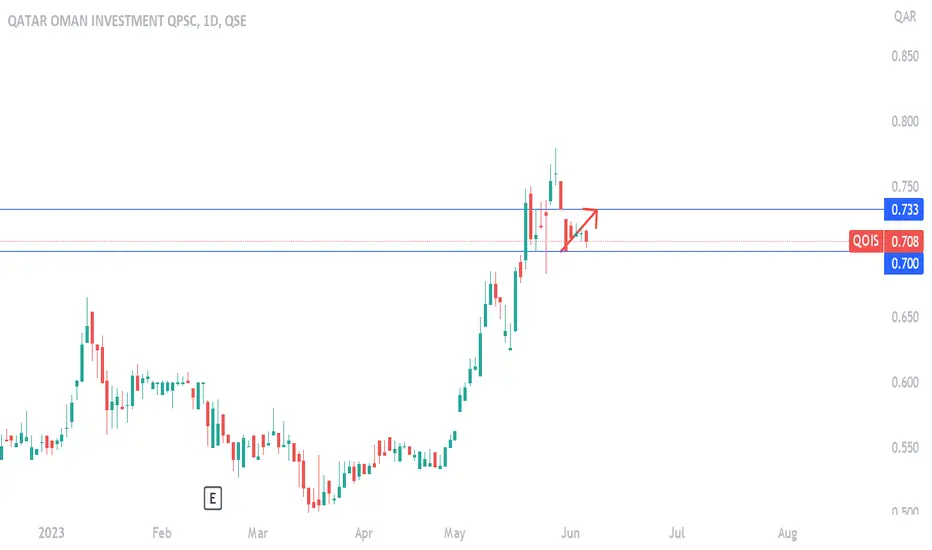
SIISThe price movement in the stock is interesting, especially since the stock touched the main trend line from the descending top in 2022.
Overbought indicators are nearing completion (in the short term)
I think that if speculators succeed in maintaining the liquidity momentum, we will likely see the stock near .7 QR levels
WDAM qatar food Sharehi
WDAM experienced historical fall and now its in good price and charts show sign of rising so if you decide to hold for long time to highest price you can take about 700% profit but if you like to trade daily positions i describe position below
entry:1.36
sl:1.29
target:1.99
RR:1.9