• Products
  • Community
  • Markets
  • Brokers
  • More
Get started
  • Markets
  • /Qatar
  • /Stocks
  • /Ideas
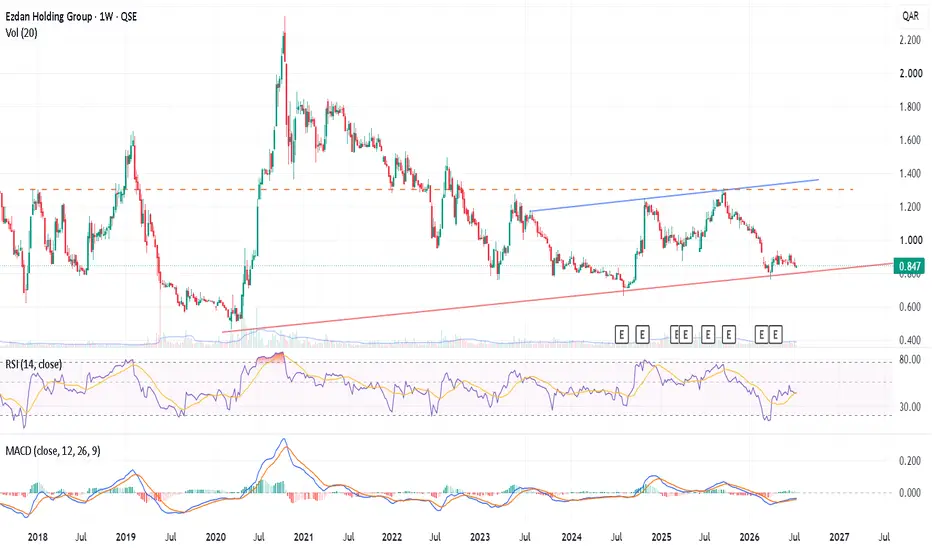
Ezdan Holding, Qatar : Accumulation Zone or Breakdown Risk?ERES (1W): Testing Key Macro Trendline Support – Accumulation Zone or Breakdown Risk? Market Overview Ticker: Ezdan Holding Group (ERES / QSE) Timeframe: 1-Week (1W) Current Price: 0.847 QAR Sentiment: Neutral / Accumulation at Key Structural Support Technical Analysis 1. Major Multi-Year Ascending Trendline On the weekly frame, Ezdan Holding Group is trading right against a critical, long-term ascending support trendline (marked by the solid red line) extending back from the major 2020 macro bottom. Price action has recently experienced a cooling-off period from its late-2025 swing high and is now consolidating tightly just above this primary dynamic floor (0.800 - 0.830 QAR). 2. Overhead Structural Resistance The Dynamic Ceiling: A secondary, gently ascending blue resistance line tracks the peaks from mid-2023 and late-2025, currently capping the upside around the 1.300 QAR area. The Macro Pivot Baseline: A long-term horizontal dashed orange line cuts right through the multi-year chart at approximately 1.330 QAR, marking a major historical inflection zone. 3. Technical Indicators Volume : Volume has stabilized significantly during this consolidation phase, indicating that selling pressure is beginning to dry up as price meets major trendline support. RSI (14): Currently flattening out at 39.61, sitting right beside its yellow signal line (39.43). The indicator is stabilizing just above oversold territory, reflecting a neutral momentum regime that often precedes an accumulation bounce. MACD (12, 26, 9): Both the MACD line ( -0.039) and the Signal line (-0.045) remain below the zero mark following the recent correction. However, the lines are beginning to flatten out and converge, while the bearish histogram is rapidly diminishing toward zero. A bullish crossover here would confirm the structural bottom. Trading Setup & Scenario Planning The Accumulation Long Setup (Trendline Bounce) Entry Zone: 0.830 – 0.850 QAR (Excellent risk-to-reward ratio given the proximity to a multi-year macro floor). Target 1 (Mid-Term): 1.050 QAR (Psychological round number and recent minor consolidation peak). Target 2 (Long-Term): 1.250 – 1.300 QAR (Retest of the long-term blue ascending trendline and structural horizontal resistance). Stop Loss: A definitive weekly candle close below 0.790 QAR invalidates this macro bullish defense thesis. _________________________ This multi-year trendline has protected the downside for over six years. Will the buyers step up once again to trigger a major recovery rally, or is the macro structure under threat? Let me know your setup in the comments!
QSE:ERES
by snour
QGMD- QatarTrend Overview The stock is currently trading within a descending triangle pattern, which is characterized by a flat support base and a series of lower highs. Current Price: 1.402 QAR (down -0.57%). Key Support: The horizontal blue line at approximately 1.394 QAR acts as a critical demand zone that the price is currently testing. Resistance: The descending blue trendline shows consistent rejection of higher prices, with the most recent lower high around 1.450 QAR. Technical Indicators & Patterns Volatility Compression: The price action is narrowing toward the apex of the triangle. This usually indicates that a significant "breakout" or "breakdown" move is imminent. Bearish Bias: In the medium term, the trend remains bearish after failing to maintain levels above 1.50 QAR earlier in May
QSE:QGMDLong
by QQQQ9999
Qatari German Company for Medical Devices (Q.P.S.C.) (QGMD.QA)Stock on Inverse Head and Shoulders pattern formation at bottom .. Initially 1st Target price = 1.888 QR - 1.963 QR. 2nd Target price = 3.000 QR. 3rd Target price = 2.678 QR. I believe Final Target price = 4.128 QR.
QSE:QGMD
by GNRI_Maker
QAMCO at a Crossroads… Breakout or Breakdown?The stock is currently trading in a sensitive zone, with a reversal candlestick suggesting potential interest in revisiting the buyback area before attempting to close the artificial price gap. This setup leaves a constructive impression on the chart. However, the visible harmonic formation also projects deeper downside targets, notably around QAR 1.173, placing the stock at a critical juncture that will define the next directional move. 🔹 Positive Scenario Sustained price action above QAR 1.57, followed by a breakout through QAR 1.63, could trigger a retest of the QAR 1.83 – 1.85 resistance zone. 🔹 Negative Scenario A decisive break below QAR 1.45 with weekly closing beneath it would expose the stock to QAR 1.33, and potentially the harmonic target at QAR 1.17. These levels may later evolve into accumulation zones for long-term investors. Geopolitical Linkage QAMCO’s performance is indirectly tied to geopolitical tensions between Iran and the United States, primarily through the channel of oil and gas prices. Any disruption in the Strait of Hormuz tends to elevate global energy prices, which in turn enhances QAMCO’s profitability due to Qatar’s low-cost natural gas advantage. On the flip side, heightened tensions also raise logistics and trade risks, impacting export flows and shipping costs.
QSE:QAMCShort
by Dr_N_
CBQK IS PREPARING TO GO LOWERCBQK is making a reversal to go at least to 4.129 before starting to go higher. If you4re holding a profitable position, close it and wait for the price to give us another entry to take to go higher. And if you just bought and you're are in minor losses, close your position before making bigger ones to stuck with. Follow for more!
QSE:CBQKShort
by YassineAnalysis
MARK IS GOING HIGHERMARK is one of my favorite stocks to buy, here as you can see we have a reversal and the price is preparing an up movement, you can buy and wait for the price to reach your target. Follow for more!
QSE:MARKLong
by YassineAnalysis
DON'T BUY QNBK YETAs you can see on the chart, the price is still pulling down to reach 17.46 before making any pullback to go higher. Buying more to average your position for now is another step into losses. Follow for more!
QSE:QNBKShort
by YassineAnalysis
IQCD WILL KEEP TAKING YOUR MONEYAs you can notice here on the chart, IQCD is still falling lower and lower, We have the reversal and the price kept pushing down to 11.25 to give us a confirmation, now it will continue to reach at least 10.57. Follow so you don't miss the reversal!
QSE:IQCDShort
by YassineAnalysis
DON'T BUY QIBKIn the middle of the current crisis, people are searching for stocks they can buy to hold when the up movement is coming. Well, now the situation on QIBK doesn't allow us to have an entry to hold for the next weeks or even months, since the price is pushing lower so hard. Follow for more!
QSE:QIBKShort
by YassineAnalysis
QGTS IS STILL FALLING DOWNBeen a long time since I last posted on Qatari Market, On QGTS, there was a reversal created one day before what happened in the middle east so the price fell lower, (Why technicals and fundamentals complete each other). What I read yesterday was that the price will start going higher, but what the chart shows is the opposite, for short term traders you have nothing to do for now, just wait for the price to give us a clean entry. Follow for more!
QSE:QGTSShort
by YassineAnalysis
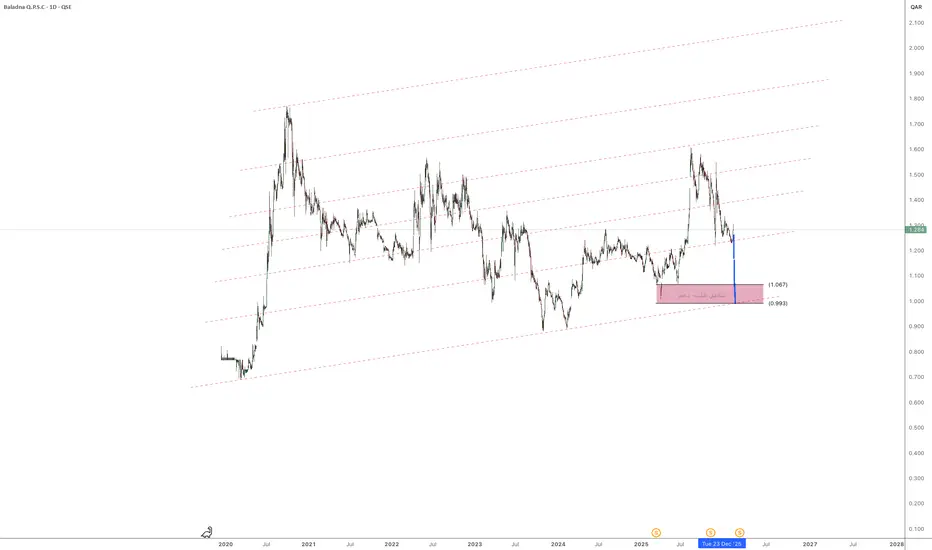
Baladna Q.P.S.C. (QSE) – Daily ChartBaladna Q.P.S.C. (QSE) – Daily Chart 🎯 Trading Logic For swing traders: Watch for reversal confirmation inside 1.00–1.07 zone. Stop-loss below 0.97. Upside risk/reward attractive if entry near support. For investors: 1.00 area is historically accumulation-friendly. Breakdown below it changes long-term thesis. The 1.00 QAR area is the decision zone. This is not a panic structure — it’s a test of demand.
QSE:BLDNShort
by QQQQ9999
11
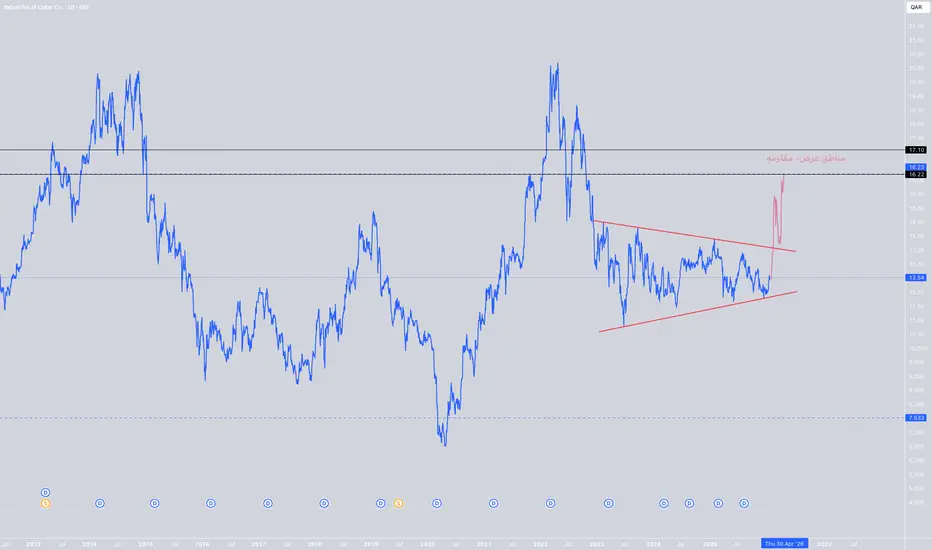
IQCDStock: Industries Qatar 🔹 Big Picture The stock has been in a broad sideways range since the 2022 peak. Price is currently moving inside a symmetrical triangle (higher lows + lower highs). This structure usually represents accumulation before a strong move. 🔹 Key Price Levels 🟥 Resistance / Supply Zones 16.20 – 16.30 Major resistance + upper boundary of the supply zone. 17.10 Very strong historical resistance (previous major peak). 🟩 Support Zones 12.20 – 12.40 Current support + lower boundary of the triangle. 11.00 – 10.80 Medium-term support. 7.50 – 7.60 Long-term historical support (only in a deep bearish scenario). 🔹 Expected Scenarios ✅ Bullish Scenario (Technically Favored) Clear breakout and weekly close above 16.30 Upside targets: 🎯 17.10 🎯 18.80 🎯 20.00+ (medium-term) 📌 Fits well with QGMD’s nature as a dividend + steady growth stock. ⚠️ Bearish Scenario Weekly close below 12.20 Downside targets: 11.00 Then 10.00 – 9.50 This scenario remains less likely as long as price holds inside the triangle. 🔹 Important Note Current price action shows volatility compression. The longer the price stays inside the triangle → the stronger the eventual breakout. Not ideal for short-term scalping, but very suitable for strategic positioning. 🎯 Summary Technically: Accumulation phase Smart approach: Trader → wait for 16.30 breakout Investor → accumulate near support with patience
QSE:IQCDLong
by QQQQ9999
qgmdThe medium-term trend is bearish, following a clear rejection from the previous highs around 1.75–1.80. The current price action represents a corrective move within a broader downtrend, not a confirmed trend reversal. 🟦 Demand Zone (Support) The highlighted blue zone marks a strong historical demand area: Upper support: 1.417 Lower support: 1.282 This zone previously: Triggered strong bullish impulses Acted as a consolidation base Produced multiple upside reactions ➡️ It is a selective accumulation zone, not a blind-buy area. 🟧 Current Price Context Price is trading near the upper boundary of the demand zone (~1.42). The market is testing support: Holding above → potential rebound Daily close below → weakness increases 🔻 Scenarios ✅ Bullish Scenario (Conditional) Daily close holding above 1.417 Appearance of bullish rejection / weakening selling pressure Potential upside targets: 1.55 1.65 1.72 (major resistance) 📌 This would be a corrective rally, not a confirmed trend reversal unless higher highs are formed. ❌ Bearish Scenario Daily close below 1.417 Downside targets: 1.35 1.282 (key demand base) A break below 1.282 would indicate structural breakdown and higher downside risk.
QSE:QGMDShort
by QQQQ9999
QGMD - Weekly ChartThe stock is trading near its first downside target at 1.508 QAR which represents the previous low. A weekly close below this level ( currently the more probable scenario due to weak RSI momentum ) would likely open the way toward 1.375 QAR located below the ascending trendline, where a technical retest may occur. If selling pressure persists and the price fails to hold 1.375 QAR the next downside target would be the secondary low at 1.281 QAR. This bearish outlook remains valid unless Q4 2025 financial results show a material improvement especially considering the company’s weak performance last year. However, early signs of recovery were observed during the first half of the current year providing cautious optimism. Sustained improvement in Q4 profitability could support a trend reversal, improve technical momentum, and allow the stock to target higher upside levels. A full technical reassessment will be required following the release of the final annual results.
QSE:QGMDShort
by Dr_N_
Al Faleh Educational Holding Co . [FALH]Stock completed its History correction as ABC 1st wave completed and 2nd Wave came in correction of Double Three Combination WXY with Running Triangle. Upcoming is the Motive Powerful wave starting and expected to reach 3.369 QR. I expected to reach the full wave with 5th wave that can hit 4 Qr next year Q1-Q2 2026 . Highly & Strongly recommended for BUY 💥
QSE:FALH
by GNRI_Maker
33
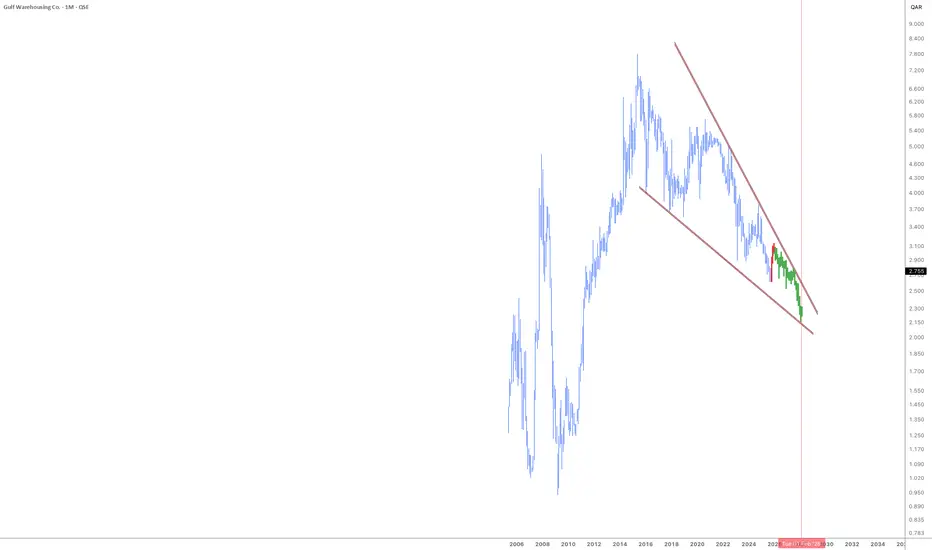
gwcsTrading is hard and it’s not something you can expect to get good at overnight. So if you’re serious about becoming a master of making money on the markets, you’re going to need some top-level schooling.
QSE:GWCSShort
by QQQQ9999
11
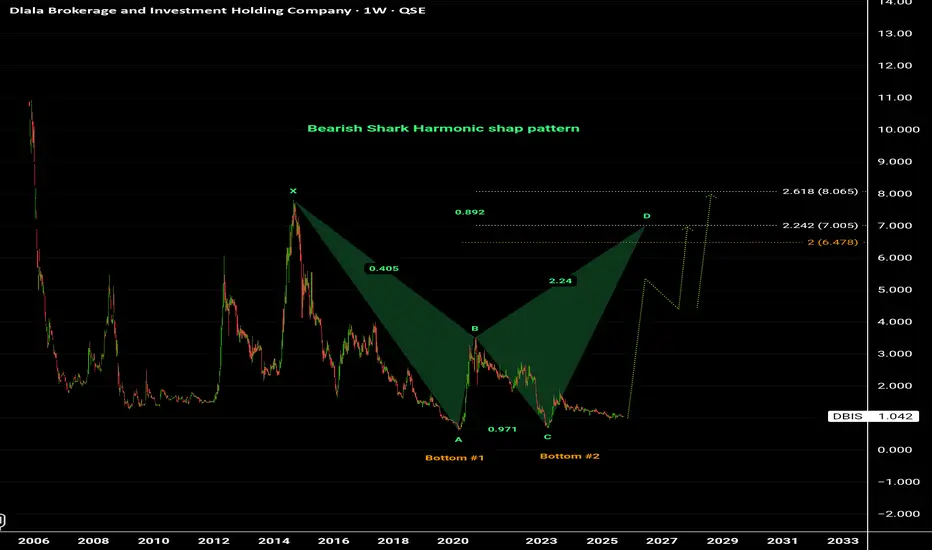
Dlala Brokerage and Investment Holding Company ( DBIS )Stock on Shark 🦈 Harmonic shap pattern that by breaking up level 3.520 will be triggered to its Target price near 7 Qr and could be more. Highly & Strongly recommended for BUY 💥
QSE:DBIS
by GNRI_Maker
44
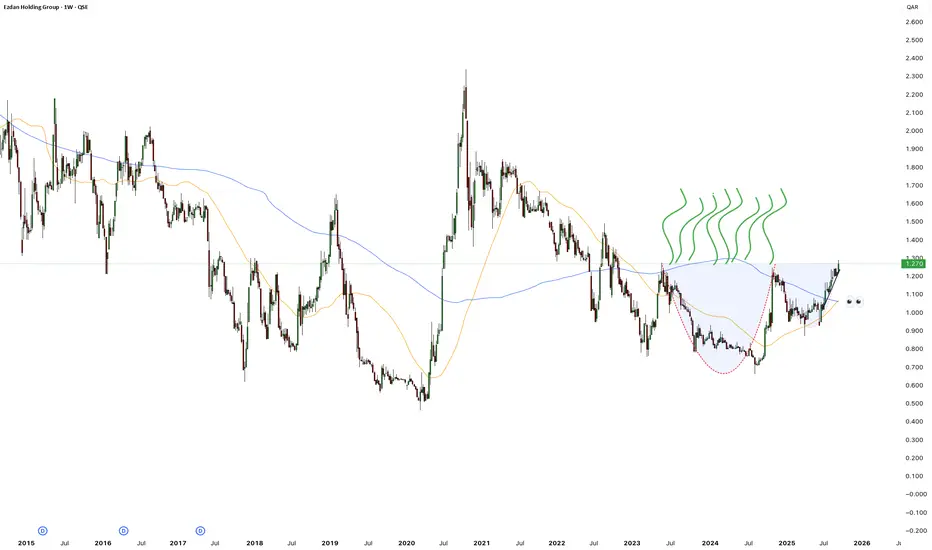
eres🔹 Chart Structure The chart shows a long downtrend since 2017, followed by a prolonged base around 0.80–1.00 QAR. Recently, the stock formed a rounded bottom (cup-like pattern), suggesting accumulation and a potential trend reversal. Price is now testing the 1.25–1.30 QAR zone, which aligns with the 200-week moving average (blue line) — a key resistance area. 🔹 Moving Averages 50-week MA (orange) has started to turn upward, showing early bullish momentum. 200-week MA (blue) remains above price but is being challenged. A confirmed golden cross (50-week MA crossing above the 200-week MA) would strengthen the bullish outlook. 🔹 Key Levels Support: 1.10–1.15 QAR (previous breakout and near the 50-week MA). Immediate Resistance: 1.30–1.35 QAR (current barrier). Next Target Zone: 1.50–1.60 QAR (cluster of past highs, marked with green arrows). Long-term Resistance: 1.80 QAR and above.
QSE:ERESLong
by QQQQ9999
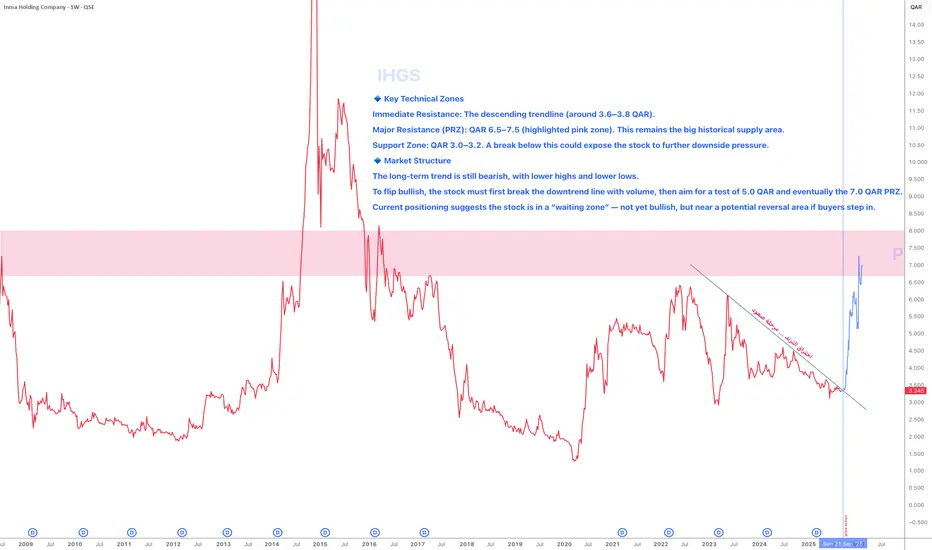
IHGS🔹 Key Technical Zones Immediate Resistance: The descending trendline (around 3.6–3.8 QAR). Major Resistance (PRZ): QAR 6.5–7.5 (highlighted pink zone). This remains the big historical supply area. Support Zone: QAR 3.0–3.2. A break below this could expose the stock to further downside pressure. 🔹 Market Structure The long-term trend is still bearish, with lower highs and lower lows. To flip bullish, the stock must first break the downtrend line with volume, then aim for a test of 5.0 QAR and eventually the 7.0 QAR PRZ. Current positioning suggests the stock is in a “waiting zone” — not yet bullish, but near a potential reversal area if buyers step in.
QSE:IHGSLong
by QQQQ9999
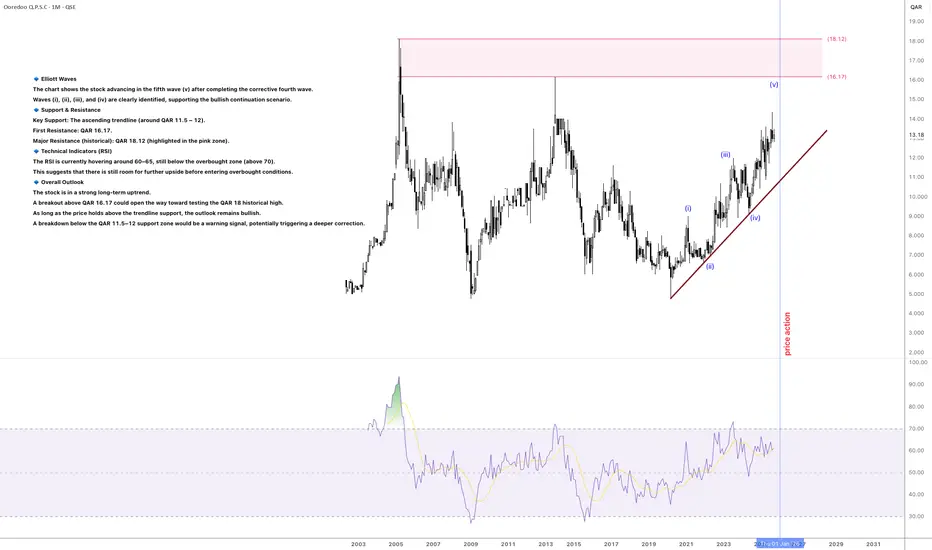
ords🔹 Elliott Waves The chart shows the stock advancing in the fifth wave (v) after completing the corrective fourth wave. Waves (i), (ii), (iii), and (iv) are clearly identified, supporting the bullish continuation scenario. 🔹 Support & Resistance Key Support: The ascending trendline (around QAR 11.5 – 12). First Resistance: QAR 16.17. Major Resistance (historical): QAR 18.12 (highlighted in the pink zone). 🔹 Technical Indicators (RSI) The RSI is currently hovering around 60–65, still below the overbought zone (above 70). This suggests that there is still room for further upside before entering overbought conditions. 🔹 Overall Outlook The stock is in a strong long-term uptrend. A breakout above QAR 16.17 could open the way toward testing the QAR 18 historical high. As long as the price holds above the trendline support, the outlook remains bullish. A breakdown below the QAR 11.5–12 support zone would be a warning signal, potentially triggering a deeper correction.
QSE:ORDSLong
by QQQQ9999
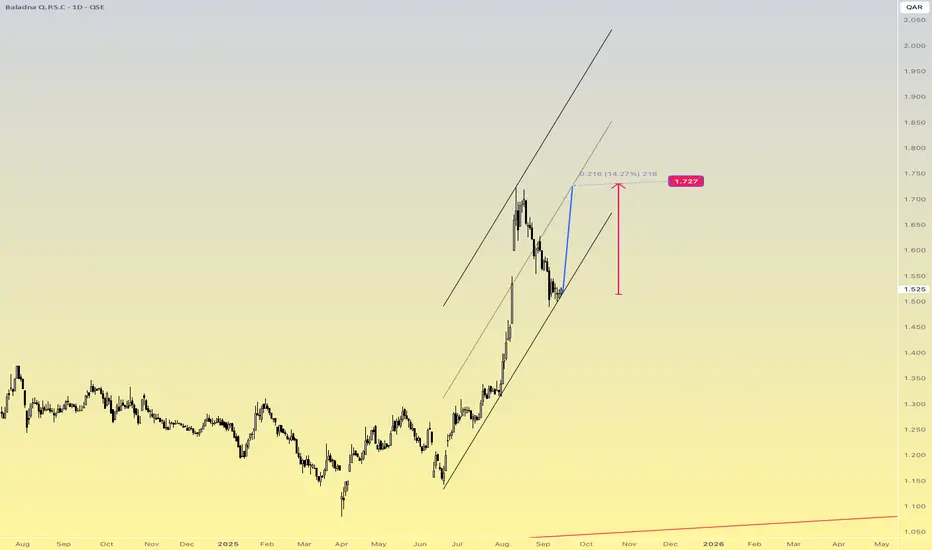
BldnTechnical Outlook Short-term bias: Rebound possible toward 1.70–1.73 QAR as long as 1.48 support holds. Medium-term bias: Bullish within the rising channel; buyers are in control if price stays above 1.35. Risk: If price breaks below 1.48, a deeper correction toward 1.35 is likely.
QSE:BLDN
by QQQQ9999
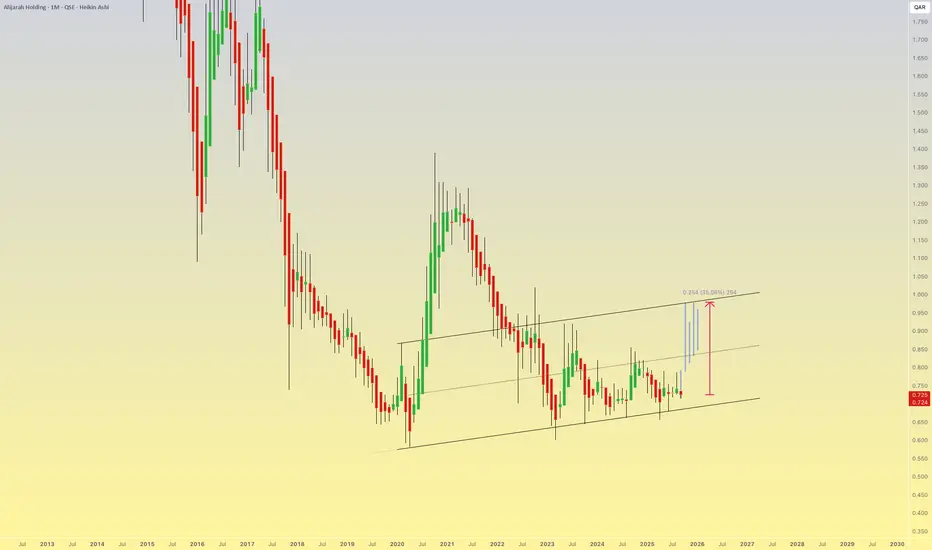
nlcs .qa[/b1. Overall Trend Since 2014, the stock has been in a long-term downtrend. However, from around 2019 it started moving within an upward price channel (support and resistance trendlines). 2. Current Setup Current price: QAR 0.724 (as of mid-September 2025). The chart shows a clear ascending channel from 2019 onwards. The stock is now approaching the upper boundary of the channel around 0.95–1.00 QAR. Projection on the chart suggests ~35% potential upside if price moves toward the top of the channel. 3. Key Levels Major Support: 0.65 – 0.68 QAR (lower channel boundary). First Resistance: 0.85 QAR. Second Resistance: 0.95 – 1.00 QAR (upper channel). Breakout above 1.00 QAR could open the way toward 1.20 – 1.30 QAR, but that would require strong volume. 4. Technical Reading Short- to medium-term bias: Positive, as long as price holds above 0.70 QAR. Long-term bias: Still weak/neutral unless price breaks and sustains above 1.00 QAR. The sideways movement inside the channel offers swing trading opportunities between support and resistance.
QSE:NLCSLong
by QQQQ9999
BLDNThe stock has a wave path and two possibilities, both of which lead to a very close rise above 2 Qatari Riyals and above very, very soon... The targets are on the chart... Good luck to all. Target prices 2.054 - 2.065 Wave either ABC or could be 12345 impulse wave ( 1st wave of only 5 waves coming ). Highly recommended for Buy 👌.
QSE:BLDN
by GNRI_Maker
22
1122334455667788991010111112121313141415151616171718181919202021212222232324242525
…999999

Made by humans

Select market data provided by ICE Data Services. Select reference data provided by FactSet. Copyright © 2026 FactSet Research Systems Inc.Copyright © 2026, American Bankers Association. CUSIP Database provided by FactSet Research Systems Inc. All rights reserved. SEC filings and other documents provided by Quartr.© 2026 TradingView, Inc.

More than a product
  • Supercharts
Screeners
  • Stocks
  • ETFs
  • Bonds
  • Crypto coins
  • CEX pairs
  • DEX pairs
  • Pine
Heatmaps
  • Stocks
  • ETFs
  • Crypto coins
Calendars
  • Economic
  • Earnings
  • Dividends
  • IPOs
More products
  • News Flow
  • Portfolios
  • Fundamental Graphs
  • Yield Curves
  • Options
  • Macro Maps
  • Pine Script®
Apps
  • Mobile
  • Desktop
Community
  • Social network
  • Wall of Love
  • Refer a friend
  • House Rules
  • Moderators
Ideas
  • Trading
  • Education
  • Editors' picks
Pine Script
  • Indicators & strategies
  • Wizards
  • Freelancers
  • Paid Spaces
Tools & subscriptions
  • Features
  • Pricing
  • Market data
  • Gift plans
Trading
  • Overview
  • Brokers
  • Brokers comparison
  • The Leap
Special offers
  • CME Group futures
  • Eurex futures
  • US stocks bundle
About company
  • Who we are
  • Space mission
  • Blog
  • Help Center
  • Careers
  • Media kit
Merch
  • TradingView store
  • Tarot cards for traders
  • The C63 TradeTime
Policies & security
  • Terms of Use
  • Disclaimer
  • Privacy Policy
  • Cookies Policy
  • Accessibility Statement
  • Security tips
  • Bug Bounty program
  • Status page
Business solutions
  • Widgets
  • Charting libraries
  • Lightweight Charts™
  • Advanced Charts
  • Trading Platform
Growth opportunities
  • Advertising
  • Brokerage integration
  • Partner program
  • Education program
Community
  • Social network
  • Wall of Love
  • Refer a friend
  • House Rules
  • Moderators
Ideas
  • Trading
  • Education
  • Editors' picks
Pine Script
  • Indicators & strategies
  • Wizards
  • Freelancers
  • Paid Spaces
Business solutions
  • Widgets
  • Charting libraries
  • Lightweight Charts™
  • Advanced Charts
  • Trading Platform
Growth opportunities
  • Advertising
  • Brokerage integration
  • Partner program
  • Education program
Look FirstLook First