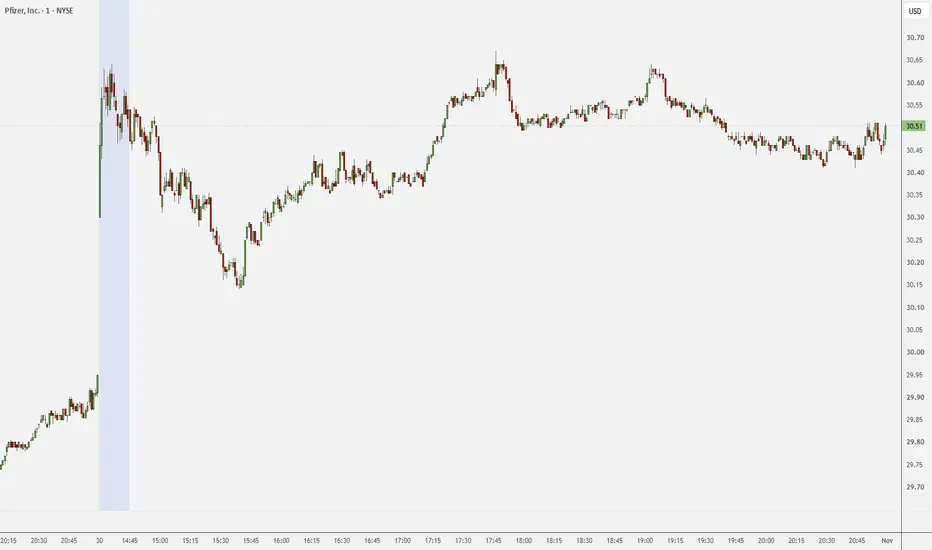
Nexus Profile Candles - Buy/Sell Volume ProfileNexus Profile Candles builds automatic volume profiles per period (day, week or month, chosen from your chart timeframe) and draws the latest one at the right of the chart as a slim candle next to a two-sided profile. Sell volume sits on the left, buy volume on the right, with a highlighted POC row and thin VAH / VAL lines on a light blue panel. Under each profile you see the buy and sell share out of 100 and the volume in contracts.
On the chart it also shows:
- Period range boxes with an open
Indicator