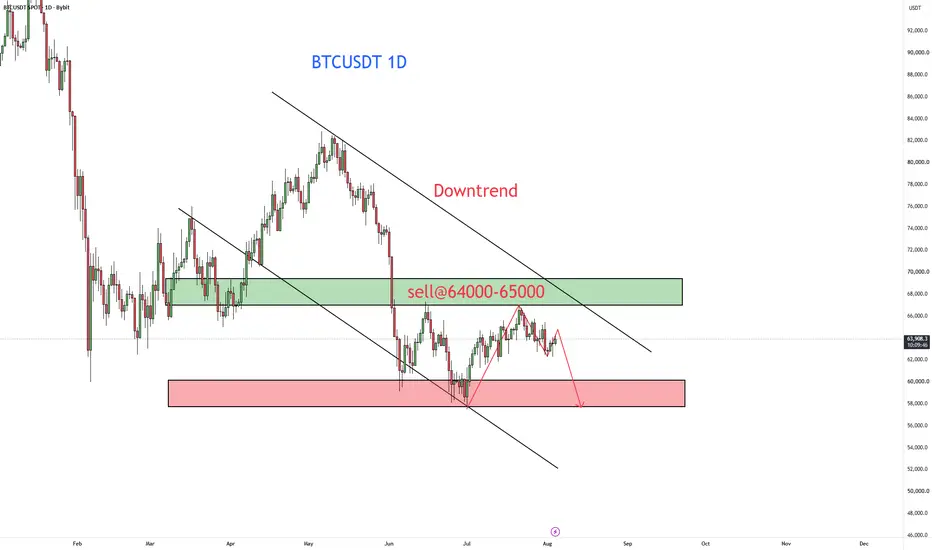
BTC: Best Short‑Selling OpportunityBTC has risen above 65K in the short term. The downtrend has weakened but is not over. In the long run, BTC remains in a downtrend; breaking below 60K is only a matter of time.
Therefore we should go short on rallies during BTC’s upward moves. It will be difficult for BTC to climb back above 70K thi
Compare with BTC/USDT
Details
Bitcoin, the first and most popular cryptocurrency, is known for its price volatility driven by institutional demand, regulations, and global events, while Tether (USDT) is widely used as a stable trading pair to avoid converting back to fiat. Together, Bitcoin and Tether play a central role in crypto markets, with Tether’s stability supporting Bitcoin trading and influencing investor behavior.
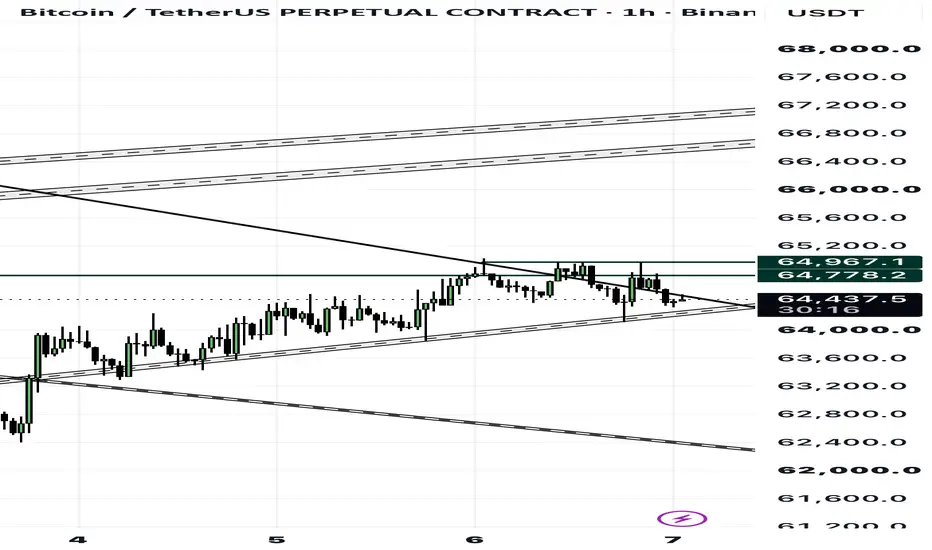
BTCUSD: Bullish Bounce Off Demand ZoneBitcoin is setting up for a potential bullish move from the 64,850–64,900 support/IDM zone.
Price is holding above support after multiple reactions from the resistance area.
📍 Entry: 64,886
🛡️ Invalidation: Below the marked support zone
🎯 Target: 65,346
The idea is to see a reaction from the supp
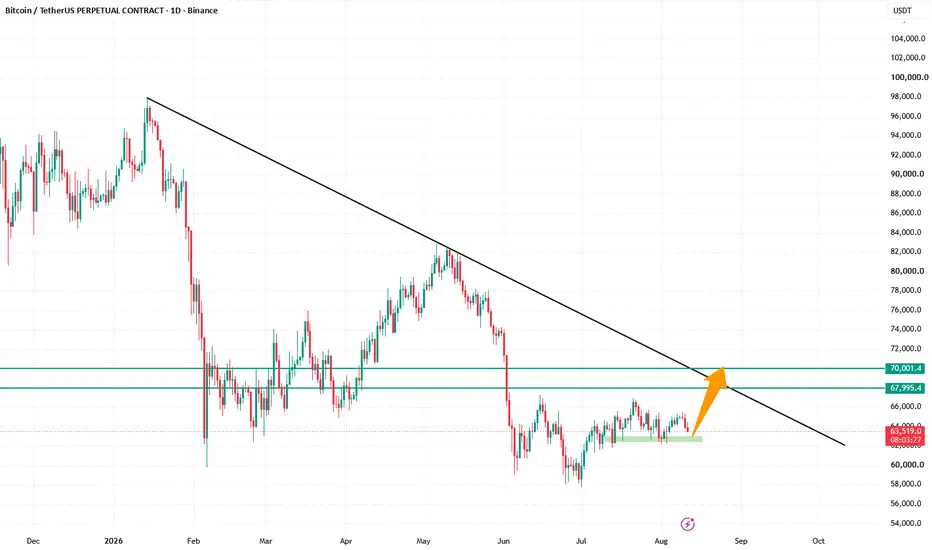
BITCOIN: THE NEXT BIG MOVE COULD START HERE!BTCUSD is approaching a strong support zone at $63,000–$62,500 , an area to watch closely for a potential buying opportunity.
📌 The setup:
🟢 Support: $63,000–$62,500
🎯 Target 1: $68,000
🚀 Target 2: $70,000 psychological resistance
If Bitcoin holds the support zone and successfully breaks the uppe
BTC: Breakdown below 60KBTC has been range‑bound for a long time and keeps trading below 65K. Its downtrend is not over yet. Any bounce higher will be a good short‑selling opportunity.
It is only a matter of time before BTC breaks down below 60K. We should open short positions at suitable zones. I consider 64K‑65K a safe s
Bearish Rejection at Resistance – Downside Move Expected
Bitcoin is trading inside a broader downtrend, with the descending trendline continuing to act as dynamic resistance. Price recently rallied into the highlighted 64,700–64,900 resistance zone, where it aligns with the previous trendline and a key supply area. This confluence increases the probabili
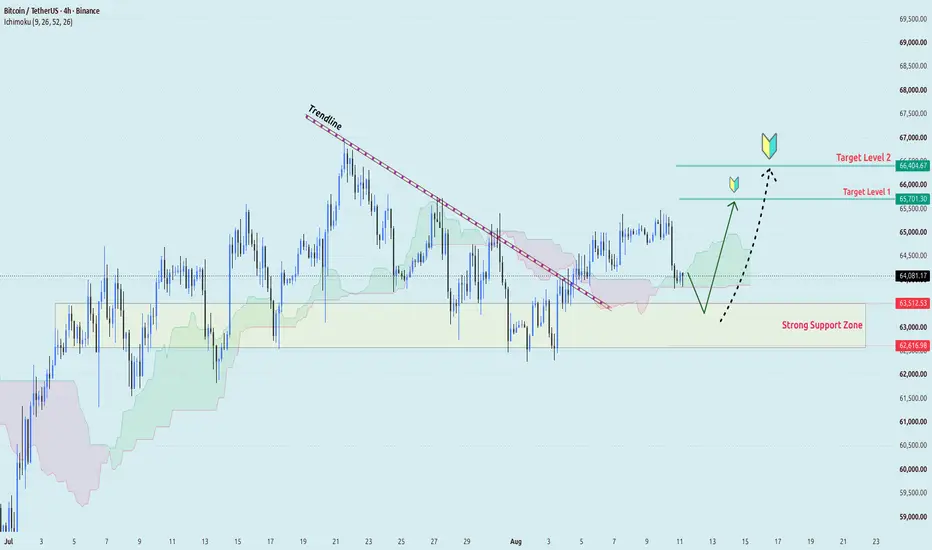
BTC/USDT - Buyers Push Higher!Hi traders, how are you viewing this pullback?
BINANCE:BTCUSDT broke out of the descending trendline and extended to the 65,000+ region, but is now retesting the breakout structure. For me, the 62,600–63,500 region is the most noteworthy area right now.
If buyers continue to defend this suppo
BTCUSDT Bearish Retest – Bears Eye 62KBTCUSDT remains under bearish pressure after rejecting a major resistance zone around 64.8K–65.2K. The recent impulsive decline confirms that sellers are still in control, while price is currently reacting from a short-term demand zone near 62.7K–62.9K.
The current bounce appears to be a relief ral
See all ideas
Summarizing what the indicators are suggesting.
Oscillators
Neutral
SellBuy
Strong sellStrong buy
Strong sellSellNeutralBuyStrong buy
Oscillators
Neutral
SellBuy
Strong sellStrong buy
Strong sellSellNeutralBuyStrong buy
Summary
Neutral
SellBuy
Strong sellStrong buy
Strong sellSellNeutralBuyStrong buy
Summary
Neutral
SellBuy
Strong sellStrong buy
Strong sellSellNeutralBuyStrong buy
Summary
Neutral
SellBuy
Strong sellStrong buy
Strong sellSellNeutralBuyStrong buy
Moving Averages
Neutral
SellBuy
Strong sellStrong buy
Strong sellSellNeutralBuyStrong buy
Moving Averages
Neutral
SellBuy
Strong sellStrong buy
Strong sellSellNeutralBuyStrong buy
Displays a symbol's price movements over previous years to identify recurring trends.
Frequently asked questions
The current price of Bitcoin / Tether Spot (BTC) is 64,186.5 USDT — it has risen 0.60% in the past 24 hours. Try placing this info into the context by checking out what coins are also gaining and losing at the moment and seeing BTC price chart.
Bitcoin / Tether Spot price has risen by 1.33% over the last week, its month performance shows a 0.80% increase, and as for the last year, Bitcoin / Tether Spot has decreased by −45.89%. See more dynamics on BTC price chart.
Keep track of coins' changes with our Crypto Coins Heatmap.
Bitcoin / Tether Spot (BTC) reached its highest price on Oct 6, 2025 — it amounted to 126,100.0 USDT. Find more insights on the BTC price chart.
See the list of crypto gainers and choose what best fits your strategy.
Bitcoin / Tether Spot (BTC) reached the lowest price of 8,900.0 USDT on Mar 18, 2024. View more Bitcoin / Tether Spot dynamics on the price chart.
See the list of crypto losers to find unexpected opportunities.
The safest choice when buying BTC is to go to a well-known crypto exchange. Some of the popular names are Binance, Coinbase, Kraken. But you'll have to find a reliable broker and create an account first. You can trade BTC right from TradingView charts — just choose a broker and connect to your account.
Crypto markets are famous for their volatility, so one should study all the available stats before adding crypto assets to their portfolio. Very often it's technical analysis that comes in handy. We prepared technical ratings for Bitcoin / Tether Spot (BTC): today its technical analysis shows the sell signal, and according to the 1 week rating BTC shows the sell signal. And you'd better dig deeper and study 1 month rating too — it's neutral. Find inspiration in Bitcoin / Tether Spot trading ideas and keep track of what's moving crypto markets with our crypto news feed.
Bitcoin / Tether Spot (BTC) is just as reliable as any other crypto asset — this corner of the world market is highly volatile. Today, for instance, Bitcoin / Tether Spot is estimated as 0.93% volatile. The only thing it means is that you must prepare and examine all available information before making a decision.
You can discuss Bitcoin / Tether Spot (BTC) with other users in our public chats, Minds or in the comments to Ideas.