Bitcoin 10X LONG —PP: 870% (Last 2026 chance to buy low)Good morning my fellow Cryptocurrency trader, I hope you are having a wonderful day. This is a friendly reminder, the last call; the consolidation and bullish accumulation period is reached its end.
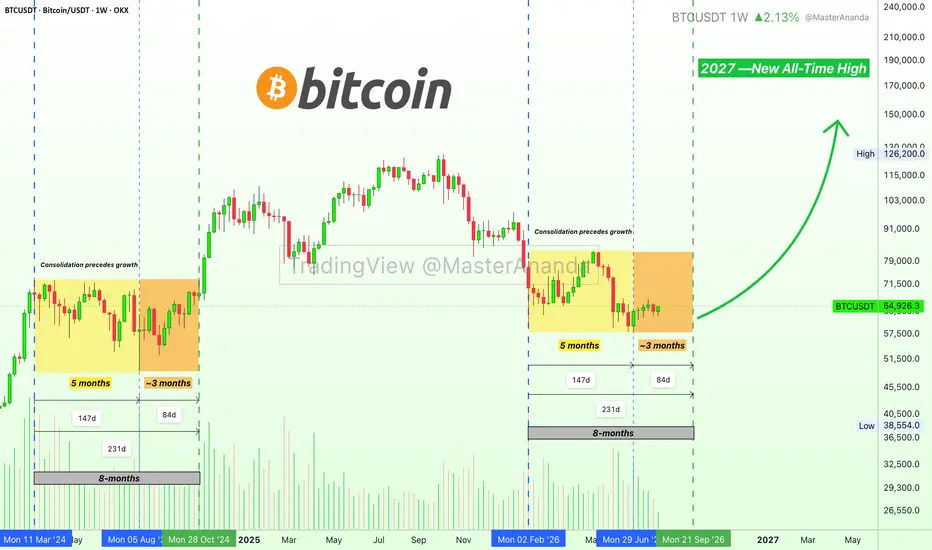
Bitcoin has been consolidating for exactly six months and there isn't any more time to wait—the time is now to take action.
I will do an extended update on this chart but you can see the theme, it works for our trade. The same pattern from 2024 is being repeated, this can lead to massive growth. It is possible to see an entire year of sustained bullish action.
Keep in mind, the market is always changing. Instead of three months bullish then a correction and all the classics repeated over and over again, Bitcoin can change. It can grow gradually for months, never moving back down.
There can be strong variations on the size, shape and duration of the rising wave. The only possibility now is higher prices—the bears are gone. It is the best possible.
Here you have a set of trade-numbers with 10X lev. Just buy and hold, the market takes care of the rest. (Taking profits should be considered only after 80K—higher is better... much higher).
_____
LONG BTCUSDT
Leverage: 10X
Potential: 870%
Allocation: 3%
Entry zone: $60,000 - $65,000
Targets:
1) $68,300
2) $73,950
3) $83,120
4) $89,650
5) $97,500
6) $107,111
7) $112,800
8) $121,250
Stop: Close monthly below $59,000
_____
Thank you for reading.
If you enjoy the content, make sure to follow.
Namaste.
In-depth trading ideas
BTCUSDT Short: Faces Descending Channel – Pullback to $63,400?Hello traders! Here’s my technical outlook based on the current BTCUSDT (3H) chart structure. BTCUSDT previously declined inside a descending channel before rebounding from the long-term ascending demand line. Price later formed another descending channel, where buyers successfully defended the 63,400 Demand Zone and pushed the market higher.
Currently, BTCUSDT is trading below the 65,800 Supply Zone while holding above the 63,400 Demand Zone and the rising demand trendline. Price is now testing the upper boundary of the descending channel.
As long as BTCUSDT remains below the 65,800 Supply Zone and channel resistance, the bearish scenario remains valid. A rejection could send price back toward the 63,400 Demand Zone (TP1). However, a breakout above resistance would weaken the bearish outlook. Manage your risk!
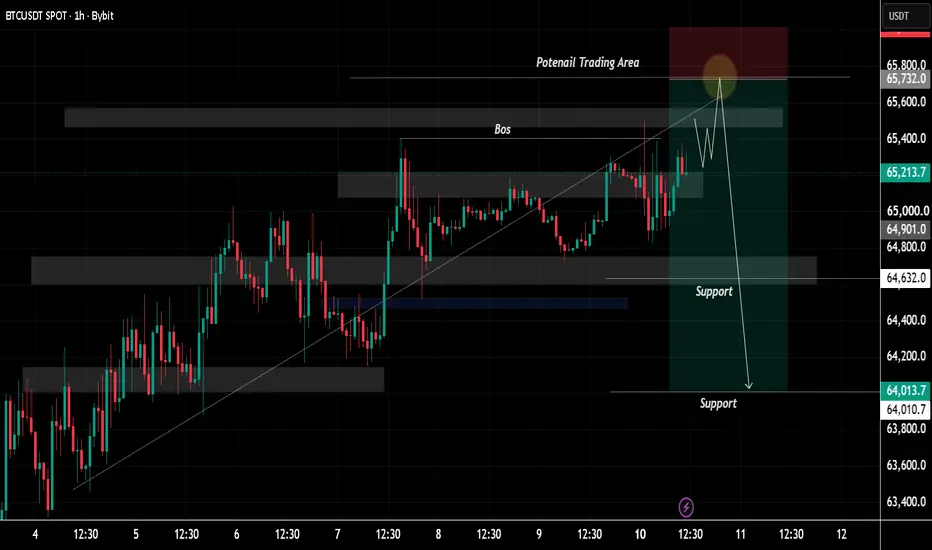
Bitcoin Price Update – Clean & Clear ExplanationBitcoin is currently trading around $65,240 and remains in a short-term bullish structure, but price is approaching a major resistance and liquidity zone around $65,600–$65,800.
The recent Break of Structure (BOS) shows that buyers have maintained control, while the rising trendline and higher-low formation continue to support the bullish momentum. However, after the recent upward move, BTC may first push toward $65,600–$65,800 to collect liquidity above the recent highs before facing strong selling pressure.
If price reaches this area and fails to break and hold above 65,800, we could see a sharp rejection as sellers enter from the supply zone. In that case, BTC may move back toward 65,400 65,000 / 64,900, followed by the important support around 64,632. If 64,632 breaks with a strong 1H candle close, the bearish pressure could increase and price may extend toward the 64,000 / 64,014 support zone.
On the other hand, if buyers manage to break 65,800 with strong volume and successfully hold above it, the bearish rejection setup would become weaker and BTC could continue toward higher levels. Therefore, 65,600 / 65,800 is the key decision zone. The reaction from this area will determine whether Bitcoin continues its bullish move or starts a deeper correction.
Overall bias: Bullish structure, but a possible liquidity sweep/rejection near 65,700 / 65,800 could trigger downside toward 64,632 / 64,014. Always wait for candle confirmation around these key levels rather than entering purely on the projected path.
our support means a lot! If you found this analysis useful, leave a Like and tell me your thoughts in the comments. Best of luck with your trading journey! 🚀
Bitcoin Breaks Descending Channel: Is $66,000 the Next Target?Bitcoin ( BINANCE:BTCUSDT ) has successfully broken above the Descending Channel and the key trading level of $64,000.
Over the past 24 hours, BTC has been fluctuating inside a small Ascending Channel as traders remain uncertain about the next major direction.
Can Bitcoin maintain its bullish structure and break above the Resistance Zone?
Technical Analysis
Bitcoin’s choppy price action reflects market indecision about whether the current bullish trend can continue.
However, the breakout above the Descending Channel and $64,000 supports the bullish scenario as long as the price remains above the Ascending Channel support line.
💡 Educational Note: A small Ascending Channel after a major breakout can represent a continuation structure, but a breakdown below its lower trendline may signal weakening bullish momentum.
I expect Bitcoin to continue moving higher, break above the Resistance Zone, and make another attempt to test the Resistance Lines.
Trade Setup
First Take Profit(TP): $65,930
Second Take Profit(TP): $66,460
Stop Loss(SL): $63,480
Which level do you think Bitcoin will reach first?
🟢 $66,460
🔴 $63,480
📌 Bitcoin Analysis(BTCUSDT), 1-hour time frame.
🛑 Always use proper risk management and set a Stop Loss(SL) for every position.
🚀 If this analysis helps your trading plan, a BOOST would help more traders discover it.
BTCUSDT: Sellers Step In — 63,800 Support Zone Becomes TP1Hello everyone, here is my breakdown of the current BTCUSDT setup.
Market Analysis
BTCUSDT previously traded inside a broad range before breaking higher and entering a descending channel. Price has repeatedly faced rejection near the 65,400 Resistance Zone, while the 63,800 Support Zone continues to act as a key downside level.
Currently, BTCUSDT is trading below the 65,400 Resistance Zone while holding above the 63,800 Support Zone. The latest rejection near resistance suggests that sellers are attempting to regain control.
My Scenario & Strategy
As long as BTCUSDT remains below the 65,400 Resistance Zone and respects the descending channel, the bearish scenario remains valid. A rejection from current levels could push price toward the 63,800 Support Zone (TP1).
However, a breakout above the 65,400 Resistance Zone would weaken the bearish outlook and increase the risk of a move toward higher levels.
That’s the setup I’m tracking. Thank you for your attention, and always manage your risk.
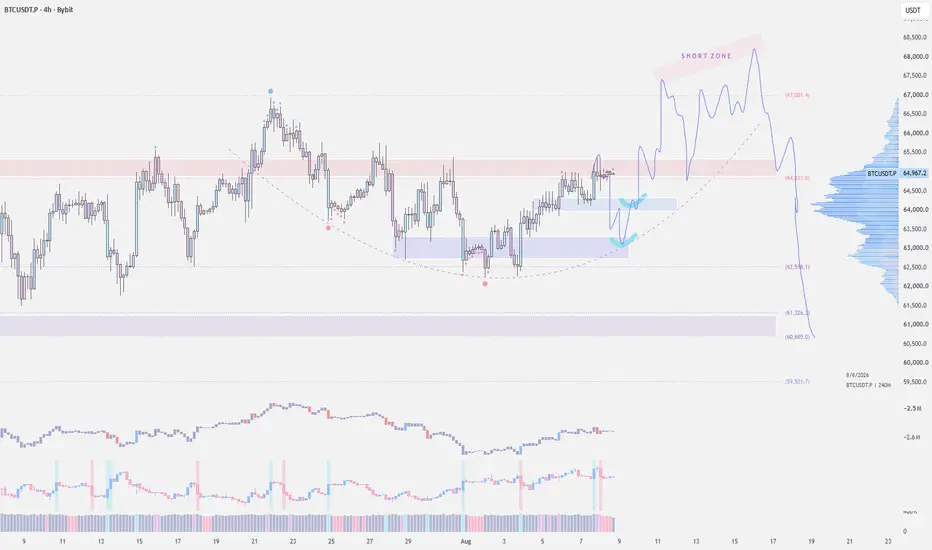
BITCOIN: Price accumulated successfully! Strong Distribution! Bitcoin/USDT is showing signs of a developing bullish recovery after buyers successfully defended the key $60,000–$62,000 demand zone.
The price has regained $64,000 and is currently consolidating beneath the immediate $65,500–$65,800 resistance zone. This structure suggests buyers are gradually absorbing available supply while sellers struggle to sustain a breakdown.
Overall, the bias is bullish.
Technical Structure:
Bitcoin reached a significant low near $57,500 before recovering above the psychological $60,000 level. Subsequent pullbacks have consistently attracted demand around $60,000–$62,000. The latest reaction formed a higher low near $62,600, indicating weakening selling pressure.
BTCUSDT has since reclaimed the $64,000 area and is testing the upper boundary of its short-term consolidation. A confirmed breakout above $65,800 would establish a new four-hour higher high and strengthen the case for continued recovery.
Reasons for the Strengthening Bullish Setup:
- Buyers continue to defend the $60,000–$62,000 demand zone.
- The latest pullback produced a potential higher low.
- The price has reclaimed the important $64,000 level.
- Recent retracements have remained relatively controlled.
- Bitcoin is consolidating directly beneath resistance.
- Repeated tests of $65,500 could weaken remaining supply.
- A breakout above $65,800 would confirm bullish continuation.
Important Resistance Levels:
- $65,500–$65,800: Immediate breakout zone.
• $67,000: First major upside objective.
Resistance and Support Levels:
* $68,500–$69,500: Higher-timeframe resistance and moving-average region.
* $72,000: Major continuation target.
* $78,000: Extended bullish recovery objective.
Important Support Levels:
* $64,500–$64,000: Immediate demand and breakout support.
* $62,600–$62,000: Major higher-low region.
* $60,000: Psychological and structural support.
* $57,500: Broader bullish invalidation region.
Bullish Targets:
* TP1: $65,800
* TP2: $67,000
* TP3: $68,500
* TP4: $69,500
* Extended targets: $72,000 and $78,000
Bullish Trading Scenario:
The preferred bullish scenario is a confirmed four-hour close above $65,800 followed by a successful retest of the breakout area.
If former resistance becomes support, buyers could target $67,000 before extending the recovery towards the crucial $68,500–$69,500 region.
A daily close above $69,500 would signify a stronger structural breakout, potentially generating sufficient momentum for an advance towards $72,000. Continued acceptance above that level would focus attention on the extended $78,000 objective.
Alternatively, a controlled pullback into $64,500–$64,000 could offer another bullish continuation structure if price produces a clear rejection candle or forms a higher low.
Fundamental Bullish Case:
The fundamental bullish case hinges on several key factors.
The latest US employment report revealed a decline in nonfarm payrolls by 23,000, with previous months’ figures revised downwards. This deterioration in employment growth could dampen expectations for further Federal Reserve tightening.
A less restrictive interest-rate outlook generally supports market liquidity and risk-sensitive assets like Bitcoin.
Despite geopolitical uncertainty and negative market headlines, Bitcoin has demonstrated resilience, maintaining a price around $64,000–$65,000. This suggests that significant selling pressure may have already been absorbed.
The next key catalyst is the US Consumer Price Index release. Softer inflation could further reduce expectations for tighter monetary policy, potentially propelling BTCUSDT above resistance.
Risk and Invalidation
A daily close below $62,000 would weaken the current bullish structure, indicating buyers are losing control of the recent higher-low region.
A sustained breakdown below $60,000 would invalidate the primary bullish recovery thesis, exposing the broader $57,500 support level.
The bullish outlook remains valid as long as BTCUSDT maintains acceptance above the $62,000–$60,000 support structure.
Conclusion
BTCUSDT is transitioning from accumulation to a bullish recovery.
The repeated defence of $60,000–$62,000, potential formation of a higher low and recovery above $64,000 collectively support a bullish bias.
The most crucial confirmation would be a four-hour close above $65,800. Such a breakout could pave the way for $67,000, followed by the major $68,500–$69,500 target region.
Bias: Bullish
Immediate support: $64,500–$64,000
Bullish confirmation: Above $65,800
Primary target: $69,500
Extended targets: $72,000 and $78,000
Short-term invalidation: Below $62,000
Major invalidation: Below $60,000
If you like our work then like and comment also do follow for more trading ideas.
The Setupsfx_ Team
BTCUSDTHello Traders! 👋
What are your thoughts on Bitcoin ?
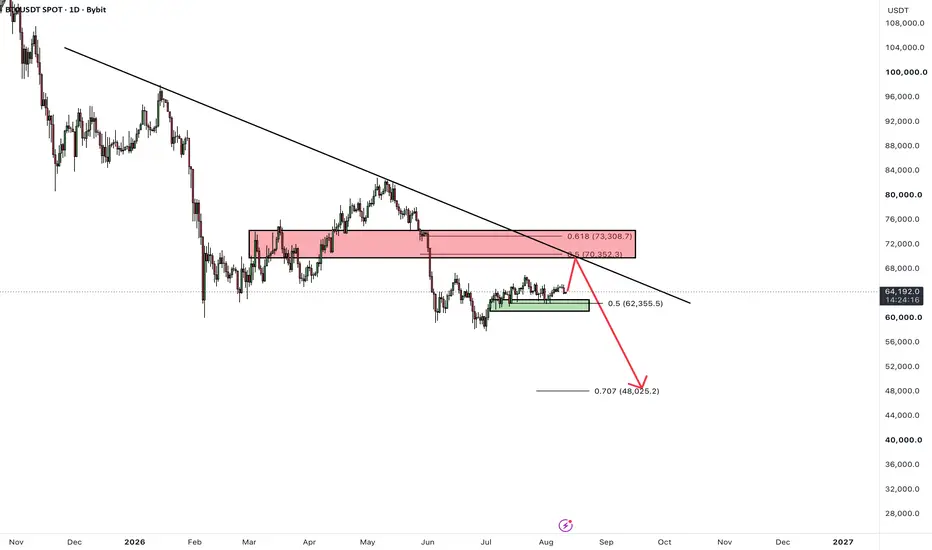
Bitcoin continues to trade within a broader bearish structure, with price still below the well-defined descending trendline.
However, over the past two months, price has mainly been moving within a trading range, experiencing several back-and-forth swings. After reaching the $58,000 area, Bitcoin found support and rebounded from this zone.
At the moment, this corrective move is expected to continue toward the key resistance zone highlighted on the chart. This area contains several important technical resistance factors, with the 0.5 and 0.618 Fibonacci retracement levels located within the zone and the descending trendline also converging around the same area.
This technical confluence could turn the zone into a strong supply and resistance zone. As Bitcoin reaches this zone, we expect a rejection and the development of the next bearish leg, potentially pushing price toward the $48,000 target area.
As long as price fails to break and hold above the descending trendline and the key resistance zone, the bearish scenario remains the dominant outlook.
If you found this analysis helpful, please support it with a like and share your thoughts in the comments! Good luck with your trades!❤️
Bitcoin - Is the low in?Bitcoin has been showing continued weakness after failing to reclaim higher levels and losing important support zones. Price is currently consolidating around the $64k area after a strong rejection from the previous highs, with momentum still favoring the bears. The overall market structure remains bearish, with lower highs and lower lows forming on the higher timeframes. For now, Bitcoin needs to reclaim key resistance levels to shift the momentum back in favor of buyers.
Daily FVG Resistance
Above the current price action, there is a clear Daily Fair Value Gap sitting around the $68k–$70k region. This area represents a strong resistance zone where sellers could step back in if Bitcoin manages to push higher. The previous rejection from this imbalance shows that there is still significant selling pressure overhead. A move into this FVG would likely act as a relief rally rather than a confirmed trend reversal unless Bitcoin can break and hold above it.
Bear Market
The current structure continues to resemble a bear market phase, with price trading below major resistance levels and failing to create strong bullish continuation. After the rejection from the $80k+ area, Bitcoin has been steadily moving lower, showing weakness on every attempt to recover. The inability to reclaim previous highs suggests that buyers are struggling to regain control. Until Bitcoin breaks above key resistance zones, the broader market structure remains bearish.
Downtrend
Bitcoin remains inside a clear downtrend, characterized by lower highs and weak price action. Every bounce has been met with selling pressure, preventing a sustained recovery. The current consolidation around $64k could either become a base for a reversal or a continuation pattern before another move lower. A break below the current support area would likely open the door toward lower levels as the downtrend continues.
Final Thoughts
Bitcoin is currently sitting in a critical area, but the overall bias remains bearish while price stays below the Daily FVG resistance. A move higher into the $68k–$70k zone could happen as a relief bounce, but this area is expected to attract sellers. If Bitcoin fails to reclaim this resistance and loses the current support, we could see another leg lower in the ongoing downtrend. For now, patience is key until Bitcoin shows clear signs of strength and a break in market structure.
A Good Setup at the Wrong Time Is a Bad Trade Image this: you find the perfect setup.
Trend aligned.
Support holding.
Confirmation appears.
But there’s one thing traders often forget:
Timing.
The same setup can behave very differently:
During an active trading session.
Versus...
10 minutes before major economic news.
Or when liquidity is extremely low.
Technically, the setup may look identical.
The environment isn't.
📌Thus, before entering, check two things:
1. Is the setup valid?
2. Is this a good time to trade it?
If either answer is no...
Wait.
Remember
A setup tells you WHAT to trade.
Timing tells you WHEN to trade it.
You need both.
⚠️ Disclaimer: This is not financial advice. Always do your own research and manage risk properly.
📚 Stick to your trading plan regarding entries, risk, and management.
Good luck! 🍀
All Strategies Are Good; If Managed Properly!
~Richard Nasr
HERE IS BTC/USDT POSIBLE BULLISHHERE IS BTCUSDT POSIBLE BULLISH
Bitcoin is developing a constructive recovery structure after finding strong demand near the 58,000–60,000 region. Since the July low, price has been forming higher lows along a rising trendline, while gradually reclaiming higher levels. This indicates that buyers are building momentum and attempting to reverse the previous bearish phase.
Price is currently consolidating beneath the Ichimoku Cloud, making the cloud a key decision zone. A confirmed daily breakout above the cloud would provide stronger bullish confirmation and could accelerate the recovery toward the 69,000 resistance, followed by the 72,000 resistance zone. As long as BTC continues to respect the rising trendline and the 61,000 support area, the bullish structure remains valid.
If the Bullish Structure Holds
🟢 1st Resistance: 69,000.00
🟢 2nd Resistance: 72,000.00
🔴 Primary Support: 61,000.00
🔴 Major Support: 60,000.00
Market Structure Insight
The formation of higher lows above the ascending trendline suggests improving buying pressure. A sustained breakout above the Ichimoku Cloud could confirm a broader bullish continuation and open the path toward the higher resistance levels.
⚠️ Disclaimer: This analysis is for educational purposes only. Always wait for confirmation before entering a trade and apply proper risk management in all market conditions.
Bitcoin - Bullish Breakout Setup | $67.5K → $69K NEXT?Bitcoin is showing a strong technical structure on the 4H chart, with price breaking above the descending trendline and holding above the key support area. The recent BOS/CHoCH market-structure shift suggests buyers are gaining control, while the rising trendline continues to support the bullish setup. BINANCE:BTCUSDT
If BTC continues to hold above the breakout area and maintains bullish momentum, the next liquidity/Key Zone around $67.5K could become the first major upside objective, followed by the $69K resistance zone.
Invalidation: A strong breakdown below the $62.1K–$62.8K Key Zone would weaken the bullish structure and could signal a deeper correction.
What do you think — BTC $69K next, or will sellers defend the upper zone?
Like /Comment/Follow for more technical setups .
Disclaimer: This analysis is for educational and informational purposes only.
BTC Breaks Above Descending Trendline – Is 65,7K the Next Aim?Hello traders! Here’s my technical outlook based on the current BTCUSDT (1H) chart structure. BTCUSDT previously broke above the long-term descending trendline before entering a recovery phase. After consolidating inside a range, price formed a rising channel and continues to respect its ascending support line, showing that buyers remain in control. Currently, BTCUSDT is trading above the 64,200 Buyer Zone while remaining below the 65,700 Seller Zone. The latest rebound from support suggests bullish momentum is building as price continues to hold above the previous breakout level. As long as BTCUSDT stays above the 64,200 Buyer Zone and respects the channel support, the bullish scenario remains valid. A continuation higher could push price toward the 65,700 Seller Zone (TP1). However, a break below 64,200 would weaken the bullish outlook and increase the risk of a deeper pullback. Please share this idea with your friends and click "Boost" 🚀
Bitcoin this week will pump above 67K or strong dump will cookThis week, Bitcoin will either pump above 67K or experience a strong dump. The reason is that 67K is a major resistance zone and also aligns with the neckline of an inverse Head and Shoulders pattern. If this resistance holds, the market may range or dump. If a breakout to the upside occurs and the right shoulder completes, a rally toward 80K is expected.
Let’s break down what is happening on the Bitcoin chart this week. Price is approaching a critical level at 67K, and how it reacts here will determine the next major move.
Learn this: 67K is not just a random number. It is a strong resistance zone that has rejected price multiple times in the past. It is also the neckline of an inverse Head and Shoulders pattern that is currently forming. When a key resistance level aligns with a pattern neckline, that zone becomes even more significant. A break or rejection there will likely lead to a strong move.
If price fails to break above 67K and gets rejected, the market could enter a boring range or even dump lower. That means the resistance remains valid, and sellers are still in control.
However, if Bitcoin manages to break above 67K with strong volume, that would complete the inverse Head and Shoulders pattern. The right shoulder would be confirmed, and the measured move from the pattern would project price toward 80K.
Learn this : An inverse Head and Shoulders is a bullish reversal pattern. When price breaks above the neckline, it signals that the downtrend is over and a new uptrend is beginning. The target is calculated by measuring the distance from the head to the neckline and projecting that same distance upward from the breakout point.
BTCUSDT Long: Rising Trend Line Supports Move Toward $66KHello traders! Here’s my technical outlook based on the current BTCUSDT (4H) chart structure. BTCUSDT previously traded inside a descending channel before breaking above resistance and shifting bullish. After the breakout, price continued to form higher lows while respecting the rising trend line.
Currently, BTCUSDT is trading below the 66,000 Supply Zone while holding above the 64,200 Demand Zone and ascending trend line. The recent consolidation suggests buyers are preparing for another attempt higher.
As long as BTCUSDT holds above the 64,200 Demand Zone and respects the rising trend line, the bullish scenario remains valid. A continuation higher could push price toward the 66,000 Supply Zone (TP1). However, a break below 64,200 would weaken the bullish outlook. Manage your risk!
Bitcoin rejected momentum downside Pressure Bitcoin is currently trading inside a strong resistance zone after a solid recovery from recent lows. Buyers have pushed the price higher, but the market is now struggling to break above the 65K area, where heavy selling pressure has returned. This suggests that bulls are losing momentum while sellers are becoming more active.
The current price reaction is driven by a combination of technical resistance, profit-taking by short-term traders, and cautious market sentiment. Many investors are waiting for fresh economic or crypto-related catalysts before opening new positions. At the same time, a stronger US Dollar or risk-off sentiment across financial markets can also limit Bitcoin's upside and encourage sellers to step in.
Resistance: 65,200 / 65,500
Support 1: 63,600 / 62,400
As long as Bitcoin remains below the 65.2K / 65.5K resistance zone, the market favors a pullback or consolidation. However, if buyers manage to break above this resistance with strong volume, the bearish setup would weaken and the next bullish leg could begin.
The Bear Market's Last Stop: SeptemberYou Asked. Here's Exactly What I Hold.
You sent me a stack of questions this week. I'll answer them straight, with my real orders and my real levels, not a highlight reel.
First, the honest part: am I profitable, and how do I trade
I've been in these markets for 13 years, and I did not turn profitable right away. My win rate is not 100%. If I'm honest, on plenty of setups it sits below 50%, same as most people. Start from that truth. You will be wrong often. Make peace with it as your baseline.
Everything I write here is my opinion, nothing more. Agree or don't, that's fine by me. These questions came to me directly, so I'm answering them directly.
If your win rate is around 50% or under, you can still make money. Two ways. Either your risk to reward is high enough to cover a low hit rate, or you narrow down to the specific setups where you know you perform. Everyone is different. Different psychology, different relationship with risk. So learn your weak sides and your strong sides.
Here is the exercise that fixed my discipline. I went back and studied my single best trade, the one with the biggest and most comfortable profit I can remember. It was the second most profitable trade of my life. The rule behind it was simple. Hold the winners as long as possible, and cut the losers as fast as possible. That is the whole edge.
And set a stop before you enter. For me that stop is a fixed dollar figure, decided before I click buy. I think about it in money, not in percentage of the move.
Trading is one of the hardest professions there is. What carries you is the boring work: knowing yourself, reviewing your own trades, and sticking to a plan. Call it discipline. That is exactly how I've traded this market. Very few positions, limit orders left working, no rush to force anything. Some of those orders filled, and I'll get to them below.
The entry model I use for continuation trades
Honest answer: trend continuation is not where I'm most comfortable. But one thing is always fixed first. Before any trade, I know exactly how many dollars I'm risking on the stop. Start there and the rest falls into place. Your risk defines your position size. Your position size and stop define where your entry has to be. It all begins with how much you're willing to lose.
When I do take continuation, I like entering after a liquidity sweep, into the zone where price is set up to keep going. I publish a fair number of indicators, and some of the free ones I use myself mark those zones of interest for entries. The higher the timeframe, the cleaner they read. That's the manual side. This year I also put a lot of work into automated trading, with different strategies and different logic. You can dig into those where they're documented.
You were warned, and I'll keep warning you
I've said it many times: a bear market was coming. I said it before, I'm saying it now, and I'll keep saying it. I even gave dates, the month and the window it runs into. We're almost there. September 2026 is close, and that's the timing I've been pointing at all along. You can go back and read where I called it here:
That is why I've stayed patient through all of this. Very few trades, orders left working at my levels, no need to prove anything to the market in the meantime.
Bitcoin: when and where I start buying
I already published the zone. Here is the exact post where I show where DCA makes sense:
Where I stand personally: I've already bought half the size I planned, a little under $60k. The second tranche sits lower and only fills if we get there. I'm not trying to nail the exact bottom. I just don't want to be caught with no Bitcoin in my portfolio, and I already hold a solid amount. On the chart you'll see the zone marked with the circle. That band is your DCA area, and right now is a good time to be working it.
The full plan I laid out earlier. I share it, though not publicly. The community that wants that level of detail gets it.
Ethereum: is there still more downside
Ethereum is the number two asset in the whole industry, so people watch it closely. I already have a fill here. My limit order at 1590 triggered, the one I've flagged many times before. Right now that trade is up about 16%. As of today, August 4, 2026, I'm not closing it.
Can we still go lower? Yes. I won't rule out a move under $1,000. But I'll be straight with you, I don't have a second limit order down there. One entry, and I'm holding it.
Altcoins: what I'm buying into the final correction
Start with the frame. Altcoins are the highest-risk asset class in any financial market, full stop. My base case is that most alts eventually get dragged higher with the market. I keep a list with size allocated to each name, and I tried to pick coins that at least won't die on me. Nobody is insured against that, but that was the filter.
Since you asked, here is what I actually hold orders on: ONDO, TON, SOL (only at very low levels, think 50% or more below the current price), LINK, PYTH, ICP, NEAR, and even BCH. BCH is probably a mistake, but it is what it is. I do not hold HYPE. I think I missed it, and I'm not comfortable chasing it on a rising market. I also had Worldcoin (WLD) on a limit, but I pulled the order after it ran up without tagging my level, missed by a hair.
On the specific portfolios you sent me:
For the 60% into SOL between $50 and $60, that's your call, but for my own orders I'm waiting even lower, closer to 50% below the current price.
For the 20% into NEAR, ONDO and HYPE, understand these are all high-risk names. Fine as a small deliberate bet, not as a core holding.
On ADA, I count about five red flags. My call: Cardano needs a rebrand first, and only after that do we get a real leg up.
Going name by name on the beginner list, DOGE, BANK, HYPE, ENA, APT, ZAMA:
- DOGE: maybe. It's really a bet on Elon. He has plenty of other tools to move markets, so I wouldn't lean on it. If you believe he'll pump it again one day, that's your call.
- BANK: no.
- HYPE: maybe.
- ENA: I've wanted it for a while and I might still take it. It's not in my limit orders yet, but the price is getting attractive.
- APT (Aptos): I'd wait until the early-investor unlocks are done selling. Until then I don't expect much. I caught one trade, took it, and moved on.
- ZAMA: I don't have much to say here. These are mostly the names that are loud right now. I already told you the ones I actually have orders on. Again, high risk, and honestly you shouldn't lean on me for these picks.
Forecasts you asked for, XRP, SOL, Monero, Zcash:
- XRP: the most conspiracy-heavy coin on the market. My view holds, lower, and back under a dollar.
- SOL: also lower before it's worth buying.
- Monero: as regulation closes in, a chunk of the market does not want its money visible. Privacy coins are the natural hedge for that demand, and you can see Monero getting bought on exactly that thesis. I expect it stays volatile and stays bid.
- Zcash: same story on the demand side. I don't hold it. I have nothing to hide, and as a pure trade the time to buy was near 20, not 400 or 500 a coin. So it doesn't make my list.
The long game: BTC, ETH, gold, silver
Bitcoin. My entry view is already on the record. Half my position is bought, a bit under $60k, with a second entry lower for averaging, so I don't lie awake over buying too early or too late. On the upside, by the end of the next cycle I expect at least $160k. So ask yourself the real question: are you willing to hold roughly three years for that kind of return? To me that is a great trade. If you just want to make money and keep your life simple, buy spot Bitcoin, hold it, and go do other things.
Ethereum, long term. I don't love making this kind of call. Most of the market has $10,000 flashing in their heads. I have real doubts. My honest expectation is that Ethereum stagnates for at least the next two years, and the real growth starts only after that. A new all-time high should come eventually, the structure points that way, but I wouldn't rush it.
Gold. From here I'm actually waiting for a correction, at least $4,400. That pullback may never come, but if it does, that's the level I want to buy the move higher from.
Silver. It lags gold and moves the same way, so I expect it to follow higher eventually. It looks weak right now, no energy at all. I hold physical silver, and I'm sitting on it for the long haul.
What I've been building this year
You might have noticed fewer posts from me lately. Part of that is summer, and part of it is that I've been heads down building. This was a productive year and I did not coast through it. I understood the timing, so I used the quiet market to work instead of waiting it out.
A few things came out of it. I launched a separate platform in the financial space, an aggregator of trading tournaments across different venues. I shipped a lot of indicators, public and private. And I built out automated trading: a platform with strategies that we actually run live, on autopilot, and it works. That is where most of my energy went while the market did nothing.
I'm also starting to get inquiries about managed accounts. That one I'll keep to a quieter, non-public conversation for now.
I won't drop links here. If you want to see the results of that work, it isn't hard to find. The slow tape was build time, and I used every week of it.
Bottom line
So buckle up. Our limit orders are close to filling. We don't make unnecessary moves, we just keep doing our own thing and let the levels come to us.
Keep the frame I opened with. This is my opinion and my own book, nothing to follow blindly. Take the parts that fit your plan, size for the risk, and set your stop before you enter, not after.
Best Regards, EXCAVO
EURUSD: Rejection From Resistance Signals Potential PullbackHello everyone, here is my breakdown of the current BTCUSDT setup.
Market Analysis
BTCUSDT recently traded inside an upward channel before facing rejection near the 64,500 Resistance Zone. Price has since lost the channel support and is now consolidating below resistance, suggesting that short-term bullish momentum is weakening.
Currently, BTCUSDT is trading below the 64,500 Resistance Zone while holding above the 63,000 Support Zone. The rejection from resistance increases the risk of a deeper pullback toward the lower support area.
My Scenario & Strategy
As long as BTCUSDT remains below the 64,500 Resistance Zone and continues respecting the descending triangle resistance, the bearish scenario remains valid. A rejection from current levels could push price toward the 63,000 Support Zone (TP1).
However, if BTCUSDT breaks and closes above the 64,500 Resistance Zone, the bearish outlook would weaken, opening the door for a continuation toward higher levels.
That’s the setup I’m tracking. Thank you for your attention, and always manage your risk.
Never Trust Crypto Pumps Until You Check These SignalsEveryone wants to buy when the candles turn green, but what if that pump is exactly where the real danger begins?
Is this the start of a powerful new trend, or are late buyers simply providing the exit liquidity?
Short-Term BTC Analysis
Bitcoin has been ranging for several weeks and has now reached a very important weekly resistance. If it fails to break above this level, I expect at least an 8% drop, with a target of $58,000.
When a strong crypto pump starts, most traders only see the green candles and immediately think about buying, but the real question is whether the move is backed by real buying pressure or simply driven by hype and FOMO . Before rushing into a trade, check the volume behind the move, the price location, and whether the previous market structure has actually changed. If price moves up quickly while volume stays weak, the real strength behind the pump may be much lower than it looks . On TradingView, start by marking the key support and resistance levels, then watch the trendline, price action, and volume together. A strong pump is not automatically a strong trade, especially when price is already close to a major resistance. The goal is not to catch every pump, but to understand whether you are buying real strength or simply chasing a green candle that has already made most of its move.
Volume is one of the most useful tools for checking a pump because it can show whether real market participation is behind the move, while RSI can help you judge momentum and see when the move may be getting overheated . Fibonacci Retracement can also help after a strong move by showing possible pullback areas, allowing traders to wait for a better setup instead of chasing price higher. When an important resistance level breaks, do not immediately assume the breakout is real; watch whether price can stay above that level and turn the old resistance into new support . Combining price action, volume, and a successful retest can give you much more information than simply looking at one large green candle. Long upper wicks, weakening momentum, falling volume, or a quick move back below broken resistance can all be warning signs of a possible fakeout . No indicator can predict the future alone, but several signals confirming the same idea can make your decision much stronger.
The most dangerous moment is often when a trader feels there is no time left and believes the pump will continue without them, because this is exactly where FOMO can take control of the analysis . If a strong move makes you chase price without knowing your entry, stop loss, or the level that would invalidate your setup, it may be better to step back and wait for more information. A good trader does not need to catch every pump; the goal is to find setups where the risk and reward make sense and the decision is based on evidence . Sometimes the best decision after a strong pump is simply not buying and waiting for a retest or confirmation, because missing one trade is far better than entering because of FOMO. Before chasing any pump, check volume, momentum, price action, support, and resistance , and never let a few green candles make the final decision for you. The market will always offer another opportunity, but money lost because of one emotional entry can take away many opportunities that come later.
TradeCityPro | Bitcoin Daily Analysis #345👋 Welcome to TradeCityPro!
Let’s analyze Bitcoin. Today is Saturday, and market volume is decreasing.
⏳ 4 Hour Time Frame
After finding support at 62507, Bitcoin has not been able to start a strong bullish trend, and this upward move has been accompanied by significant trend weakness.
🧮 We can see this weakness in the small and weak bullish candles, the decrease in buying volume, and the divergence on RSI.
🎯 However, as you can see, despite this trend weakness, price has continued moving upward, and if 65042 is broken, this upward move could continue even further.
⚖️ So, a break above 65042 gives us a risky long trigger. We will open the main position after 66678 is broken.
📈 On the other hand, considering the significant trend weakness we have, price could move back toward 62507 and 61633. In this case, a break below 64267 would give us a very good trigger for a short position.
❌ Disclaimer ❌
Trading futures is highly risky and dangerous. If you're not an expert, these triggers may not be suitable for you. You should first learn risk and capital management. You can also use the educational content from this channel.
Finally, these triggers reflect my personal opinions on price action, and the market may move completely against this analysis. So, do your own research before opening any position.
BTC/USDT: Lower High Rejection Signals Potential Retest of MajorHi!
Bitcoin continues to trade within a broad consolidation structure, but recent price action points to growing downside pressure on the lower timeframes.
Resistance Defense: The major resistance zone between $67,000 – $67,200 held firm, capping recent bullish attempts. The subsequent lower high near $65,600 confirms that buyers are struggling to build upward momentum.
Moving Average Loss: BTC has lost support at the 4-hour 100 SMA ($64,188), shifting short-term control back toward the sellers.
Structural Weakness: The prior reaction near $62,700 marked a failed attempt to sustain higher ground, leaving the chart vulnerable to a deeper pullback.
Outlook & Targets:
As long as price trades below $65,600, the path of least resistance remains tilted to the downside. The primary target for this move is the key Supply & Demand (S&D) zone at $59,800 – $60,400, where significant buy liquidity rests. A sustained breakdown below this box would open the door for a deeper liquidity sweep toward the $57,400 – $58,300 level.
Invalidation: A clean breakout and 4H candle close back above $67,600 invalidates the immediate bearish setup.
$BTC - Market Update (8/8)CRYPTOCAP:BTC is still testing 65k here. If we keep holding the 64k into the weekend and the 63.5k-62.5k POI gets frontrun, I'm happy to scale into longs.
There's a heavy sell wall around 65.3k-65.6k, with more than 1,500 BTC stacked on Binance perps.
Binance and Bybit perps absorbed roughly $600M in aggressive buying over the past 24 hours, while Coinbase saw -$36.7M in net selling, suggesting spot demand is relatively weak.
The largest buy walls are concentrated around 64.5k-64.2k and short liquidations have already reached $18.3M, so the squeeze fuel has likely been exhausted. So, a retest of 64.5k-64.2k is likely before any sustained move higher.
Have a great weekend!
BTC/USDT: THE $66,800 WEDGE EXPANSION RALLY!
Holding firmly off lower wedge support at 65,042.00! Are you panic-selling this local pullback, or getting ready to ride the multi-wave rally to upper resistance? 🤔
Bitcoin is building momentum within a strong ascending structure on this 1-hour Binance chart. BTC is trading around 65,042.00, holding right on top of the lower support boundary of its Wedge pattern and gathering institutional buy volume for a higher-timeframe expansion. 📈💥
Look closely at the black blueprint trajectory mapping out the coming sessions. The algorithm projects a textbook multi-wave stair-step rally launching directly off this trendline support:
• Initial impulse surge driving price up toward the $66,000 region. ⚡
• A healthy higher-low pullback retesting $65,500 to solidify support. 🌊
• A secondary expansion wave pushing up toward $66,300. 🧱
• A brief consolidation dip back down to $66,000 to absorb profit-taking. 🧹
• Final acceleration surge driving straight into the upper Wedge pattern boundary target near $66,800. 🎯🏹
Maintaining technical patience and trendline alignment is your ultimate superpower in this environment. Trying to short directly into a verified ascending support floor while price holds inside an established structure is a fast track to getting caught in an aggressive short squeeze. Smart money is quietly accumulating long position blocks right off this demand base. 🧘♂️⚡
🛠 Trade Parameters:
🛒 Long Zone: 64,850 - 65,100 🛍️
🛑 Stop-Loss: 1h close below 64,500 ❌
💰 Take-Profit: 66,800 🎯
The retail bears trying to short the bottom of this wedge structure are about to get caught offside as institutional buy volume takes total control. Stay focused, strictly manage your risk, and let the algorithm do the heavy lifting for you.
Maintain your composure through the waves, and we will see you up at the $66,800 wedge target ceiling! 🚀💎
TradeCityPro | Bitcoin Daily Analysis #346👋 Welcome to TradeCityPro!
Let’s analyze Bitcoin. A new move in the market is starting!
⏳ 4 Hour Time Frame
Bitcoin has managed to move above 65106 and is now trying to hold above this level.
✔️ If this happens, price could move toward 66678. So, the long position we opened after the break of 65106 could move into good profit.
💡 If price reaches 66678, we can take profit. On the other hand, if 65106 turns into a fake breakout, bearish momentum could enter the market, and in that case, we can open a short position.
⭐ Our main trigger for the short is 64267. Considering the trend weakness we are seeing in this bullish move, once this trigger is activated, price could move toward the supports at 65507 and 61633.
❌ Disclaimer ❌
Trading futures is highly risky and dangerous. If you're not an expert, these triggers may not be suitable for you. You should first learn risk and capital management. You can also use the educational content from this channel.
Finally, these triggers reflect my personal opinions on price action, and the market may move completely against this analysis. So, do your own research before opening any position.