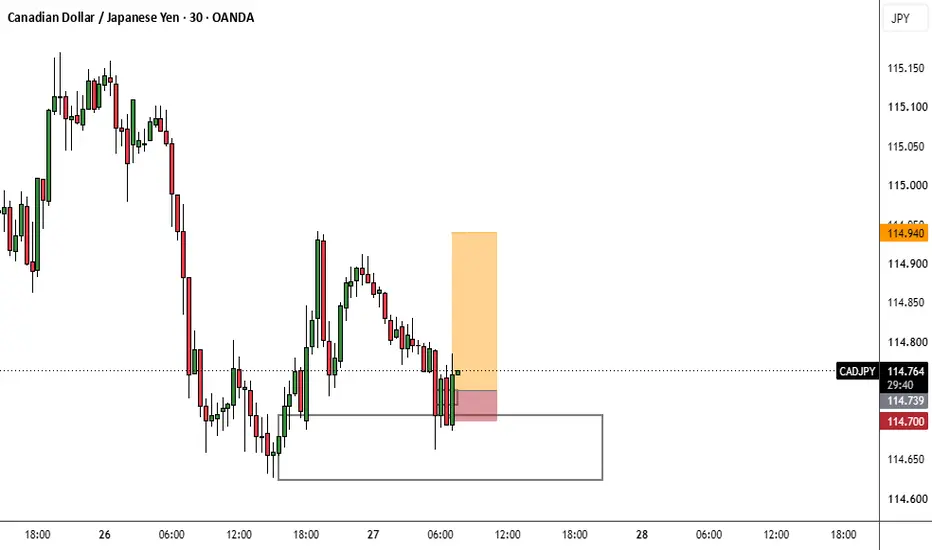
CADJPY | 15min Timeframe Analysis | Bullish Side Direction After long time trend continue to the bearish side. Then it's time to reversal of this trend. Now shall I waiting after the MSS (Market Structure Shift). After some confirmation to trend reversal to the major identity on first bottom need a lower low liquidity sweep then market bullish momentum generate. After find out the "W" type or "Double Bottom" Structure. Then Second bottom also need a Bullish Engulfing 2cp Candlestick Pattern. Then go with the reversal bullish trend.
Important Area :-
1)
Canadian Dollar / Japanese Yen
No trades
No trades
In-depth trading ideas
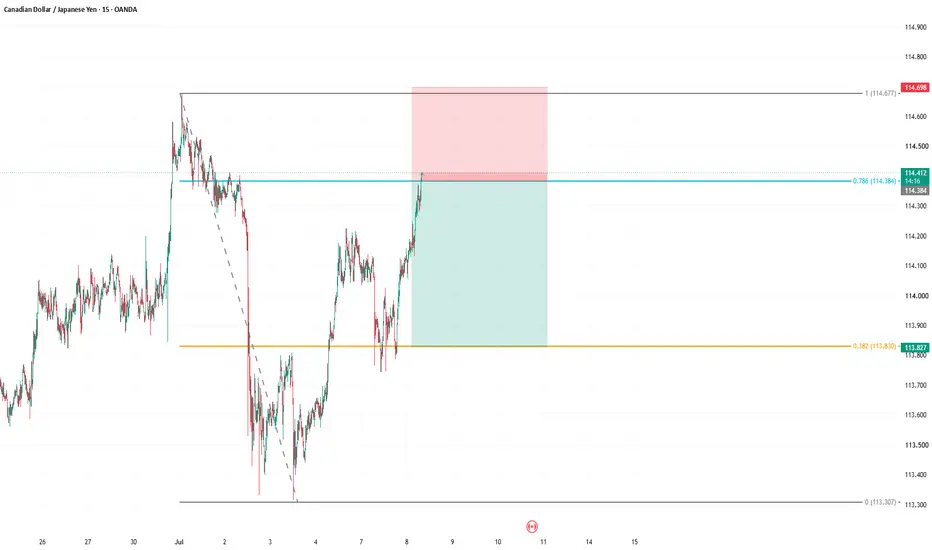
CADJPY | 15min Timeframe Analysis | Bearish Side DirectionLet's follow the bearish trend market. This resistance zone also important. Need a "M" / "Double Top" type structure. Then second top also need a bearish engulfing 2cp candlestick pattern. Then go with the bearish trend.
Important Area :-
1) Resistance Zone = 111.407 - 111.422
2) Need a "M" / "Double Top" type structure.
CADJPY Finds Strong Support – Buyers Step InCADJPY has taken quite a hit recently, but the interesting part is where the selling started to slow down. Price has reached an important support zone around 111.40–111.60, and we're finally seeing buyers step back in after that sharp decline.
Looking at the 2H chart, this area has already been tested several times, and sellers are still struggling to push through it. That's what catches my attention. The recent bounce suggests that buyers aren't ready to give up this level just yet.
For now,
CADJPY | 30min Timeframe Analysis | Bullish Side DirectionAfter Long time trend continue to the bearish side, Then it's time to reversal of this trend. Now shall I waiting after the MSS (Market Structure Shift) . After some confirmation to trend reversal to the major identification on first need a lower low liquidity sweep then market bullish momentum generate. After find out the "W" type structure / "Double Bottom" Structure. Then Second bottom also need a Bullish Engulfing 2cp Candlestick Pattern. Then go with the reversal bullish trend.
Important A
CAD/JPY: The Big Reversal PlayMomentum is shifting — CAD/JPY has snapped out of its bearish grip and is climbing inside a sharp green channel. With price teasing the 111.200 mark, traders are staring at a setup that screams opportunity: a tight red stop zone guarding the downside, and a massive green profit window stretching toward 115.500. This isn’t just a chart; it’s a high‑stakes battlefield where precision meets payoff.
CADJPY TRADEEHere i have applied MS, LQ, and PROPER RISKMANEGEMENT, SO IM HOPING YOU APPLY YOUR OWN RISKMANAGEMNT HERE, it's a 1:5 rr trade, and my stategy have 40-50% win ratio, here also im targeting the liquidity above and waiting for the OB to hit, and in daily timeframe if you see, it has moved down alot, so i think it will remain bullish for sometime, so with that all of that i have provided this trade, thank you and take care :)
Adding CADJPY And EURUSD in my watchlist Hello traders , here is the full multi time frame analysis for this pair, let me know in the comment section below if you have any questions , the entry will be taken only if all rules of the strategies will be satisfied. wait for more price action to develop before taking any position. I suggest you keep this pair on your watchlist and see if the rules of your strategy are satisfied.
CADJPY – Short Setup (1H Timeframe)Entry: 116.502
Stop Loss: 26 pips
Take Profit: 52 pips
Risk to Reward: 1:2.0
📉 Trade Idea – Short Bias
CADJPY has tapped into a premium zone after an extended bullish leg. Price reacted sharply from the supply block with signs of exhaustion, creating wicks and rejection candles around 116.50–116.60, indicating potential distribution.
We are looking to short as price re-enters the zone and shows rejection.
🔍 Technical Confluence
Price is trading deep inside a higher-timeframe supply zone.
Mul
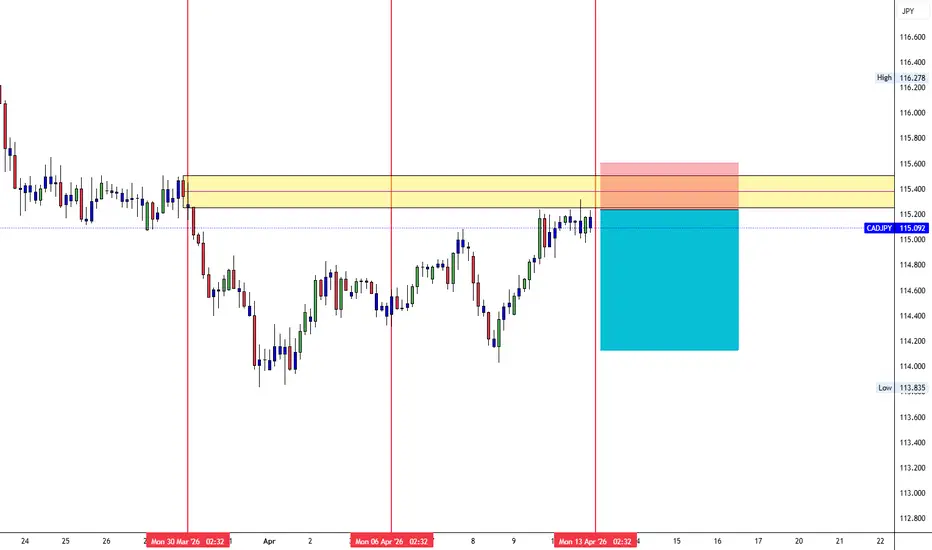
CADJPY at Strong Supply ZoneCADJPY is currently testing a well-defined supply zone on HTF 💎
After a steady bullish move, price has entered a key resistance area, where sellers are expected to step in.
🔍 Market Structure:
Bullish push into supply
Clean resistance zone (unmitigated)
Price slowing near zone
Potential bearish reversal 📉
🎯 TRADE PLAN:
✅ Sell Entry: 115.30 – 115.60 zone
🛑 Stop Loss: 116.00
🎯 Target 1: 114.30
🎯 Target 2: 113.80
🎯 Target 3: 113.20 (previous demand zone)
⚡ Execution Tip:
Wait for LTF confirmati
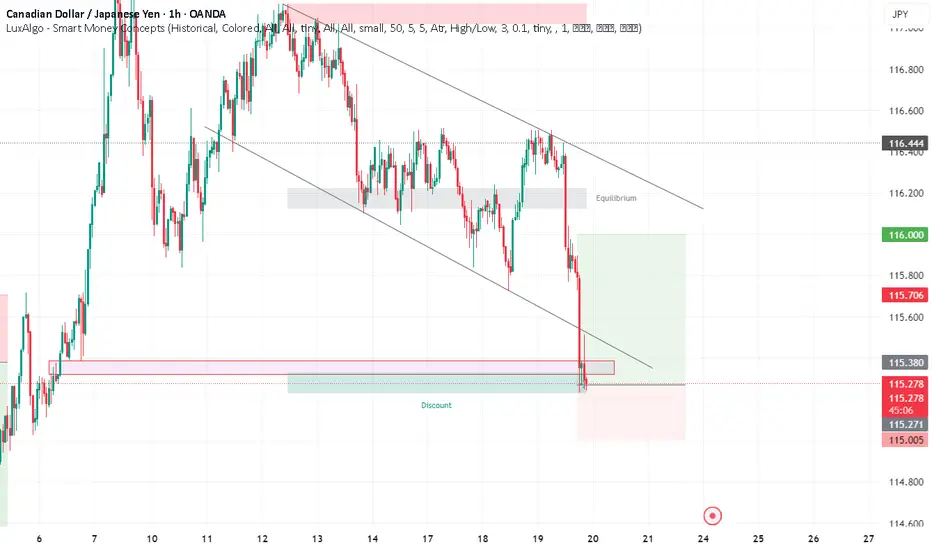
CADJPY Sell Setup – Liquidity Sweep + Descending Channel RejectiTrade Type: Short
Entry: 115.271
Stop-Loss: 26 pips
Take-Profit: 72 pips
🧠 Trade Idea Explanation
Price on CADJPY (1H) is moving inside a clear descending channel, consistently making lower highs and lower lows. After a strong impulsive drop, price tapped into a discount zone and showed a liquidity sweep beneath a minor support area.
Why This Sell Setup Makes Sense?
✔ Descending Structure: The pair is respecting the channel, rejecting the trendline perfectly.
✔ Liquidity Grab: Price wicked below
FOREX "PAIRS IN PLAY" Session 34 17 02 26Scanning multiple forex pairs to filter high-quality trade setups. No trades are forced—only structure-based opportunities.
Note: There may be a delay in this video due to upload processing time.
Disclaimer: FX trading involves high leverage and substantial risk, and losses can exceed your initial investment. This content is for educational purposes only and should not be considered financial advice. Trade at your own risk.
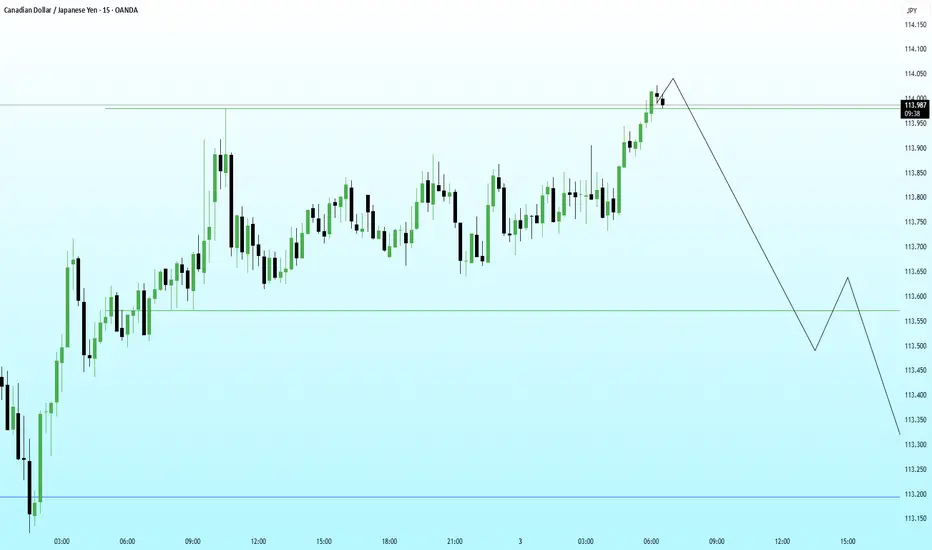
CAD/JPY – 15 Min CADJPY is currently auctioning into a well-defined premium array, approaching clustered buy-side liquidity resting just beneath the 114.00 psychological handle. The recent impulsive expansion exhibits the characteristics of a liquidity engineering move, suggesting the objective may be stop collection rather than authentic bullish continuation.
Price is interacting with a refined bearish order block, aligned with the upper boundary of the active dealing range. The lack of efficient acceptance be
CADJPY 2HR T/F ANALYSIS --- WE NEAD A RETESTING FOR SELL SIDE
📊 Market Structure Explanation (cadjpy – 2hr)
the structure are clear look like a strong bearish formation:- in this selling trend we can se imbalance also and our strong supply of previous demand which are marked clearly into green color they demand copy and past on recent demand bottom to top and now we have a retesting area :-
🔍 What the market can do next:-
Scenario 1 – Pullback / retesting (Needs Confirmation):
For any meaningful retesting to occur, the market must first show clear bear
CADJPY 4HR T/F ANALYSIS----
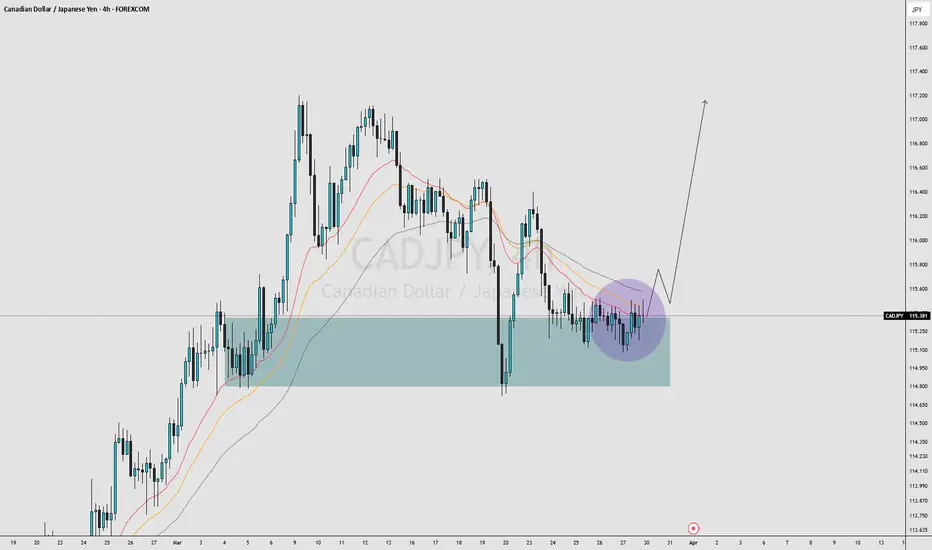
cadjpy 4hr t/f analysis---- in arc internal breakout of penant supply now current supply can measure from previous supply after supply complete then we can see demand from reversal portion after a confirmation like bullish candle then we can go with demand which are heighlited demand let`s see--- remember trend are bullish so after supply complete then we can plane a exicution--
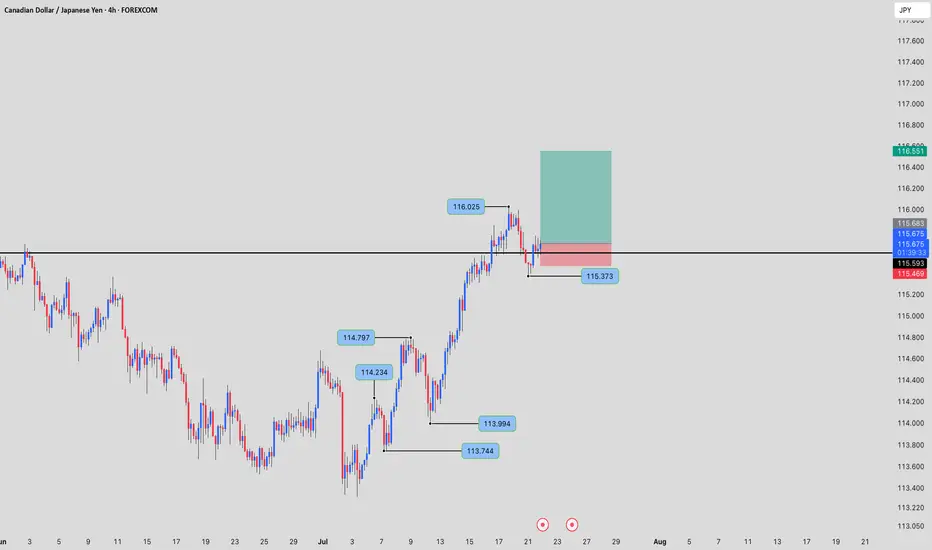
CADJPY could keep rising furtherOANDA:CADJPY The market has been on a clear upward trajectory for some time, with each swing reaching higher peaks and forming higher lows. The rising trendline has been the driving force behind this momentum.
Following the recent surge, the price has pulled back slightly, forming a textbook bullish flag pattern.
This is the kind of price action you want to see in a strong uptrend—a controlled retracement with a minor dip, without any aggressive selling pressure.
The bears have failed to brea
CADJPY | Intraday Short Setup – Smart Money Play in ActionAfter a strong bullish impulse, CADJPY has entered a critical supply zone where price previously showed signs of exhaustion. On the 15-minute chart, the pair formed a clear liquidity grab above the previous highs and then started showing rejection candles — an early sign of potential bearish momentum.
Here’s the detailed reasoning behind my short setup 👇
After the Asian session bullish rally, price aggressively tapped into a premium zone (highlighted in green). This area aligns perfectly with