copperhas corrected last week from major resistance zone now coming towards retest zone it will be interesting to see action in 1300-1320 zone if consolidates start making higher high on 2 hour -4 hrs. time frame will confirm start of new upward rally after correction good time to enter it can bounce back towards 1400-1450 zone in next series for me 1260-1270 is most important closing support . any fall this week towards 1300-1320 zone will be considered as demand zone . bullish momentum fails if day start closing below 1270 levels .
Micro Copper Futures
No trades
No trades
In-depth trading ideas
Copper Poised for Rebound as Demand Recovers and Dollar WeakensCopper’s recent drift lower runs deeper than energy-led macro headwinds. China’s pullback in demand and elevated inventories have weighed on sentiment, though early signs of stabilisation are emerging. With the Fed holding rates and the dollar at risk of softening, the setup is shifting toward a more balanced and potentially constructive phase.
Copper’s Real Stress Lies Beneath Energy Prices as China Demand Quietly Slips
Like many other commodities, copper has come under pressure in recent weeks as war-driven energy price spikes weigh on global growth expectations and industrial demand.
However, beneath this broader concern lies a more immediate shift that markets are beginning to focus on. China, the world’s dominant copper buyer, is pulling back. Net imports of refined copper fell sharply to 125.4k tons in February, marking the weakest monthly level in over a decade, pointing to a clear cooling in demand.
Source: Reuters
That pullback hasn’t come out of nowhere. Imports have been losing momentum since September, right when LME copper prices pushed past the $10,000 mark and began their run toward January highs. It is a familiar pattern: buyers stepping back when prices stretch too far. Yet this time, a deeper shift is underway. China’s expanding domestic production is quietly giving it more control over pricing dynamics, reducing its reliance on overseas supply.
At the same time, inventory trends tell their own story. Post-Lunar New Year stockpiles on the Shanghai Futures Exchange surged to around 433.5k tons in early March, far exceeding last year’s holiday peak of 268.3k tons and even surpassing the previous seasonal record of about 380k tons seen during the 2020 lockdown.
That kind of accumulation signalled weak immediate demand. The unwind, however, has already begun, as inventories eased to roughly 301k tons, suggesting consumption is gradually picking up, even if the recovery still feels measured.
There is a key nuance worth highlighting here. The build-up in COMEX inventories, driven in part by unresolved copper tariffs and the return of aluminium duties, is muddying the demand picture. What shows up as weak consumption is not entirely organic, some of it is policy-driven stockpiling. That makes it tricky to confidently call a clean reversal.
Dollar Strength Is No Longer a Given as Global Rate Pressures Build
The early signs of demand stabilisation, though encouraging, are only part of the story. For copper, how this recovery evolves will depend just as much on the macro overlay, particularly the direction of the dollar. With the Fed opting to stay on hold, currency moves are starting to carry more weight. A softer dollar would lend support to the nascent demand pickup, while any resurgence could quickly temper it.
Rates were left unchanged at 3.50-3.75% in the March meeting, with policymakers navigating a tricky mix of slowing job growth, steady unemployment, and inflation that still has not fully settled. Jerome Powell has also signalled a clear “wait-and-see” approach, with the Fed watching how energy-driven inflation and ongoing Middle East tensions evolve before considering its next move.
Markets have moved quickly to reflect that stance. Expectations of an extended pause have shot up. Traders don’t expect another rate cut until mid-2027 now.
Source: CME Quikstrike
The shift has been driven by concerns about a reacceleration in inflation. Energy inflation is expected to rise due to the conflict in the Middle East and restricted oil flows. The March CPI, which was the first one since the war began showed inflation spiking from 2.4% to 3.3% (just below expectations of 3.4%).
The increase was clearly driven by energy prices, with the category up 10.9% MoM and 12.5% YoY. Gasoline inflation was as high as 21.2% MoM. As the conflict continues, the risk of this inflation becoming embedded in other categories is high. The higher inflation makes it hard for the Fed to cut rates further.
A steady Fed does not automatically translate into a stronger dollar. While the Fed retains the flexibility to stay on hold, other central banks facing stickier inflation and lower starting rates may be forced to tighten further. That shift compresses interest rate differentials that have long favoured the dollar. As those gaps narrow, capital will begin to rotate, offering support to currencies like the euro and, by extension, creating a softer backdrop for the dollar. We have argued this previously here .
Calmer Volatility but Firmer Positioning Suggests Copper Is Entering a Transition Phase
The interplay between easing volatility and a constructive skew point to a market in transition, as reflected below.
Source: CVOL Index
Additionally, Managed Money increased its long positions by 3.2% WoW, while its short positions climbed by 14.4%. This resulted in net long positions dipping by 1.2% WoW.
Source: CME Quikstrike CoT
Even so, the tone has shifted slightly. The pace at which these participants have been cutting net longs has slowed compared to earlier stretches, hinting that while conviction is still cautious, the selling pressure is no longer as aggressive.
Historical Trade Setup
A useful parallel can be drawn from June-2025, when the Israel-Iran conflict unfolded. Unlike the sharp moves seen in energy, copper’s price action was notably restrained. Through the peak of the conflict, copper largely traded sideways.
The inflection came after the ceasefire. As tensions eased toward late June, currency markets moved first. The US dollar began to reprice lower, with the Dollar Index falling by 1.34% following the ceasefire announcement. This shift improved the affordability of copper for global buyers, setting the stage for a more constructive demand response.
Policy clarity followed. At the subsequent Fed meeting, policymakers held rates steady at 4.25-4.50%, reinforcing a sense of stability just as geopolitical uncertainty was fading. With both the dollar softening and rate expectations anchored, volatility compressed and risk appetite gradually rebuilt across commodities.
Copper’s move higher was therefore less about a sharp catalyst and more about a sequencing of events. First, the removal of geopolitical overhang. Second, increasing expectations of a softer dollar. And third, a gradual re-engagement from physical buyers owing to lower prices.
For instance, a trader who went long on the front-month Copper futures on 20/Jun/2025 and exited on 02/Jul/2025 would have realised a gross mark-to-market gain of USD 1,037.50.
In the current environment, where copper is again absorbing macro shocks, a similar setup may be forming. The focus, as before, should be more on what follows once both volatility and policy uncertainty begin to settle.
Market participants can implement similar positioning through CME Micro Copper futures, which are one-tenth the size of the standard contract. The smaller contract size allows for more granular positioning and a lower capital outlay while maintaining exposure to movements in copper prices.
Long CME Micro Copper Futures
Entry = USD 5.0195
Exit = USD 5.4345
PnL: 2,500 x (5.4345 - 5.0195) = USD 1,037.50
This content is sponsored.
MARKET DATA
CME Real-time Market Data helps identify trading setups and more effectively express market views. If you have futures in your trading portfolio, you can check out on CME Group data plans available that suit your trading needs at tradingview.com/cme .
DISCLAIMER
This case study is for educational purposes only and does not constitute investment recommendations or advice. Nor are they used to promote any specific products, or services.
Trading or investment ideas cited here are for illustration only, as an integral part of a case study to demonstrate the fundamental concepts in risk management or trading under the market scenarios being discussed.
Copper Showing Strength — Upside Potential in Coming DaysCopper is often called “Dr. Copper” because it reflects the health of the global economy. When copper starts stabilizing or showing strength, it usually signals that growth expectations are not collapsing, even if there is short-term uncertainty in the markets.
Right now, despite ongoing global tensions, rising dollar strength, and cautious sentiment across asset classes, copper is not showing panic behavior. Instead of breaking down sharply, price has been moving in a controlled corrective phase inside a descending channel.
From a technical perspective, this is important.
After a strong rally, markets typically go through time correction or price correction before the next move. In this case, copper has been correcting within a well-defined structure, respecting both resistance and support levels cleanly. Recently, price approached the lower half of the channel and started showing signs of stabilization and gradual buying interest.
This type of behavior suggests that sellers are losing momentum, and the market is not willing to push prices aggressively lower.
From a macro lens, this divergence is interesting.
While assets like the dollar and bonds are reflecting caution, copper holding its ground indicates that underlying demand expectations are still intact. If global markets were pricing a deeper slowdown or prolonged stress, copper would likely be breaking support decisively.
Instead, what we are seeing is resilience.
This sets up a clear scenario:
If copper continues to hold this structure and starts pushing higher, it could move toward the upper channel resistance, indicating a shift back toward risk-on sentiment. On the other hand, a breakdown below this structure would confirm that macro pressure is finally catching up.
For now, the price action is telling a subtle but important story —
risk is present, but not fully accepted by the market yet.
Sometimes, the most powerful signals are not in sharp moves, but in what the market refuses to do.
And right now, copper is refusing to break down.
MCX COPPER: RSI Overheated – Prepare for the Final ClimaxTicker: COPPER1! Timeframe: Weekly (1W)
Key Observations
1. Wave Structure
MCX Copper is mirroring the global structure, confined within a perfect rising channel.
The market is in the final stages of Wave 5.
2. The RSI Warning (Crucial)
RSI is at 81.15: This is an extreme "Overbought" reading.
Implication: While the price can still push higher to hit the target, the risk of a sudden "profit-booking" crash is very high. The engine is running hot.
3. Key Targets (The Exit Zone)
₹1,125 - ₹1,189 (Blue Box): This is the ultimate target zone where the channel top meets Fibonacci resistance.
₹1,189 is the potential "Blow-off Top."
4. My Final View Caution Recommended.
Action: Existing longs should TRAIL STOP LOSSES strictly.
Warning: Do not enter fresh aggressive buy positions here. The risk-reward ratio is not favorable for new entries.
Strategy: Wait for the test of ₹1,125+ to exit.
Disclaimer: This analysis is for educational purposes only. Trade with strict risk management.
copper crucial update in long term copper month chart showing again stair pattern like gold which indicate heavy bull zone possible yes some down correction can be seen due to dxy strength or some profit booking at higher lvl. technical ideas---- copper has strong support 950-40 if mkt comes down due to given reason than should buy with sl 933 closing base sl soon tgt 1080--1160++++ no if and but
over all looking hot copper may be next silver gold in base metal. its all my prediction as per chart
Swing Trade Journey – Trade 8: Copper FuturesTrade 8 Log
Long in #CopperFut at ₹972 on 03/10/2025
Gap-up entry executed as per alert.
Reasoning:
Price triggered the alert on a gap-up opening, confirming strength after consolidation. Trend remains intact above short-term averages with momentum favouring continuation. Setup offered a clean entry with limited downside risk.
Tracking this as part of my swing trade journey — recording setups, risks & outcomes.
#TradingJourney #CommodityTrading #SwingTrading #Copper #Futures
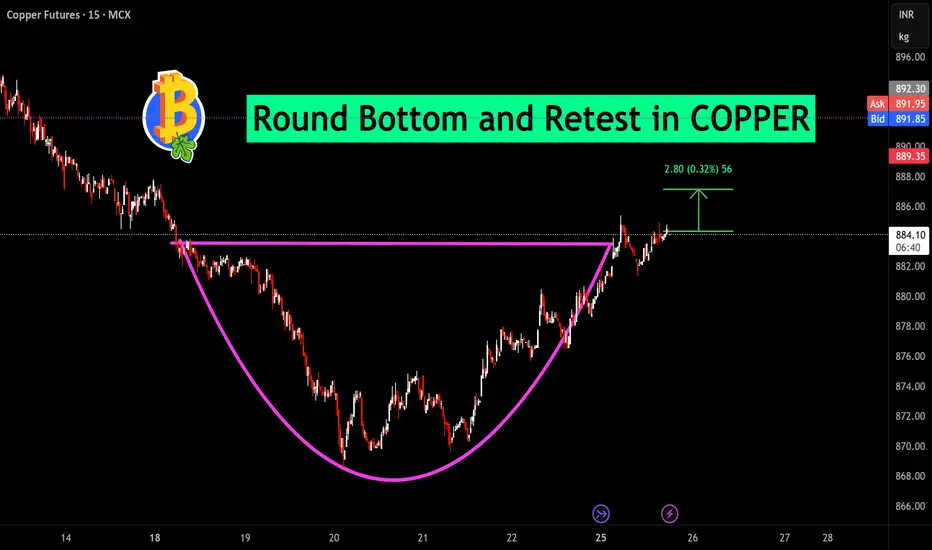
Round Bottom and Retest in COPPERA well-defined Round Bottom formation and subsequent retest is observed in Copper Futures (MCX) on the 15-minute chart. After a prolonged downtrend, price has rounded out a base and reclaimed the neckline resistance near ₹884. This breakout was confirmed by a successful retest, with bulls defending the level and initiating upward momentum. The measured move projects a target of roughly ₹2.80 higher (0.32%) from the neckline, reinforcing the bullish bias for short-term trading.
Trade Context for Posting
Pattern: Round Bottom breakout and retest.
Instrument: Copper Futures (MCX), 15-minute timeframe.
Breakout Level: ₹884.
Target Move: ₹2.80 upside (0.32%), based on breakout projection.
Validation: Multiple tests of the neckline, clear support confirmation, and price expansion following retest.
Trade Plan: Enter long positions above ₹884, place stop-loss below the retest low, and aim for the projected target. Monitor for volume and price action confirmation for sustained gains.
This setup demonstrates classical technical structure, where bottoming and retest provide conviction for the move and risk management.
image.jpg
345.1 KB
Copper Futures – Support Holding Strong, Bulls May Step In📌 Trade Idea:
Bias: Bullish
Setup: Bounce from Demand Zone
Entry: Around ₹892.00–₹892.35
Stop-Loss: Below ₹889.35
Target: ₹897.65+
A successful defense of this support could pave the way for a quick recovery move toward higher resistance levels. Watch closely for a bullish candle confirmation and rising momentum to validate the move.
Copper Futures – 15 Min Chart Analysis (MCX)Copper is showing signs of a potential short-term reversal after a strong upward rally. The price action has faced resistance around 895, which is marked with a red candle and a small rejection wick (highlighted with the blue arrow).
This region could act as a supply zone, where sellers are stepping in. A short position has been initiated here with:
Stop-loss: Slightly above the recent high (~898)
Entry: Near 894.85
Target zone: Around 891.60 (as indicated by the green box)
The risk-to-reward ratio appears favorable if the price fails to sustain above 895. A breakdown below the immediate support may confirm short-term bearish momentum.
📉 Bias: Bearish below 895
🧠 Suggestion: Wait for confirmation or tight SL if taking a counter-trade position
Copper Weekly PlanAll detail for chat. good entry at mark price only. and must stoploss minimum risk and good profit. risk ratio 1:1 to manage modified SL.
📌 This is not a buy/sell recommendation, just an educational trading idea.
📌 Market conditions can change; always conduct your own research.
📌 Understand risks before investing and take full responsibility for decisions.
Copper Futures Update – Bullish Setup Alert!A strong trendline support pattern has formed in Copper (MCX), as seen on the 15-minute chart. Price has successfully respected the support zone near ₹876, indicating buyers are stepping in around this level.
With a positive price reaction from support and a favorable risk-to-reward setup, a potential upward move towards ₹880–₹881 is on the cards. 📈
This setup suggests a short-term bullish sentiment as long as the support holds. Traders can keep this level on radar for intraday to short-term opportunities. ✅
Copper MCX Future Technical Analysis - 14-Apr-25🚀 Copper MCX Future Technical Analysis - 14-Apr-25 🚀
With 6+ years of research and proven success in trading indices and commodities, I bring you high-probability intraday levels to help you stay ahead in the market. Follow these precise setups and trade with confidence!
🔥 Like, share, or boost this post if you found it helpful! Your engagement keeps me motivated and brings a smile to my face. Drop a comment if you visited my profile—I’d love to hear from you! 😊
✅ Day Range Trigger Point: 839.45 | ✅ Expected Move: 18.15
📈 Buy Above: 835.42 | ✅ Average Buy Position: 833.28
🎯 Target1: 850.67 | 🎯 Target2: 857.60
⛔ Stoploss: 829.37
📉 Sell Below: 831.13 | ⛔ Stoploss: 837.18
🎯 Target1: 828.23 | 🎯 Target2: 821.30
📊 Trading Strategy & Key Insights:
🔹 Retest for confirmation: Let the price retest the level before entering.
🔹 Ideal Entry Timing:
Before 10:30 AM or after 5:00 PM: Enter as soon as the level breaks.
Between 10:30 AM and 5:00 PM: Enter as close to the stoploss as possible, as the market often revisits stoploss zones during non-peak hours.
💡 Trading is a game of patience and precision. Follow tested strategies and let the market do the rest! 📈
#CopperTrading #MCX #IntradayTrading #TechnicalAnalysis #CommodityTrading #PriceAction #NumroTrader #TradingSignals #TradingTips 🚀
Copper FuturesCopper Futures – Pattern Breakdown with Bearish Setup
🔻 Symmetrical Triangle Breakdown Observed
Major breakdown from a long-consolidating symmetrical triangle indicates potential downside.
🔸 CMP: 804.80
🔸 Upper Breaking Range: 852.60
🔸 Lower Breaking Range: 791.10
🔸 Selling Target: 740.40
🧩 Pattern Summary:
• Clear breakdown from triangle with strong bearish candle
• High volume breakdown day confirms seller dominance
• Retest possibility around 804–810 zone before continuing the fall
• Pattern aligns with previous swing zones and Fibonacci clusters
💡 Trade Idea (for educational purpose):
Wait for price to break 791.10 with volume or retest rejection near 804–810
→ Target: 740.40
→ SL: Candle close above 830 or Above Trendline
→ Risk-Reward Approx: 1:1.5+
📌 Stoploss candle close only, Target Trigger Price
📌 This is not a buy/sell recommendation, just an educational trading idea.
Copper MCX Intraday Technical Analysis for 2nd Apr., 2025!🚀 Unlock the potential with my Copper MCX Intraday Technical Analysis for 2nd Apr., 2025!
✨ Boost, follow, and engage for updates. Your support means a lot! 🚀❤️
📍 Day Range Trigger Point (DRTP): 893.90
📅 Expected Day Range: 14.60
📈 Long Position
🔹 Buy Above: 896.82
📊 Average Position: 895.10
🎯 Target 1: 902.92
🎯 Target 2: 908.50
⛔ Stoploss: 891.96
📉 Short Position
🔹 Sell Below: 893.38
🎯 Target 1: 884.88
🎯 Target 2: 879.30
⛔ Stoploss: 898.24
✨ My strategies are backed by 6+ years of research and proven success in trading indices, commodities, and more. Connect to know more for Intraday Levels and Live Market Confirmations. 📈
#CopperMCX #IntradayTrading #NumroTrader 🚀
COPPERHello & welcome to this analysis
Copper (MCX) is making a bullish Harmonic Seahorse breakout. A weekly close above 885 would activate it for a potential upside probable target of 1000. Post breakout if it slips below 700 the pattern will have become invalid.
Good risk reward set up currently for accumulation.
Stocks which could gain from increase in copper prices - Hind Copper, Hindalco & Vedanta.
Sectors which could get hammered from increase in copper prices since its a part of their raw material for manufacturing - White goods consumer durables manufactures, Electric cables and wire manufactures & Automobile manufacturers.
All the best
Big Move Ahead? Copper Futures Breakout Trade Setup!Hello everyone i hope you all will be doing good in your life and your trading as well. Today i have brought a Copper Futures (MCX, 1D) trading idea, earlier it has broken out of a Symmetrical Triangle Pattern , and given signal of a strong bullish move . after the breakout copper has given good move and finally trading above the all near term resitance zone like NECKLINE , Buyers are stepping in aggressively. If the price holds above the 895-880 zone, we could see a rally towards 913, 937, and even 986 in the coming sessions. But remember, risk management is key! A strict stop loss at 858 will help protect against any unexpected reversals. The structure looks solid, momentum is building up—now let’s see if the bulls take charge!
Disclaimer: This analysis is for educational purposes only. Please consult a financial advisor before making investment decisions.
If you Found this helpful? Don’t forget to like, share, and drop your thoughts in the comments below.
Copper ### **📉 Copper Futures Trade Setup (15M Chart) 📉**
🔹 **Pattern:** Gartley Harmonic Pattern
🔹 **Entry Zone:** 866.05 – 866.85
🔹 **Stoploss:** 867.85
🔹 **Target 1:** 862.30 🎯
🔹 **Target 2:** 858.00 🎯
💡 **Key Insights:**
✅ **D-Point Reached** – Potential Reversal Zone 📉
✅ If price breaks below **866.05** (Breaking Range), further downside expected
✅ **Bearish Outlook** towards **selling targets**
📌 **Disclaimer:** This analysis is for **educational purposes only** and not financial advice. Trade responsibly! 🚀