Peers for comparison
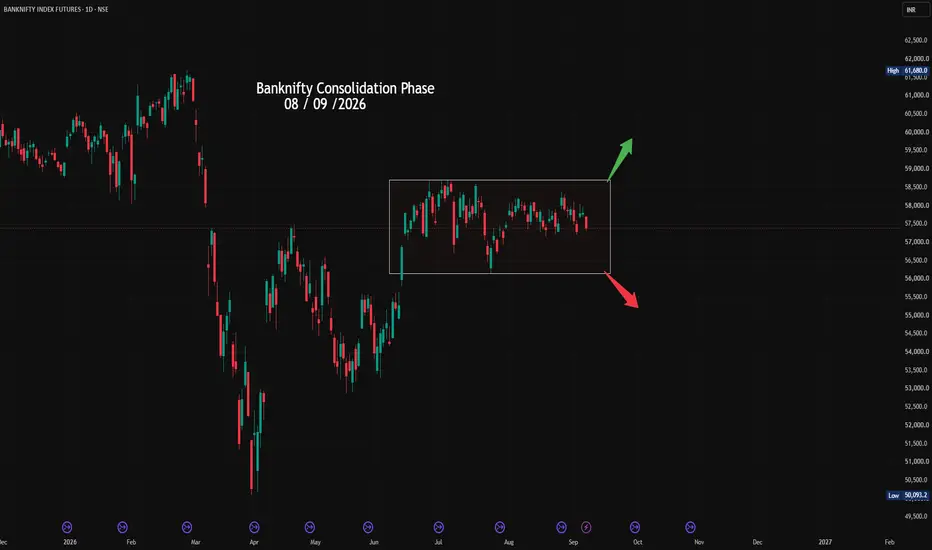
Banknifty Consolidation Phase 08 / 09 /2026 NSE India : Banknifty Daily chart Analyses
Bank Nifty Consolidation Phase and Structural Integrity: For the last 4 months, Bank Nifty has traded within a range, with a high of 58,650 and a low of 56,200
🔴 Major Resistance: 58,650
58,650 is the upper boundary of the established distribution/consol
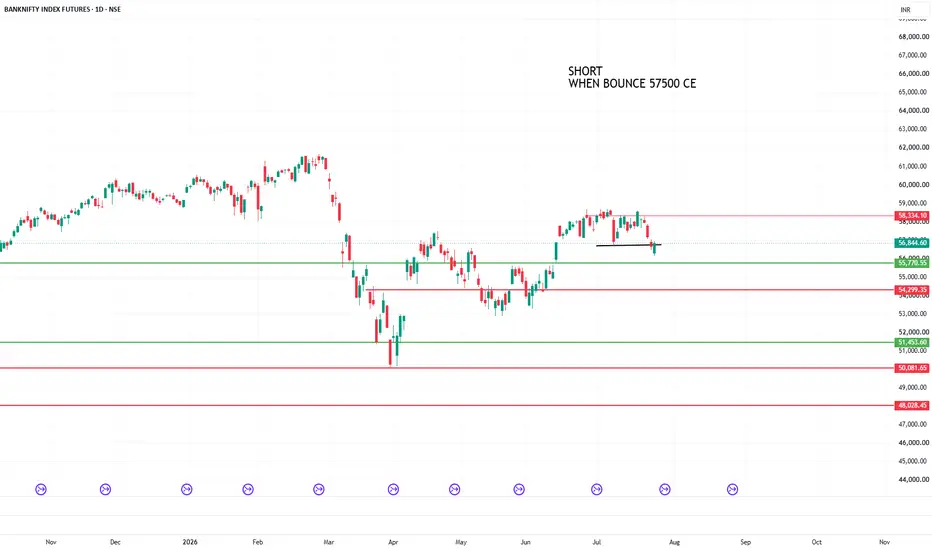
#BANKNIFTY1!Price Action & Structure: The weekly candle opened at 57,800.0, hit a high of 58,380.0, and tested a low of 57,224.2, continuing to consolidate below the SELL 56844.6 signal structure and previous range high OL.
Key Levels & Resistance: Immediate overhead structural resistance sits at LSL 60,028.15
BANKNIFTY FUTURES – Symmetrical Triangle Breakout on Daily ChartBANKNIFTY FUTURES – Symmetrical Triangle Breakout on Daily Chart
BankNifty Futures appears to be breaking out of a multi-week symmetrical triangle consolidation after respecting both the rising support trendline and horizontal demand zone. The recent bullish candle indicates buyers are attempting t
BANK-NIFTY – Symmetrical Triangle Breakout (Daily)BANKNIFTY – Symmetrical Triangle Breakout (Daily)
One can trade in Banknifty futures or Banknifty ETF
BANK-NIFTY Symmetrical Triangle Breakout Confirmed
Bank Nifty Futures has finally broken out of a multi-week symmetrical triangle pattern on the daily timeframe. The breakout suggests a potentia
Intraday AnalysisOption Chain Analysis: Decoding Open Interest (OI) to find where the "Big Players" are positioned.
FII/DII Data: Understanding institutional activity and its impact on market direction.
Intraday Strategies: Scalping and swing setups using Price Action and key EMAs.
Global Market Cues: How GIFT Ni
Institutional Trading MasterclassCore Structure of Institutional Option Trading
Institutions focus on 4 pillars:
A. Direction
Will market go up, down, sideways?
B. Volatility
Will movement increase or decrease?
C. Time Decay
How much premium melts daily?
D. Risk Exposure
How much capital at risk?
Rules to Become Consisten
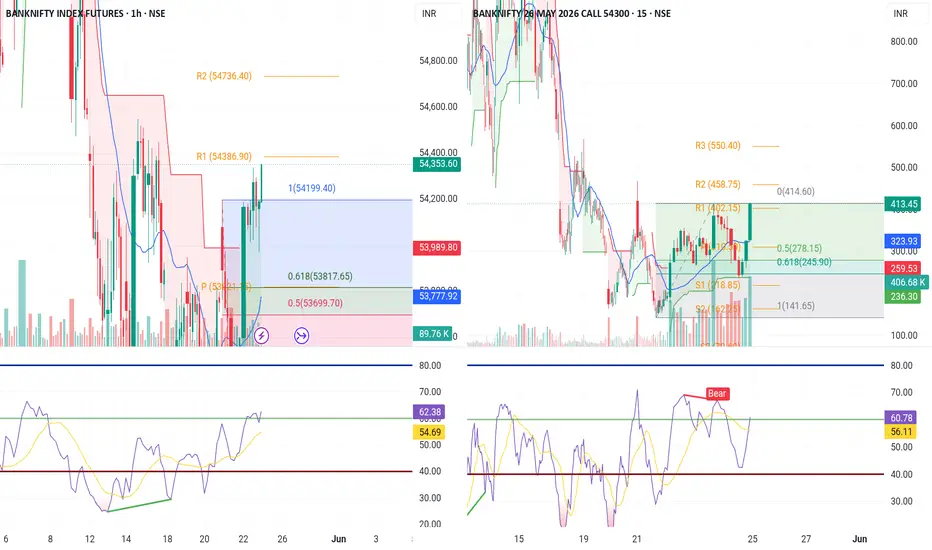
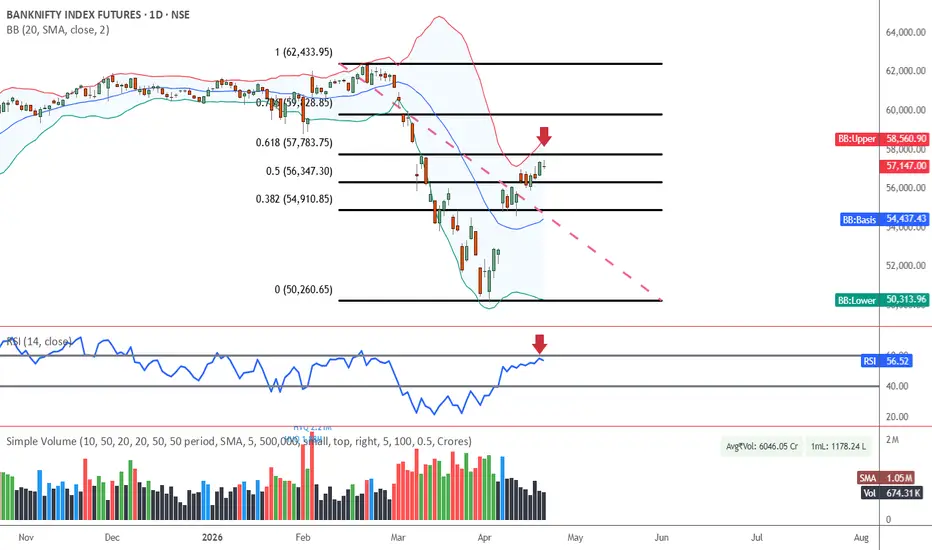
BANK NIFTY @ MAKE OR BREAK LEVELThe index is currently at a massive crossroads! We are seeing a heavy technical confluence as price tests the **61.8% Golden Ratio** and the **RSI** hits that crucial **60 resistance** zone. 📉🛑
### 🔑 **The Make-or-Break Level: 57,500** 🔑
This is the line in the sand.
🚀 **BULL CASE:** If we sustai
See all ideas
A representation of what an asset is worth today and what the market thinks it will be worth in the future.
Displays a symbol's price movements over previous years to identify recurring trends.
Frequently asked questions
One way to gain exposure to BANKNIFTYF2024 is through a broker that offers futures. Before trading, make sure you understand how the product works and the risks involved.
You can trade BANKNIFTYF2024 directly from TradingView:
– Choose a broker: Explore our supported trading partners and pick one that fits your needs
– Compare options: View available brokers side by side to evaluate fees and features
– Connect your account: Open Supercharts, click "Trade", select your broker, and log in
– Start trading: Place orders directly from the chart
Tip: If you're new to trading, try paper trading first — it lets you practice strategies in real market conditions without risking funds.
You can trade BANKNIFTYF2024 directly from TradingView:
– Choose a broker: Explore our supported trading partners and pick one that fits your needs
– Compare options: View available brokers side by side to evaluate fees and features
– Connect your account: Open Supercharts, click "Trade", select your broker, and log in
– Start trading: Place orders directly from the chart
Tip: If you're new to trading, try paper trading first — it lets you practice strategies in real market conditions without risking funds.
The nearest expiration date for BANKNIFTYF2024 is Jan 25, 2024.
Futures contracts expire on predetermined dates. As expiration approaches, many traders roll positions into the next contract to maintain exposure to the market.
Key metrics to watch near expiration:
• Volume and liquidity: Trading activity often shifts to the next contract month
• Open interest: Falling open interest may signal positions being closed or rolled forward
• Forward curve: Differences between contract prices can help identify market structure, including contango and backwardation
Explore the BANKNIFTYF2024 chart to monitor active contracts and contract-month activity.
Futures contracts expire on predetermined dates. As expiration approaches, many traders roll positions into the next contract to maintain exposure to the market.
Key metrics to watch near expiration:
• Volume and liquidity: Trading activity often shifts to the next contract month
• Open interest: Falling open interest may signal positions being closed or rolled forward
• Forward curve: Differences between contract prices can help identify market structure, including contango and backwardation
Explore the BANKNIFTYF2024 chart to monitor active contracts and contract-month activity.