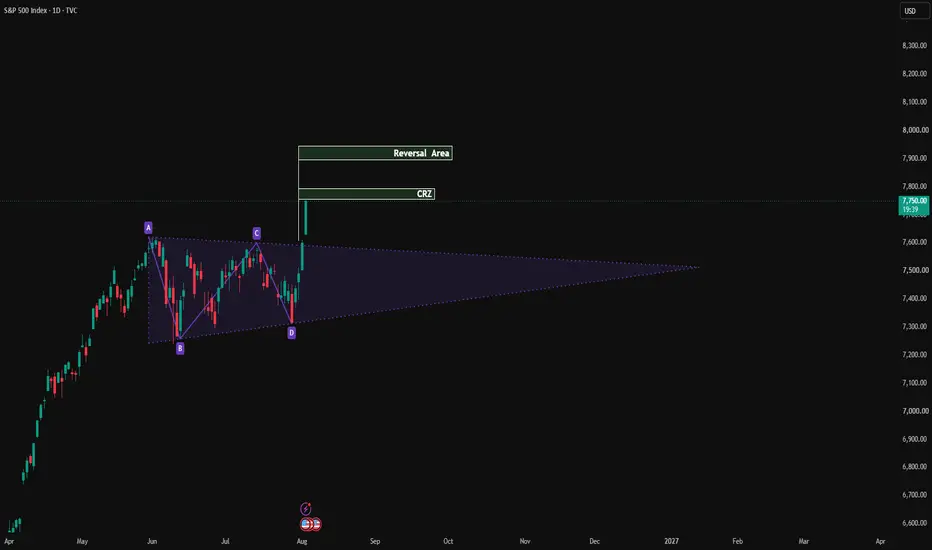
$SPX Hits New ATH, A Big Move Incoming ! SPCFD:SPX Was Trading Under A Bullish Pennant And Currently SPCFD:SPX Gave A Clear Breakout In Gap-Up Opening, There's No Resistance As SPCFD:SPX Is Hitting New All Time High, So What We Can Do?
We Can Expect A Short Pullback Either From CRZ Or From Reversal Zone, Both Levels Are Marked On Cha
US 500 CASH
No trades
No trades
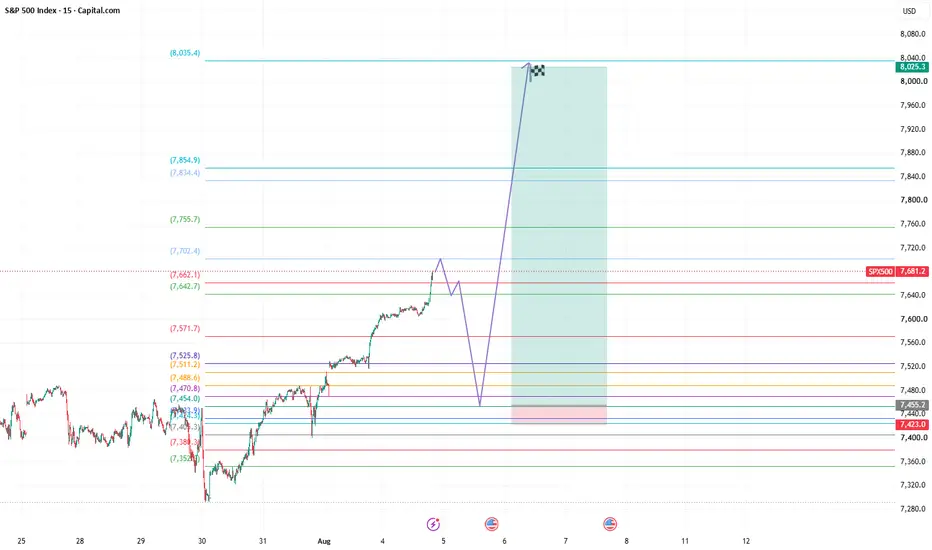
SP500 Bullish Rebound & Long SetupTrading Idea Description
Asset: S&P 500 (SPX500)
Direction: Long
Strategy: Expecting a short-term pullback toward the support level around 7,455, followed by a strong impulsive breakout targeting the upper resistance level near 8,025.
Risk Management: Stop loss is set below support at 7,423.
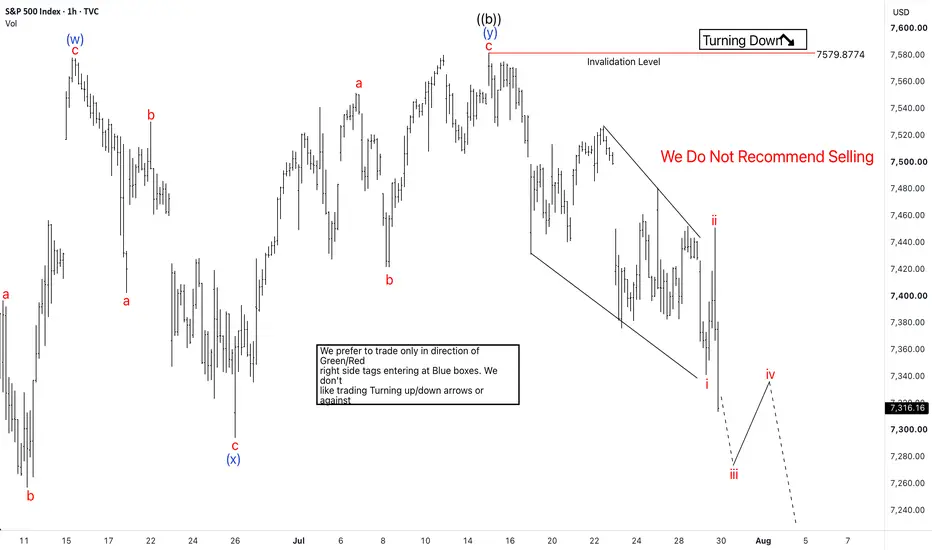
SPX Pullback Targets 7193–6953 Before Another BounceThe S&P 500 (SPX) is currently correcting the strong advance from the 6317 low to the 7620 peak in wave 2. Based on the current Elliott Wave structure, the index appears to be forming a flat correction. Sub-waves ((a)) and ((b)) look complete, and SPX is now progressing lower in the final five-wave
SPX: Bearish Rejection & Potential Pullback to SupportSPX: Bearish Rejection & Potential Pullback to Support 📉
Description:
The S&P 500 (SPX) is showing signs of a bearish rejection at the upper supply zone on the 1-hour timeframe. After failing to sustain momentum above the recent high, the price has initiated a downward move, breaking below immediat
SPX 1H Reversal Setup| Market Footprinting Trading ConceptAnalysis
The SPX 1-hour chart is approaching a critical decision point where the ACS (Advance Consolidation Structure) Theory, a core component of the Market Footprinting Trading Concept™, highlights the possibility of a triangle fakeout before the next major directional move.
Price has been compr
S&P 500 fell in five wavesI am not saying this will happen, but I am weighing it since we did see a five-wave decline in wave A earlier. Since then, we have not made a new high. The entire structure can look like a triangle in wave B if we do not cross 7560. That is the line in the sand. This is not a conclusion but a possib
The Psychology Behind FibonacciAsk ten traders how they identify potential reversal zones, and chances are several of them will mention the Fibonacci Retracement tool.
Whether they trade stocks, forex, cryptocurrencies, or commodities, Fibonacci levels appear on charts across every financial market.
This naturally raises an int
S&P 500: Is the correction already over?After an impressive rally from the April lows, the S&P 500 has entered a period of consolidation rather than a full-scale reversal. Despite the recent pullback, the broader market structure remains constructive, and buyers continue to defend key support levels. The index remains the benchmark for gl
See all ideas
Displays a symbol's value movements over previous years to identify recurring trends.
Frequently asked questions
US 500 CASH reached its highest quote on Aug 13, 2026 — 7,814.93 USD. See more data on the US 500 CASH chart.
The lowest ever quote of US 500 CASH is 3,763.20 USD. It was reached on Dec 22, 2022. See more data on the US 500 CASH chart.
US 500 CASH is just a number that lets you track performance of the instruments comprising the index, so you can't invest in it directly. But you can buy US 500 CASH futures or funds or invest in its components.