Do Humans Still Use This Site?I'm wondering if people still use this site, and specifically read my posts?
60% or so of my comments are clearly bots. I've ran a LLM detection analysis on the Top/Popular ideas page on various different weeks with it routinely returning 80-90% of it is LLM content, and most of that is no effort
US 500 CASH
No trades
No trades
The History of Quant Trading Centuries ago, back in 2023 (man, time flies fast around here), I did a post on the history of the S&P using SPX to illustrate key moments in history, from the 1900s to the current day of 2023, you can read it here.
This was one of the biggest posts I had done that required the most amount of res
S&P500 The '1W MA100 correction Rule' that calls for 6800.S&P500 (SPX) has been trading on a very consistent and structured pattern since 2022, which involves around the 1W MA100 (green trend-line). As you can see, since the 2022 Bear Cycle, the index has periodically corrected back to its 1W MA100 and the use of the Sine Waves mark almost exactly those pu
SP500 15M CHART PATTERN📊 The SP500 15-minute chart is approaching a critical decision zone around 7,750, which remains the key level for the next directional move. 🟢 Holding above 7,750 would keep the short-term structure bullish and support a continuation toward the bullish target at 7,802.
Buyers need to defend this l
SPX500 | CPI in Focus as the Market Waits for a Breakout
The S&P 500 ended Monday nearly unchanged as investors balanced renewed uncertainty surrounding U.S.-Iran negotiations against optimism that the Strait of Hormuz could eventually reopen, easing pressure on oil prices and inflation.
Market sentiment remains supported by strong second-quarter earni
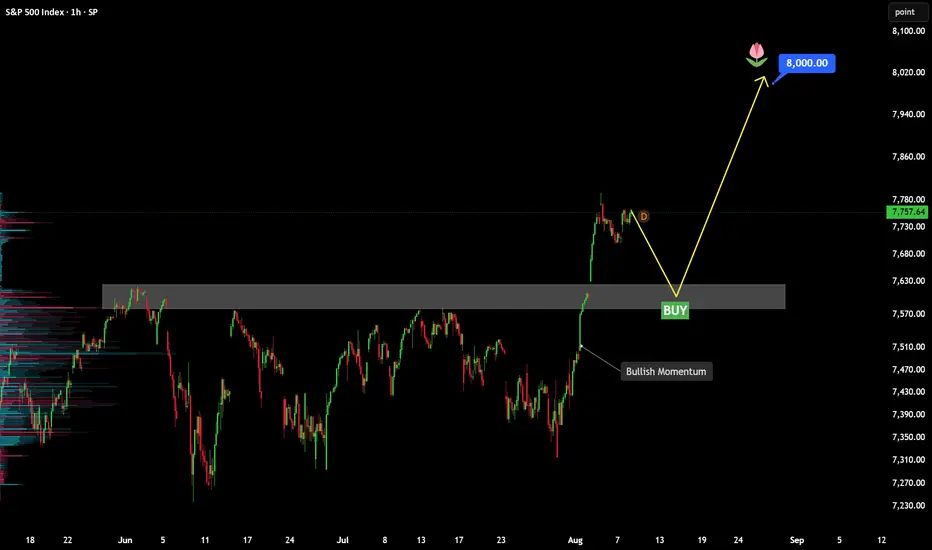
SPX500 – Breakout Retest Setup With 8,000 in Sight📊 SPX500 – Breakout Retest Setup With 8,000 in Sight
🔍 Market Overview
SPX500 has finally broken above a resistance zone that repeatedly capped price throughout the previous range. The move was not subtle either. Buyers pushed through with strong momentum and quickly established price above the old
SP500S&P 500 is showing signs of rejection near a well-defined resistance zone around 7,840–7,880 after a strong bullish move. Price is currently consolidating below resistance, while the rising trend structure is showing signs of weakening.
As long as price remains below the major resistance zone, the
S&P500 INDEX (US500): Confirmed Breakout
US500 Index looks bullish too.
The price violated the horizontal neckline of the ascending triangle pattern on a daily time frame.
It indicates a highly probable trend continuation.
Next goal - 7850
❤️Please, support my work with like, thank you!❤️
I am part of Trade Nation's Influencer pro
Hellena | SPX500 (4H): LONG toward the 7843.70 resistance area.It has been quite some time since my last SPX500 update, but the chart is now presenting an interesting setup. The index remains within a broad bullish structure, and the latest strong upward impulse suggests that the advance is probably not complete yet.
According to the current wave count, the pr
S&P 500 at a Major PRZ: New ATH or Deeper Correction?The S&P 500 ( CAPITALCOM:SPX500 ) rallied after the probability of an agreement between Iran and the United States increased, allowing the index to print a new All-Time High(ATH).
However, the rally over the past week has been accompanied by relatively low trading volume, which may indicate weaken
See all ideas
Displays a symbol's value movements over previous years to identify recurring trends.
Frequently asked questions
US 500 CASH reached its highest quote on Aug 13, 2026 — 7,814.93 USD. See more data on the US 500 CASH chart.
The lowest ever quote of US 500 CASH is 3,763.20 USD. It was reached on Dec 22, 2022. See more data on the US 500 CASH chart.
US 500 CASH is just a number that lets you track performance of the instruments comprising the index, so you can't invest in it directly. But you can buy US 500 CASH futures or funds or invest in its components.