$HIMS: starting a 5-wave sequenceNYSE:HIMS : I'm counting a 5-wave sequence starting from November low of $32.88. I see a clear 5-wave pattern from that low going to Nov. 28 high of $39.xx. Wave 2 started there.
Wave 2 so far has retraced just shy of 61.8% retracement. For a Wave 2, 50%-61.8% retracement are quite common and normal. However, it could retrace 99% of Wave 1.
If $32.88 is taken out, then this count is invalidated and NYSE:HIMS has not completed the major degree level consolidation.
If Wave 2 ended at today
AB=CD
Selling AUD USD after measured move up. RR 2.5 Measured move in lovely swing leg moves in the AUD USD Currency pair. Selling short here with a RR of rouchly 2,5 with a conservative target and a stop above round number and old high. The trading range action around the entry here suggests that a reversal could be likely.
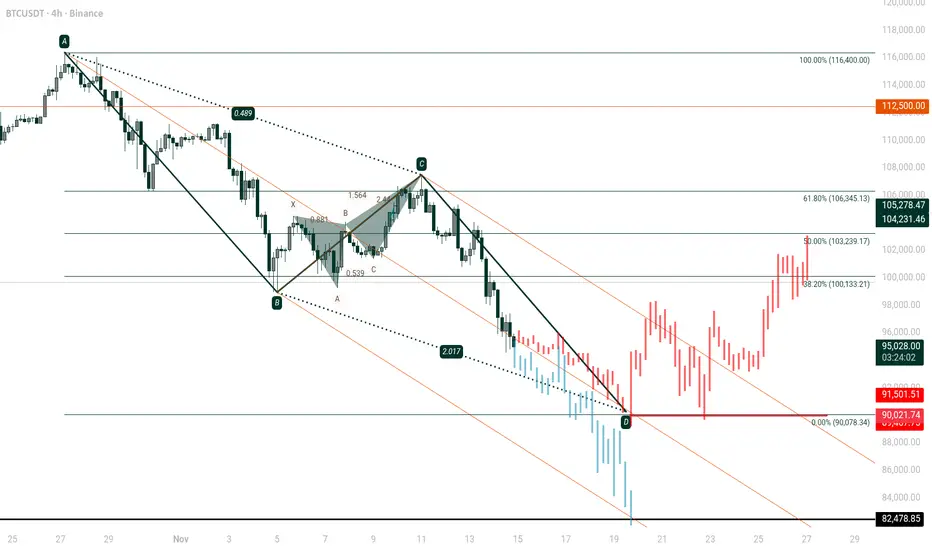
BTC 1W Bearish AB=CD harmonic, pt1=74200, pt2=48785BTC is in a bearish AB=CD harmonic pattern, heading to first price target at 74200. Expecting bullish retracement at that level before continuation to pt2 at 50000.
TOTAL crypto market cap is in a similar pattern, with loses projected to be > 2.4T USD.
EURUSD - why am I bearish on the priceWell, thank you for commenting on my ideas on EURUSD. This is what makes the TradingView community unique.
In one of the comments I learned that I am agains the mainstream believing that EURUSD is not going to continue growing (will not hit the next max after 1.19191 on Sep 15th). In this post I would like to provide arguments for which I am bearish in EURUSD, yet keeping in mind that those are just my humble opinions and as such they can be completely wrong.
So, let's do that:
Argument #0 -
$MSTR: AB = CD is around $145NASDAQ:MSTR completed Wave in Nov 2024 and has been in Wave correction since. Elliott Wave theory states that often the correction will enter the zone of Wave 4 of one lesser degree, i.e., Wave III-Wave IV area of Wave . This corresponds to $200 in March 2024 and $102 in August 2024 (a 50% drop for Wave IV!).
Presently, MSTR at $172 already entered the top of that zone., AB = CD for the flat correction gives $145, which is right in the middle of this zone. $145 also is just above the 78.
S&P 500 dip-buying setup?Keep an eye on this technical setup; I watch it closely, and it has proven to have a good track record. As you can see from the charts below, the VIX has closed north of the upper Bollinger Band (set to 2 standard deviations), and the daily price of the S&P 500 recently formed an AB=CD pullback to 6,594. This technical confluence often delivers a dip-buying opportunity.
Written by FP Markets Chief Market Analyst Aaron Hill
AB=CD Harmonic pattern on EURJPY: CAN THE SHORT BE FOR LONG?Recent push by EURJPY into higher highs have formed a AB=CD harmonic pattern on that indicates a potential reversal. As like every trading strategy that comes with pros and cons, it is best to trade with sufficient SL as the trade is a potential interest to me
BTC Weekly Update | Still in Uptrend – Next Target 140K to 150KIn the start of 2025 (10 Feb), I shared a #BTC analysis when Bitcoin was trading around 95K, and our buying zone was clearly mentioned between 86K – 79K.
#BTC perfectly touched this zone and gave over 100% return!
Our position is still active and in strong profit.
Now, once again on the weekly timeframe, #BTC is showing a potential AB=CD pattern formation.
Currently, #BTC is moving within the Fibonacci golden zone (0.382–0.5), testing the trend line, and testing the EMA 50, theses are strong te
Watching the US$3,886 low closely right now!Whether Gold can hold onto its recent momentum is difficult to predict given the market uncertainty right now.
Not only is it a 50/50 bet whether the Fed pulls the trigger and cuts rates next month, but no one actually knows what US data we will be getting in the coming weeks, now that the US government shutdown has ended.
Additionally, it is still unclear when we will receive the data. September’s numbers will likely filter through next week and give us more of an idea of sentiment, but Oct
AUDCAD – 2618 Trading Strategy + 3-Bar Reversal ConfirmationThis setup is a textbook example of the 2618 trading strategy combined with a strict 3-Bar Reversal trigger for entry.
First leg: Market breaks structure, taking out prior lows.
Retracement: Price retraces back into the 61.8% Fibonacci level.
Confirmation: A 3-Bar Reversal forms, providing the entry signal.
Entry: Short position placed at confirmation of the 3-Bar setup.
Stops: Positioned above the retracement highs to protect against invalidation.
Targets: Measured at the 127.2% Fibonacci
Head and shoulders pattern Hi guys
Here is attached xau chart with 15 minutes time frame and the trading system show us the famous pattern as head and shoulders.
Please be careful to direct all the approvals sign for getting action
One of them is equally low points that happened nearly of 0.7 Fibonacci retracement
#XRPUSDT: Bullish Reversal Coming With Price Heading Back To 3.5## XRPUSDT Analysis: Long-Term Perspective
In the long term, we anticipate the XRPUSDT price to revert to its all-time high of 3.5. From a fundamental analysis standpoint, we maintain a positive outlook, with the potential for the price to surpass 3.5. We have identified a favourable trading opportunity, as illustrated in the chart.
Our approach is neutral, as the trend remains undecided. Based on the duration of your positions, you can set two targets:
1. **Short-Term Target:** If you intend
#BTCUSDT: From $74,000 to $88,000 Moving Well! More Growth CominIt’s been on a steady climb from $74,000 to $88,000. We’re expecting even more growth in the coming weeks. The price has finally broken free from its consolidation phase and is now on the rise. We think it’ll reach $94,000, then $100,000, and maybe even go up to $120,000 by the end of the year.
What do you think? Let me know in the comments below!
Thanks!
Team Setupsfx_
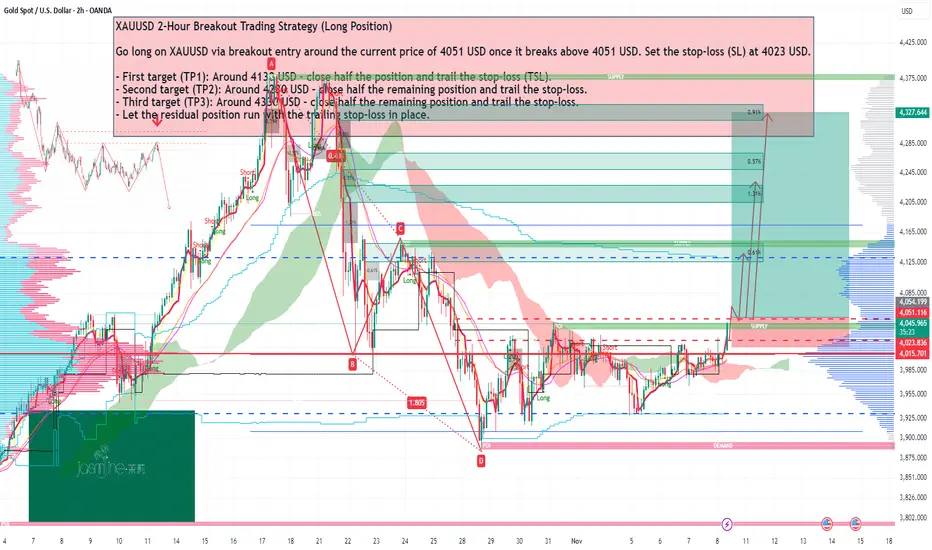
XAUUSD 2-Hour Breakout Trading Strategy (Long Position) XAUUSD 2-Hour Breakout Trading Strategy (Long Position)
Go long on XAUUSD via breakout entry around the current price of 4051 USD once it breaks above 4051 USD. Set the stop-loss (SL) at 4023 USD.
- First target (TP1): Around 4130 USD – close half the position and trail the stop-loss (TSL).
- Second target (TP2): Around 4230 USD – close half the remaining position and trail the stop-loss.
- Third target (TP3): Around 4330 USD – close half the remaining position and trail the stop-loss.
- Let
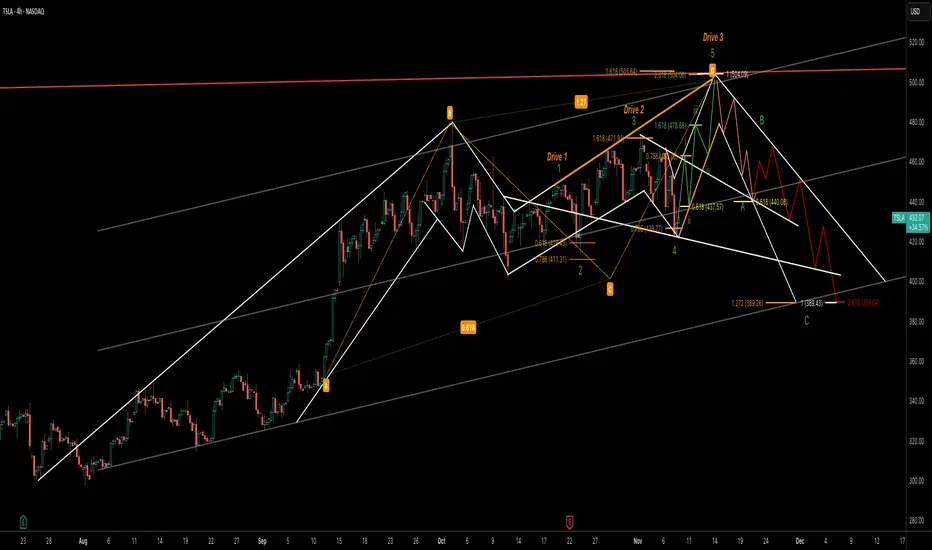
TSLA 3-Drive & ABCD Pattern – Path to $500 Before a PullbackThis chart highlights multiple harmonic and Elliott structures aligning for a potential bullish extension in Tesla (TSLA). A well-defined ABCD pattern and 3-Drive pattern suggest momentum building toward the $500 zone, supported by Fibonacci projections and channel resistance.
The current wave structure points to an imminent 5-wave advance, likely completing the “Drive 3” and pattern D confluence area near $500–505. Following that move, a corrective pullback (ABC) is anticipated, possibly retes