ADA Key Zone: 0.1679 ~ 0.1973
Hello, traders.
Thank you for following my analysis.
If you "Follow" me, you'll be able to receive new market updates as quickly as possible.
Wishing you successful trading today.
==================================================
* Key Zone: 0.1679 ~ 0.1973
* Key Volume Profile Level: 0.1813
* Upper Breakout / Support Confirmation: Around 0.1973
* Lower Breakdown Level: 0.1679
==================================================
ADA moved above 0.1971 but failed to establish support
Breadth Indicators
ETH: Can It Hold Support Around 1,861.57?
Hello, traders.
Thank you for following my analysis.
If you follow me, you can receive new market updates as soon as they are published.
Wishing you successful trading today.
==================================================
■ BTC and ETH: Similar Price Action, One Key Difference
=======================================================
BTC and ETH are the two major assets representing the crypto market.
Their price movements therefore have a significant influence on overall crypto marke
KEY QUESTION: CAN SPCX BREAK ABOVE 145.30 ~ 154.60?
Hello, traders and investors.
Follow me to receive the latest market analysis and updates as quickly as possible.
Wishing you a successful trading day.
────────────────────────────────────
▶ SPCX CHART
────────────────────────────────────
■ CURRENT MARKET STRUCTURE
────────────────────────────────────
Since SPCX has only a limited amount of trading history,
the support and resistance levels currently visible on the chart
may not yet have strong reliability.
Therefore, extra caution is re
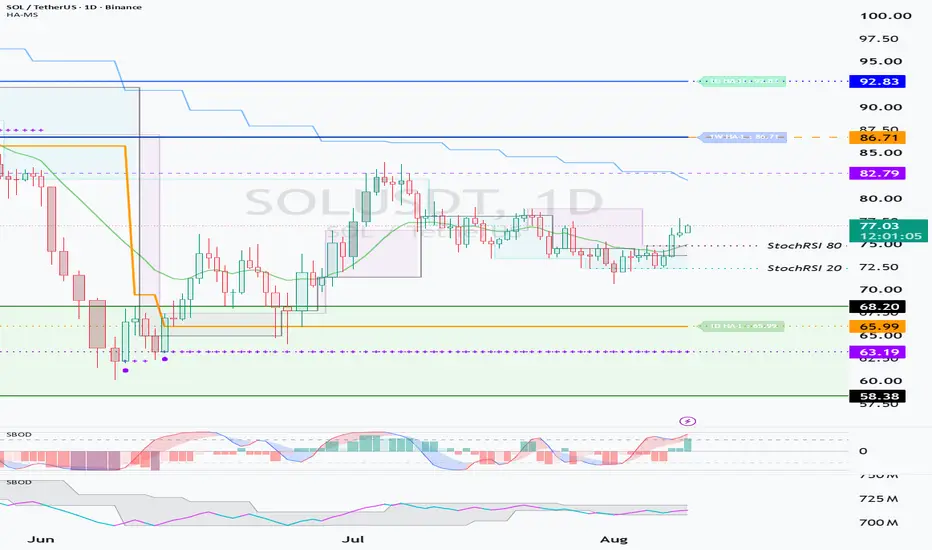
Building Momentum for a Move Above 82.79 Is the Key
Hello, traders.
If you follow me, you'll be able to receive new market updates and analysis as soon as they are posted.
Wishing you a successful trading day.
━━━━━━━━━━━━━━━━━━━━━━━━━━━━━━━━━━
■ SOL Key Support & Resistance Zone
SOL is currently trading near one of its most important support and resistance zones:
▶ 58.38 ~ 68.20
If SOL establishes solid support around this area, the probability of a medium- to long-term trend reversal could increase significantly.
On the other hand, i
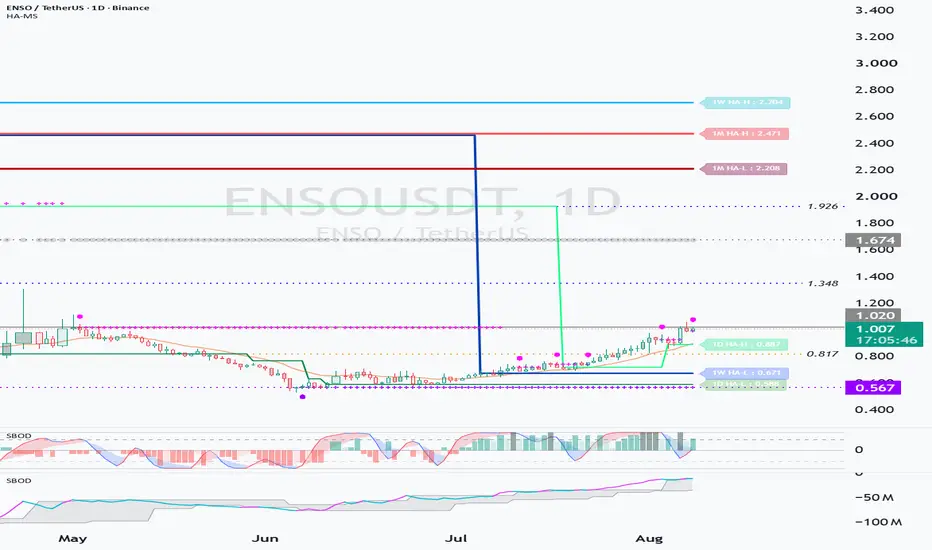
Key Volume Profile Level : 1.020
Hello, traders.
Follow me to get the latest market analysis as soon as it is published.
Wishing you successful trading.
==================================================
■ ENS - Key Level to Watch
ENS has moved up toward the key Volume Profile level around 1.020.
The most important question now is not simply whether ENS can break above 1.020, but whether it can:
"Flip 1.020 into support and hold above it."
If price confirms support around 1.020, the probability of another upside move
ETH Next Volatility Window: Around August 12 (Aug. 11-13)
Hello, traders.
Follow me to stay updated with the latest market analysis.
Wishing you successful trading.
============================================================
■ ETH VOLATILITY WINDOW: AROUND AUGUST 12
Following the end of BTC's short-term volatility cycle,
the next major volatility window to watch is ETH.
Expected volatility window:
▶ Around August 12
▶ Estimated range: August 11-13
ETH is currently attempting to rebound from its lower price zone.
However, for this move to de
The next volatility period to watch is around August 12th
Hello everyone,
Welcome back, traders.
Follow my profile to receive new market analyses as soon as they are published.
I wish you all successful trading today.
---
At the moment, Bitcoin appears to be approaching the end of its short-term volatility cycle around August 5.
Although Bitcoin's next major volatility window is expected around August 18, Ethereum's volatility window is projected to occur around August 12.
For that reason, it will be important to closely monitor the market begi
Semiconductor Index May Be StabilizingThe Philadelphia Semiconductor Index has pulled back sharply, but some traders may think it can bounce.
The first pattern on today’s chart is the rally between March 27 and June 22. SOX stabilized after retracing half the move, which may confirm the advance.
Second, SOX rebounded after probing below the May 19 weekly low of 10,896. Has support been established?
Third, stochastics are turning up from an oversold condition.
Finally, SOX has held its rising 100-day simple moving average (SMA).
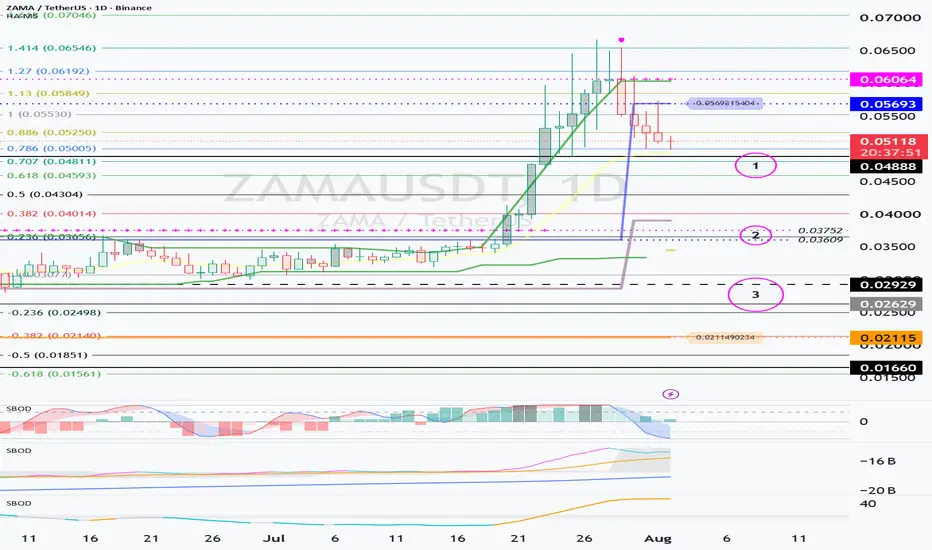
First Support Zone: Around 0.04888Hello.
Nice to meet you, fellow traders.
If you “Follow,” you can quickly check new chart analyses.
I hope you have a successful trade today.
━━━━━━━━━━━━━━━━━━━━━━━━━━━━━━━━━
ZAMA is a project that applies Fully Homomorphic Encryption (FHE) technology to blockchain.
The core of FHE is that smart contracts can perform computations even without decrypting the data.
In other words, it allows for the processing of necessary calculations and verifications on-chain without disclosing the ori
UNI(Uniswap): The Last Chance to Buy at the Bottom?
Hello, traders.
⭐ If you "Follow" us, you can receive new analysis and market trends quickly.
💰 We wish you successful trading today.
━━━━━━━━━━━━━━━━━━━
🔥 Is UNI preparing to break out of its long-term bottom?
UNI (Uniswap) is a representative DEX (Decentralized Exchange) in the Ethereum ecosystem.
With the DEX market growing steadily recently, it appears that UNI has also entered a position where it can once again attract attention from a long-term perspective.
━━━━━━━━━━━━━━━━━━━━
📈
Weekly Review: Market Intact, But Breadth No Longer ExpandingTLDR: The evidence still favors staying constructive, but expectations should shift. Rather than anticipating broad-based momentum, the market is increasingly rewarding stock selection and sector rotation. Momentum opportunities are likely to become more selective until breadth begins expanding again.
1️⃣ What is it today?
The market remains in an Acceptance regime. Volatility is calm, long-term participation is healthy, and price continues to respect its structural trend. However, the internal
Confirming Support at 1879.61
Support at 1879.61 and Breaking through the 1964.96 Line Are Key to Short-Term Trend Reversal
-----
Hello.
Nice to meet you, investors.
If you "Follow" us, you can receive new market analyses quickly.
We wish you a successful investment day today.
***
### Mid-to-Long Term Perspective
If the stock price remains stable above the 1,164.99 ~ 1,440.00 range, which was a major resistance zone in the past, it appears highly likely that the mid-to-long-term uptrend will continue.
However, it is
BTC Enters a Volatility Phase : July 27 – August 5
BTC Enters a Volatility Phase – Need to Monitor Short-Term Direction (July 27 – August 5)
---
Hello, traders.
If you "follow" me, you'll be able to receive new updates quickly.
Wishing everyone a great trading day.
***
BTC has officially entered a major volatility period (July 27 – August 5).
This phase is likely to unfold through three separate volatility waves:
* 1st volatility wave: July 27 – July 29
* 2nd volatility wave: July 30 – August 1
* 3rd volatility wave: August 3 – August
The Crypto Market Embraces Gold
Hello Traders,
Follow me to stay updated with the latest market insights and trading perspectives.
***
## Gold Is Now Trading On-Chain
Tether Gold (XAUt) is one of the leading Real-World Asset (RWA) tokens, designed to bring physical gold onto the blockchain.
Each XAUt token is backed 1:1 by one troy ounce (approximately 31.103 grams) of physical gold.
The gold backing XAUt is securely stored in Swiss vaults, and holders can verify the allocated gold through the platform.
While it is pos
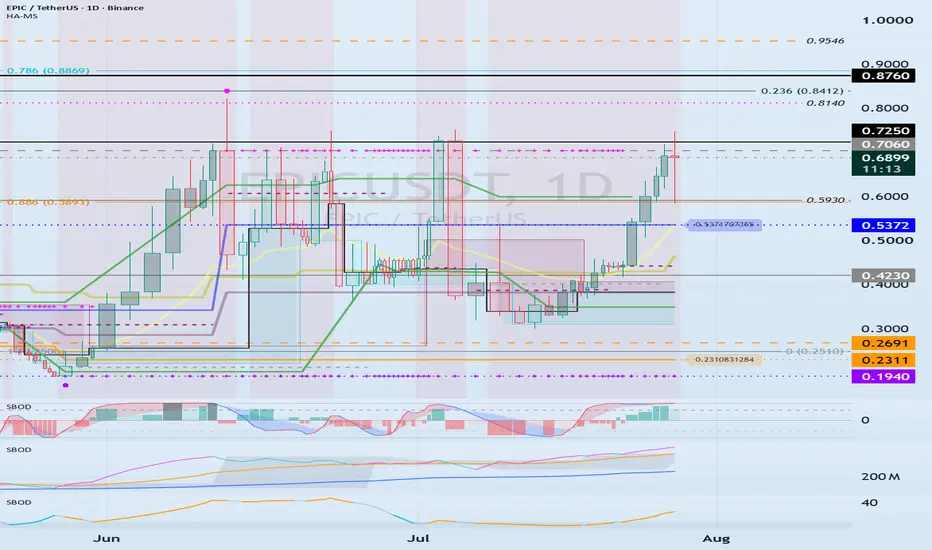
EPICUSDT Trading Strategy
Hello traders,
If you "follow" me, you’ll be able to get the latest updates faster.
Wishing everyone a great trading day.
***
EPIC is a project positioning itself around RWA (Real-World Asset Tokenization), entertainment, and AI-powered security & DRM solutions.
However, since the project has not yet been fully validated by the market, proper risk management remains essential.
***
The highest-probability trade setup is a breakout above the 0.8760–0.9546 resistance zone.
This area is curr
E
1.230 Support Is the Key Level to Watch
Hello, traders.
ORCA appears to have established a local bottom around the 1.230 level, making this area the most important support zone to monitor in the near term.
▶ Key Support Levels
- Primary Support: 1.230
- Major Demand Zone: 1.034 ~ 1.230
- Last Defensive Support: 0.800
If buyers successfully defend 1.230 and price starts pushing higher, the next critical area will be around 2.150, where a significant volume profile resistance zone is located. A breakout alone is not enough — holdin
Key Support Retest at 65.8K–66.3K
Hello traders,
If you follow my profile, you'll always get the latest market updates quickly.
Hope you're having a great day, and good luck in the markets!
-------------------------------------
BTC has successfully broken above the 65,776.47–66,323.12 range and is now pulling back to retest that zone as support.
If this area holds, the probability of further upside increases significantly.
However, StochRSI is currently attempting to enter the overbought zone, which could create some sho
Tokenized Stocks
Tokenized Stocks: A New Narrative That Could Reshape the Crypto Market
-----
Hello, traders.
If you want to stay ahead of the market and catch new insights quickly, make sure to follow.
Wishing everyone a profitable trading day.
-------------------------------------
As institutional adoption continues to accelerate, the crypto market appears to be maturing and becoming less volatile than in previous cycles.
With spot Bitcoin ETFs and increasing institutional participation, crypto is grad
SEducation
Next Volatility Period: Around August 14th
Hello?
Nice to meet you, fellow traders.
If you "follow" me, you can always get new information quickly.
Have a great day.
------------------------------------
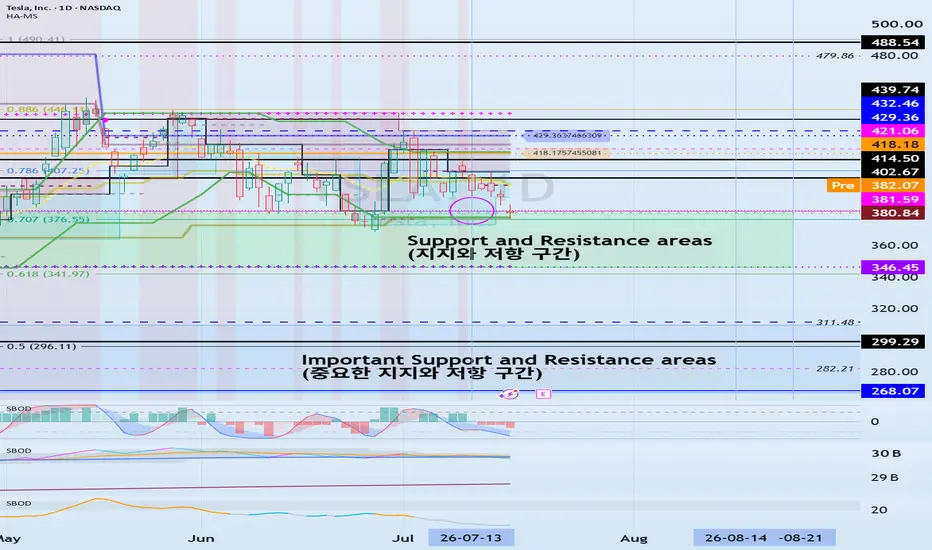
The price is showing signs of falling back into the 346.45 ~ 381.59 range.
Therefore, the key question is whether it can find support in the 346.45 ~ 381.59 range and rise. The important support and resistance zone is between 268.07 and 299.29, so you should prepare a response plan if the price falls below 346.45.
Therefore,
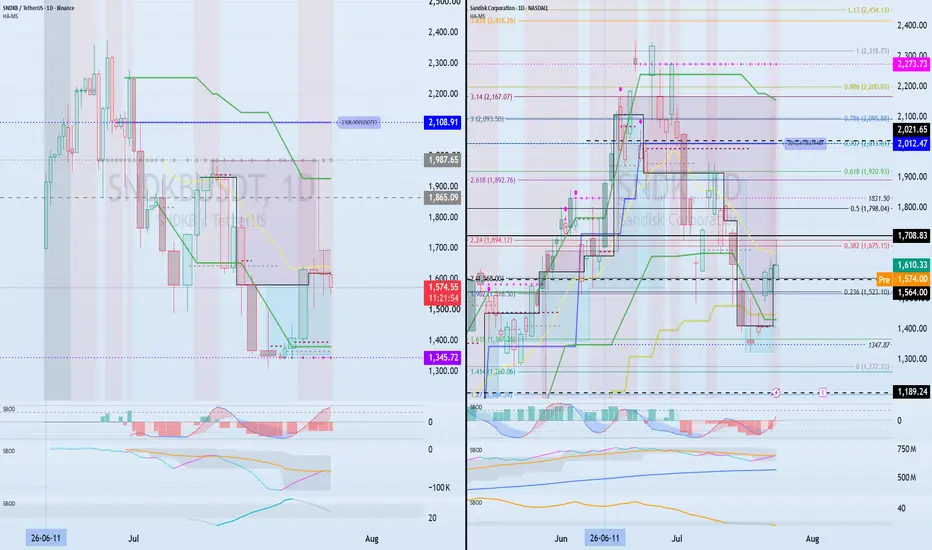
1st: 3
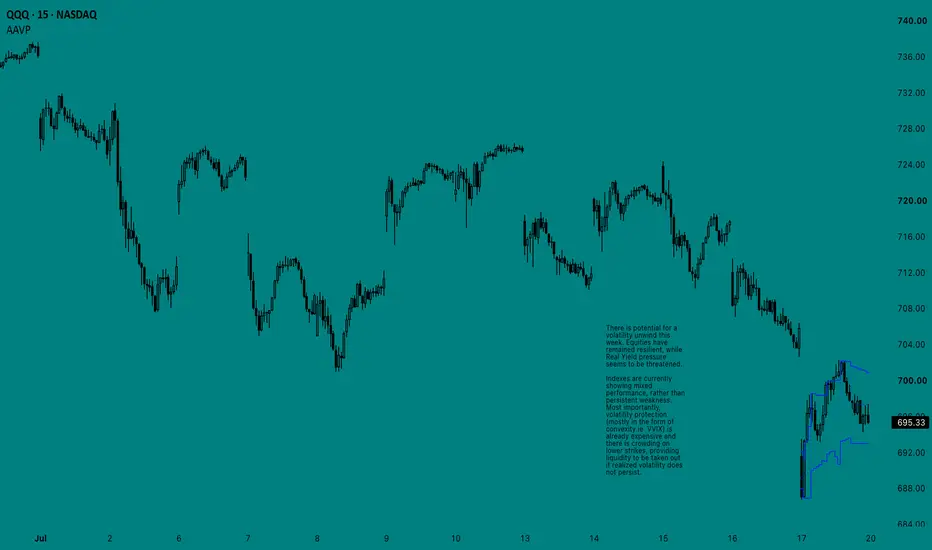
July 29th 2026 Market AnalysisThe market continues to show signs of inefficiency. Since my last post, Oil has regained lost ground and is climbing back towards the range. Since traders are digesting geopolitical risk, it is useful to look elsewhere to assess whether this may be a reversion back to the Supply Zone or if there is underlying risk-off positioning.
Equity prices are still high, having retreated slightly from ATHs, yet the Equity Risk Premium is extremely weak due to pressure from Real Yields. It is worth noting
Trend Reversal Level: 67,720.67
Hello Traders,
Follow for more market insights and technical analysis updates.
Wishing everyone a profitable trading day.
-------------------------------------
BTC is currently holding above the 1D HA-Low support level at 62,793.20 and continues to show signs of a potential recovery. As long as this support remains intact, the probability of maintaining the broader bullish structure continues to increase.
However, StochRSI is still pointing lower, suggesting that momentum has not fully sh
Build Your Trading Plan Before Entering the Market
Hello traders,
If you enjoy this analysis, make sure to follow for more market insights and trading strategies.
Wishing everyone green candles and profitable trades. 🚀
---------------------------------
One question always comes up in trading:
✅ Which coin should I trade?
✅ What criteria should I use to select a coin?
At the end of the day, consistent profits come not from perfect chart analysis alone, but from having a solid trading plan and sticking to it.
Before entering any position, y
0.3208–0.3242 Support Will Likely Determine the Short-Term Trend
Hello traders,
Follow for more market updates and trading insights.
Hope you all have a great trading day.
-------------------------------------
TRX is currently trading at a key technical area where multiple support and resistance levels overlap. The most important support zone is 0.3208–0.3242.
As long as this zone holds and buyers step in, higher targets remain on the table.
🎯 Key Upside Targets
1st Resistance: 0.3410–0.3445
2nd Resistance: 0.3657–0.3756
The main bullish signal will b
Key Supply Zone: 0.1679 ~ 0.1973
Hello, traders.
Follow for more ADA analysis, trade setups, and crypto market insights.
--------------------------------------------------
📈 ADA Monthly Chart (1M) Outlook
ADA is currently trading at a critical price zone that could determine whether a long-term trend reversal is underway.
The 0.1679 ~ 0.1973 range is a major supply zone where a strong bullish rally previously began after a successful breakout.
Going forward, the most important factor is whether ADA can break above this