Weekly Review: Acceptance (with emerging short-term stress)--- TradingView Chart Processed by TradeSentinel AI ---
The primary regime remains Acceptance, but this week introduced the first meaningful signs of internal pressure after several weeks of healthy participation.
The evidence is not yet consistent with structural deterioration, but it is no longer a one-sided expansion.
1️⃣ What is it today?
The market remains in an Acceptance regime, but this week introduced the first meaningful signs of internal fatigue. Price pulled back, volatility picked
Moving Averages
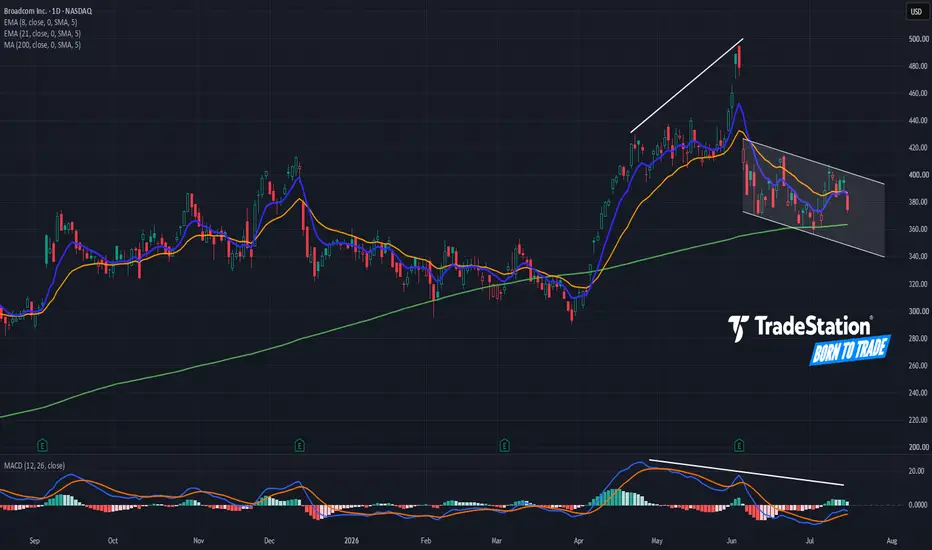
Broadcom May Be SlidingBroadcom began last month with a sharp selloff, and some traders may see further downside in the chip giant.
The first pattern on today’s chart is the June 4 drop following quarterly results. AVGO has remained entirely below that gap since, so it may represent a bearish reversal.
Second, the stock has made lower lows and lower highs since the decline. Does the resulting channel mark a new downtrend?
Third, falling MACD may reflect weak momentum. It also created potentially bearish divergence
Red Sea Tensions Push SPX LowerHello traders ☀️
Yesterday we saw a decent attempt to print a new ATH🚀, with the index reaching 7598 at the peak — just 27 points short of the projected target. It would’ve been interesting to see the acceleration that typically follows a breakout, but there’s always another opportunity.
In yesterday’s post, I also pointed out that we should never ignore the alternative scenario:
The bearish scenario remains unchanged. If those moving averages are broken with strong momentum, the next key su
(If) 62.5k Holds Again — Eyes Back on 65kHey traders!🌴
After yesterday’s failed attempt to establish itself above 65k, Bitcoin started a correction, initially not very convincingly but gradually gaining momentum 🔪
Yesterday I warned:
“If the correction gains momentum and starts breaking below both the 4H EMA 200 and EMA 100, the key support levels remain unchanged:
- 62,500 — Key support level where price has been consolidating since early June ✅
- 60,800 — Local horizontal support
- 60,000 — Strong horizontal support”
Unfortunate
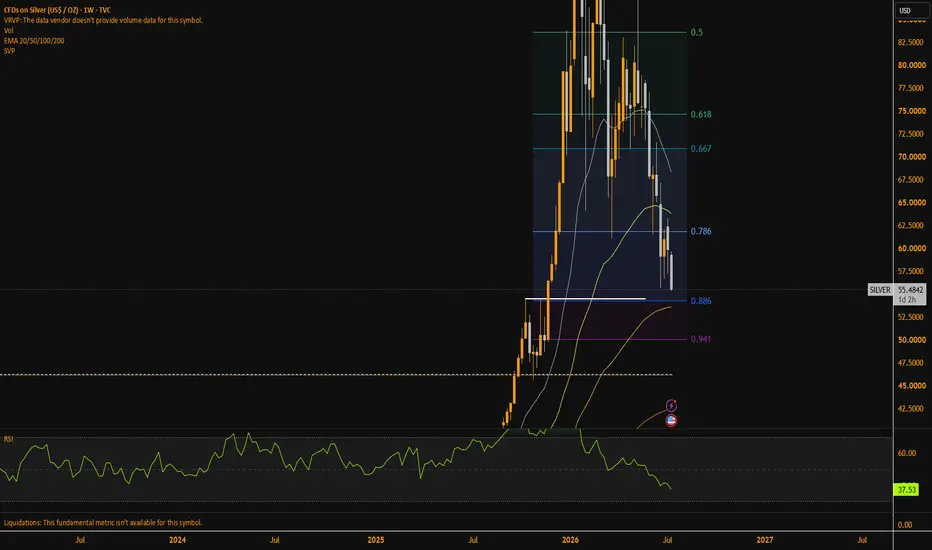
Silver Testing Major Confluence Support- Potential Weekly BounceSilver has now retraced approximately 55% from its all-time high. Despite several relief bounces along the way, each has failed and led to fresh lows, confirming ongoing selling pressure.
We are now approaching a critical support zone on the weekly timeframe with strong confluence:
100-week EMA
Previous highs around $54.40 (old resistance now flipping to potential support)
0.886 Fibonacci retracement of the swing low to ATH
Possible bullish RSI divergence forming on the daily chart
Whi
EUR/USD Holding Intact Despite Soft Inflation and Oil SpikeEUR/USD probed the top of its monthlong range on Wednesday, closing at a three-week high just below 1.1470, before easing back under 1.1450 through Thursday's U.S. session. The pair has largely absorbed this week's softer inflation prints and shrugged off the initial lift they provided, leaving it hemmed inside the roughly 1.1350 to 1.1450 band that has contained it for about a month. Rather than pressing the upside, EUR/USD has drifted back toward the middle of the range as the Dollar reasserts
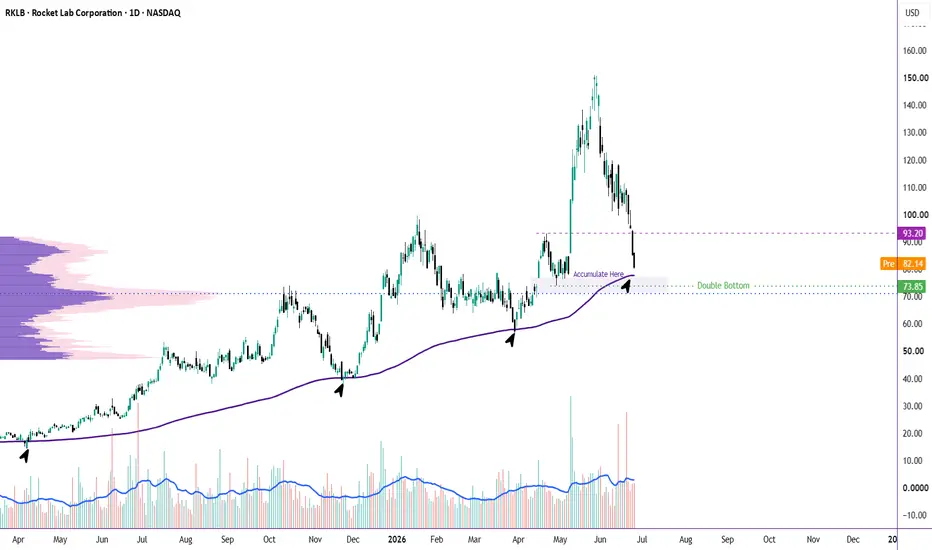
RKLB — EMA 200 Confluence Approaching | High-Value Accumulation Technical Setup:
After an extended rally, RKLB is pulling back toward a historically significant support zone between $73–77 — where the Daily EMA 200 converges with one of the most powerful confluence areas on the chart:
Point of Control (POC) — highest volume traded zone
Double Bottom structure
Prior swing low
Daily EMA 200 dynamic support
Historically, every time RKLB has revisited the EMA 200 on the daily timeframe, it has been a launching pad for the next major bullish leg — and there is
Sandisk (SNDK) LONG — 1D ALMA Setup (WR 85%)█ SETUP
Sandisk · BATS:SNDK · 1D · long only.
ALMA Averaging Strategy: ALMA 3 / σ2, SD band 2, min diff 1/1, 25% per bar, up to 4 adds, hard stop −10% from average entry.
Strategy Tester (SNDK 1D):
Win rate 85% · profit factor 14.1 · max drawdown 38%
Typical hold ~17×1D bars on winners · high-payoff memory-name mean-reversion template
═
█ WHY NOW
Tuesday US cash close — fresh 1D ALMA long on 08 Jul 13:30 UTC ~ $1,618 .
First lot on the daily template after a sharp drawdown from th
USA Rare Earth (USAR) LONG — 12H ALMA Setup (WR 77%)█ SETUP
NASDAQ:USAR · 12H · long only.
(Context: USA Rare Earth — Round Top TX mine-to-magnet · NdFeB magnets · US critical-minerals chain.)
ALMA Averaging Strategy: ALMA 3 / σ2, SD band 2, min diff 1/1, 25% per bar, up to 4 adds, hard stop −10% from average entry.
Strategy Tester (USAR 12H):
Win rate 77% · profit factor 2.6 · max drawdown 22%
Avg winning trade +33.8% · avg losing trade −8.9%
Typical hold ~15×12H bars on winners — US small-cap mean-reversion grid on the rare-earth sleev
Pre-Earnings Triangle in Tesla Tesla has been struggling all year, and now some traders may see risk of a break to the downside.
The first pattern on today’s chart is the tight range since July 2. The EV giant has made lower highs while remaining above roughly $390.50. That could be viewed as a bearish triangle, with potential for a move lower if support breaks.
Second, TSLA tried unsuccessfully to break its late-2024 high in December before making lower weekly highs. That may be consistent with a longer-term top.
Third, t
XLF - 50 SMA Breakout and Big Bowl Pattern💡 Swing setup idea
Big bowl pattern
🔎 Analysis summary:
The financial sector is moving above the 50 SMA and closing a large bowl pattern. We can also see strong, above-average buyers volume stepping in, which helps support the move.
👀 Levels to watch:
Entry trigger: Break above $56.50
Target: $65.35
Stop: Under the breakout level
💬 What do you think about XLF here? Let me know in the comments! 👇
Good luck!
⚠️ Note: This is for educational purposes only and is not financial advice.
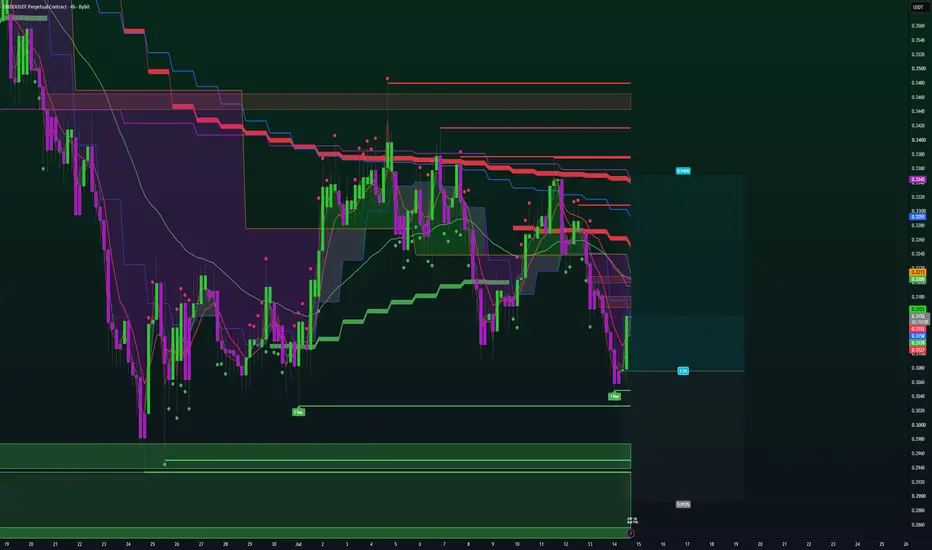
ONDO LONG — 4H ALMA Setup (WR 90%)█ SETUP
BYBIT:ONDOUSDT.P · 4H · long only.
(Context: Ondo Finance — tokenized Treasuries / RWA rails; trades with alt-beta and institutional DeFi flows.)
ALMA Averaging Strategy: ALMA 3 / σ2, SD band 2, min diff 6 bars to add / 1 bar to exit, 25% per bar, up to 4 adds, hard stop −10% from average entry.
Strategy Tester (ONDO 4H):
Win rate 90% · profit factor 9.1 · max drawdown 1%
Avg winning trade +7.1% · avg losing trade −3.7%
Typical hold ~23×4H bars on winners — RWA perp mean-reversi
First rejection from the 50d EMA As expected, BTC wicked above the strong resistance zone I highlighted (65k–66k area), tagged the 50d EMA + 0.786 Fib retracement, took out resting shorts, and got rejected.
Additional observations:
The significant buy wall at 63k has now disappeared → this could make further sell-offs easier.
On the heatmap, longs stacked between 60k–61k are starting to look vulnerable.
Short-Term Order flow observations:
Spot buying has paused for now
Some futures selling returning
Open Interes
Another Rejection at 65KHello, traders!🌴
Yesterday I mentioned:
"Although Bitcoin has been repeatedly testing the 65K area over the past 24 hours, we still haven't seen a convincing close above it. That means it's too early to consider this resistance broken."
As expected, 65K proved to be a tough🪓🪓🪓 level for the bulls and rejected price once again.
As of July 16, Bitcoin has fallen back below this resistance. However, as long as price remains above the 4H EMA 200, currently around 63,800, I view this pullback a
Sterling Clears 1.35 as Soft PPI Cracks the DollarGBP/USD rallied around 1% over the past seven hours, clearing both 1.34 and 1.35 within the same session to trade above 1.3550 by Tuesday afternoon. The move puts Sterling up more than 1.5% from this week's lows and marks the highest level since May 12. The pace and breadth of the advance stand out against a backdrop in which the U.S. Dollar largely shrugged off softer CPI data yesterday.
The rally reflects a combination of forces working in Sterling's favor. On the domestic side, fading U.K. p
DEI - 50 SMA Breakout and Cup & Handle💡 Swing setup idea
Cup and handle pattern
🔎 Analysis summary:
The stock moved above the 50 SMA and is closing a large cup and handle pattern. Buyers volume is also starting to step in, helping support the move, while the financial sector is showing strength overall.
👀 Levels to watch:
Entry trigger: Break above $12.80
Target: $16.56
Stop: Under the breakout level
💬 What do you think about this setup? Let me know in the comments! 👇
Good luck!
⚠️ Note: This is for educational purpos
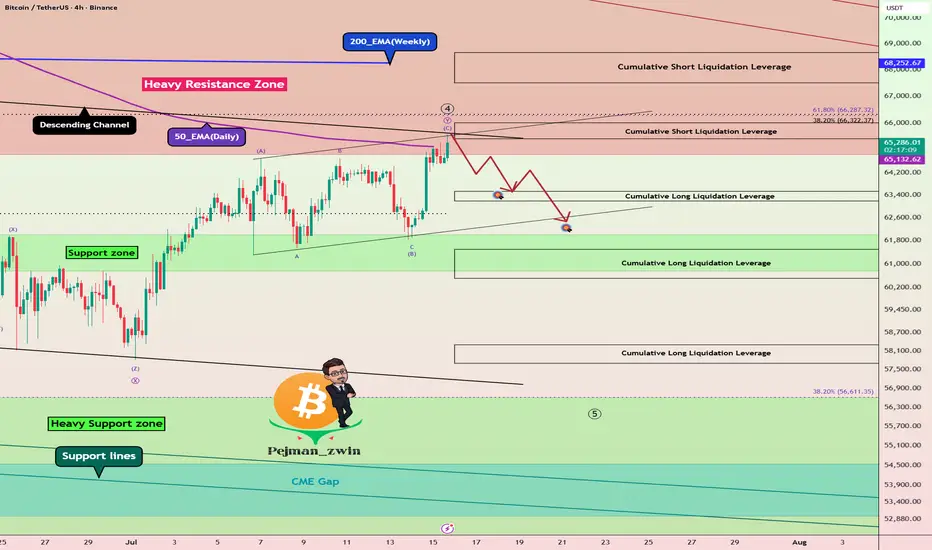
Bitcoin Rebounds After CPI—Can Bulls Reclaim the 200_EMA(Weekly)Yesterday, following the release of the U.S. CPI data , Bitcoin ( BINANCE:BTCUSDT ) rallied alongside Gold ( OANDA:XAUUSD ) and other financial assets. As a result, Bitcoin climbed back toward the heavy resistance zone ($76,600-$64,850), the 50_EMA (Daily), the upper line of the Descending Channel, and the Cumulative Short Liquidation Leverage($66,000-$65,420).
From an Elliott Wave perspective, Bitcoin still appears to be completing sub-wave C of sub-wave Y within the main wave 4. The overal
7555 Confirmed. Next Stop: ATH?Hello, traders!
Yesterday, after the pullback reached the 7500, I highlighted the following:
"The fact that the pullback is currently finding support at the 4H EMA 100 while also holding above the 1H EMA 100 and EMA 200 is clearly a bullish sign. For that reason, I expect another attempt to break through 7555 in the near future."
That scenario has now played out as expected. ✅Price has reached 7555 and is currently attempting to establish acceptance above this key level.
As I mentioned pre
Above 65K, the Path to 67,600 Is Wide OpenHello, traders!
Let's confirm that all targets from the scenario shared on July 13 have now been reached:
✅ 62,800–63,100 — Cluster of the 1H EMA 100 & EMA 200 and the 4H EMA 100
✅ 63,700 — 4H EMA 200
✅ 64,890 — Strong horizontal resistance formed during February–March 2026
💎With all targets achieved, it's time to define the next upside objective and update the key support and resistance levels.
Although Bitcoin has been repeatedly testing the 65k area over the past 24 hours, we still haven
BEN - Resistance Break and 50 SMA Support Retest💡 Swing setup idea
50 SMA support retest
🔎 Analysis summary:
The stock broke above resistance and came back to retest the 50 SMA as support. Buyers are also starting to step in, which keeps this setup constructive.
👀 Levels to watch:
Entry trigger: Break above $32.35
Target: $34.92
Stop: Under the support / 50 SMA
💬 What do you think about this setup? Let me know in the comments! 👇
Good luck!
⚠️ Note: This is for educational purposes only and is not financial advice.
BTC Short Setup triggered!-> $285.63M in short liquidations in the last 24h.
-> Almost the entire cluster at 65k has been taken out.
-> Price is now sitting right on the 50d EMA + 0.786 Fib retracement — an important key level.
->I can imagine that, especially given yesterday’s news, price might eventually push through… but this is still strong resistance for now and a pullback looks very possible. Overall I’m still expecting new lows for BTC.
-> This is definitely worth a try here. I’ve placed a wide stop at $66,200 be
$KMB - Darvas Box Consolidation & 50 SMA Breakout on High Volume💡 Swing setup idea
Bullish breakout
🔎 Analysis summary:
The stock is consolidating and forming a Darvas box pattern. It successfully crossed the 50 SMA with high volume, showing strong relative strength while the broader market is trending down.
🔔 Friendly reminder: The S&P 500 is currently trending down, so please keep the broader market weakness in mind before entering any new trades.
👀 Levels to watch:
Entry trigger: Break above $100.82
Target: $109.44
Stop: Break back into the box
GOLD SELL SETUP | 1H TIME FRAMEGOLD SELL SETUP | 1H TIME FRAME
Gold has broken below the key support level and is now approaching a potential retest of the resistance zone around 4035. If price rejects this area, it may present a selling opportunity in line with the current market structure.
Adding to the bearish outlook, the EMA 9 is crossing below the EMA 20, confirming weakening bullish momentum and supporting the bearish bias.
Sell Zone: 4035 (Resistance Retest)
Technical Targets:
- Target 1: 4025
- Target 2: 3991
-