Silver has gone from squeeze to swoonEarlier this year was all about the silver squeeze. Now comes the silver swoon, with the price slicing through a number of key supports over the past week. The latest to give way was the 200-day moving average, following an abrupt puke through the major uptrend that had been in place since August 2025.
The price now finds itself trading beneath $64.10, the low struck on February 6 at the tail end of the January-February rout. The only time that level has been tested since came in late March following another violent reversal, with the price initially trading beneath it before launching higher into the close. Given silver's history at $64.10, and the fact we have a major risk event later today in the form of the US inflation report for May, it presents as a decent level to build setups around.
To be clear, the message from RSI (14) and MACD is firmly bearish. The former is accelerating lower beneath 50 without being oversold, while MACD has already staged a bearish crossover and continues to diverge away from the signal line. Downside pressure is intensifying, favouring shorts over longs. And that's before you even consider the price action seen recently or the fact the price is now trading beneath each of its major medium and long-term moving averages, two of which are showing signs of curling lower. It just screams heavy.
But we know silver can turn around on a dime, reflecting the fact it's now right up there with the most volatile, readily traded risk assets you can find. Long gone are the days of it being a sleepy industrial metal or jewellery item living in the shadow of gold. It has morphed into a hyper-speculative trader's market.
As such, while the message from the technicals screams sell in search of more substantive mean reversion, I want to see how the price trades around the inflation print first. Should the details confirm or add to hawkish Fed pricing, which has been fuelling US dollar upside recently and hammering dollar-denominated commodities, a close beneath $64.10 would generate a decent entry level for shorts, allowing positions to be set with a tight stop above for protection. Initial downside targets include $58.85, $54.48, $49.30 and $46.00, with the first two coinciding with significant former bullish breakouts.
Should the latest lurch lower end up being a bear trap, with the price reversing back above $64.10 and closing there, the option is available to set countertrend longs looking initially for a retest of the 200DMA overhead, with former support at $70.90 another option should the move really get going. It's not the preferred setup given the technical picture, or my fundamental view that today's inflation report is unlikely to meaningfully curtail Fed hiking bets, but you can never say never with silver this year.
Good luck.
DS  Short
Short
 Long
Long
 Long
Long
 Long
Long
AMC Entertainment Holdings | AMC | Long at $2.99Technical Analysis
The price of NYSE:AMC is nearing a reconnection to my selected historical simple moving average bands (see dotted line extensions). This is likely to happen before January 2026 - or very shortly thereafter. The last time this initial connection occurred was in January 2021 (and we all know what happened after that...). I do not believe history will repeat like in 2021. But... Taylor Swift.
Catalyst
Taylor Swift’s movie, ‘Party of a Showgirl’, is set to be released via AMC Theatres on Friday, October 3rd - the same day as her new album. As a result, AMC will receive a lot of media attention. This may be the quick boost the company needs to get the price moving up again due to "record setting" attendance (or whatever the media says to make it appear successful).
Warning: There is nothing fundamentally good about AMC. High debt, unprofitable, poorly managed, liquidity increases, rug pulls, and social media charlatans telling everyone this is a "worthy" investment. It's worthless. So are my views. Sometimes, though, bad companies soar. Time will tell here.
Thus, at $2.99, NYSE:AMC is in a personal buy zone purely based on technical analysis and the Taylor Swift movie release / AMC media hype.
Targets into 2026
$4.00 (+33.8%)
$5.00 (+67.2%)
 Long
Long
S&P 500 vs Dow Jones: Why the S&P Fell Harder — The Market WasToday’s move was not just another red candle.
Both the S&P 500 and the Dow Jones moved lower, but the S&P 500 showed more aggressive weakness. The candle was sharper, the support break was cleaner, and the reaction looked more unstable.
The Dow was weak.
But the S&P looked fragile.
For me, the reason is not only technical. It is structural.
The S&P 500 is a market-cap-weighted index. The largest companies have the strongest influence on its movement. In this market cycle, that means mega-cap technology, artificial intelligence, and semiconductor names carry a heavy part of the index behavior.
When this leadership is strong, the S&P looks powerful.
But when the same leadership starts to crack, the S&P can fall faster than expected.
The Dow Jones is different. It is made of only 30 companies and is price-weighted, so it does not react the same way to weakness in the AI and semiconductor trade. That is why the Dow also declined, but the move was less aggressive than the S&P.
The market was not selling everything equally.
It was selling the leadership.
On the S&P 500 4H chart, the key moment was the break around the **7,342–7,360** support zone. Price was already close to recent highs, so the market was vulnerable. Once this level failed, the move accelerated.
This is where selling becomes mechanical.
Support breaks.
Stops get triggered.
Late buyers exit.
Algorithms react.
Liquidity disappears.
Volatility expands.
That is why the candle became violent.
It was not only a normal pullback. It was a chain reaction after a crowded rally.
The Dow chart does not show the same level of technical damage yet. The move is negative, but not as clean as the S&P breakdown. For the Dow, I would watch the **50,400–50,500** area. If that zone starts failing, the weakness may spread more clearly.
But for now, the message is different:
The S&P is reacting like a concentrated momentum index.
The Dow is reacting like a weaker but less explosive traditional index.
Technically, the S&P 500 is now weaker as long as price remains below the broken **7,342–7,360** area. If price quickly reclaims this zone, the breakdown may turn into a bear trap.
But if this zone becomes resistance, then the chart is saying something more serious:
Buyers lost short-term control.
The bigger lesson is simple.
The S&P 500 may look diversified by name, but during AI-led markets, it can behave like a concentrated technology trade. When leadership rises, the whole index looks unstoppable. When leadership cracks, the whole index shakes.
Today’s volatility was not only about one red session.
It was a concentration test.
Too much weight.
Too much confidence.
Too much capital in the same leadership trade.
That is why the S&P 500 moved more aggressively than the Dow.
The market was not selling the whole economy equally.
It was selling the part of the market that carried the most expectation.
 Long
Long
 Long
Long
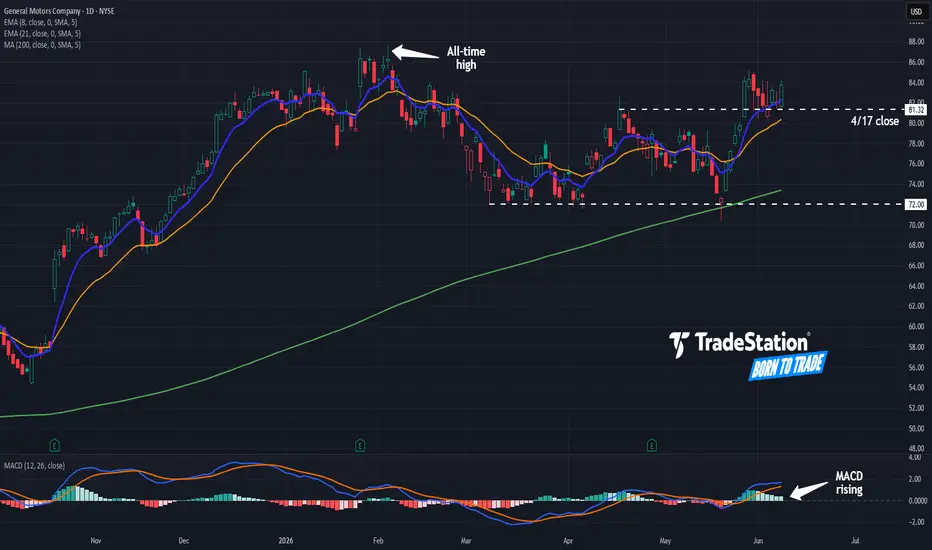
General Motors Could Be AcceleratingGeneral Motors has been rangebound for months, but some traders may expect a breakout.
The first pattern on today’s chart is the price zone around $72, which GM held in March and early April. It bounced there again last month, which may confirm support is in place.
Second, the bounce also occurred at the 200-day simple moving average (SMA). That could also reflect long-term bullishness.
Next, the automaker rallied above the April 17 weekly close of $81.32 and has spent more than a week above that level. Has old resistance become new support?
Finally, MACD is rising and the 8-day exponential moving average (EMA) is above the 21-day EMA. Those signals may reflect short-term bullishness.
TradeStation has, for decades, advanced the trading industry, providing access to stocks, options and futures. If you're born to trade, we could be for you. Learn more here about TradingView’s Broker of the Year!
Past performance, whether actual or indicated by historical tests of strategies, is no guarantee of future performance or success. There is a possibility that you may sustain a loss equal to or greater than your entire investment regardless of which asset class you trade (equities, options or futures); therefore, you should not invest or risk money that you cannot afford to lose. Online trading is not suitable for all investors. View the document titled Characteristics and Risks of Standardized Options at www.TradeStation.com . Before trading any asset class, customers must read the relevant risk disclosure statements on www.TradeStation.com . System access and trade placement and execution may be delayed or fail due to market volatility and volume, quote delays, system and software errors, Internet traffic, outages and other factors.
Securities and futures trading is offered to self-directed customers by TradeStation Securities, Inc., a broker-dealer registered with the Securities and Exchange Commission and a futures commission merchant licensed with the Commodity Futures Trading Commission). TradeStation Securities is a member of the Financial Industry Regulatory Authority, the National Futures Association, and a number of exchanges.
TradeStation Securities, Inc. and TradeStation Technologies, Inc. are each wholly owned subsidiaries of TradeStation Group, Inc., both operating, and providing products and services, under the TradeStation brand and trademark. When applying for, or purchasing, accounts, subscriptions, products and services, it is important that you know which company you will be dealing with. Visit www.TradeStation.com for further important information explaining what this means.  Short
Short
 Long
Long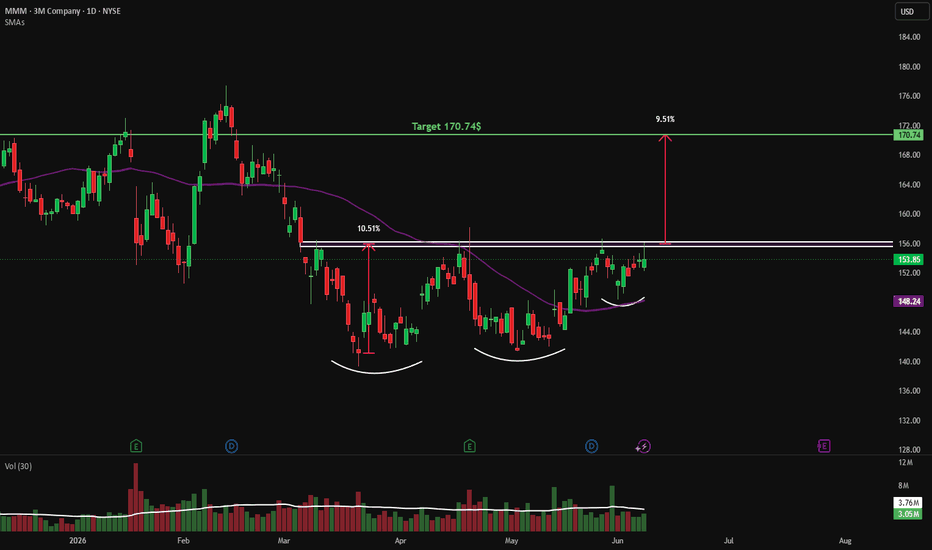
 Long
Long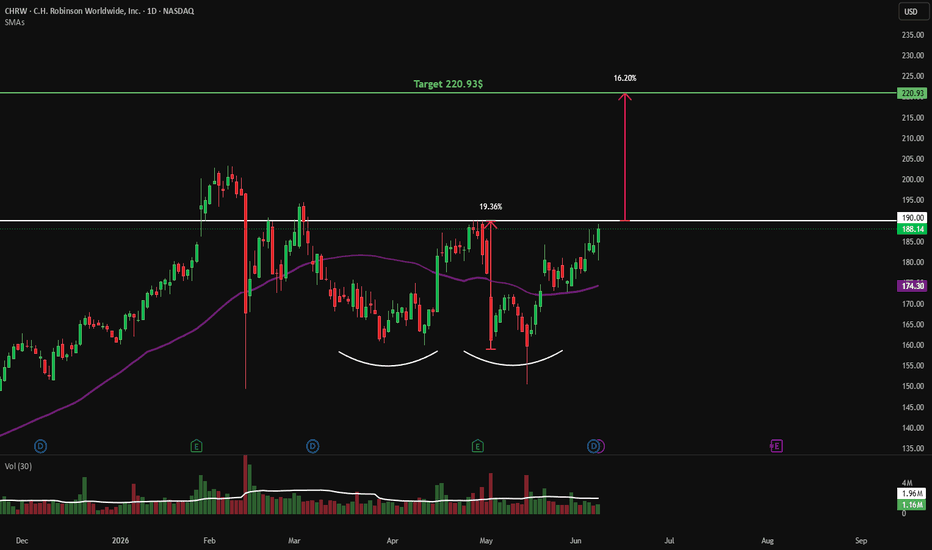
 Long
Long
Day 73 of 90 — Resistance Is Still Winning🛡️ Day 73 of 90 — Resistance Is Still Winning
XAUUSD | M15 | Sentinel Core | Sentinel Structure | Sentinel Companion
Situation
• Gold experienced a strong selloff from the 4,470–4,480 area.
• Sellers pushed price down toward 4,270–4,280.
• Buyers stepped in and created a recovery from the lows.
• Current price is trading around 4,315–4,320.
👉 Recovery is visible, but confirmation is still required.
What This Chart Shows
• Sentinel Structure currently remains Bearish.
• Price has recovered from the recent lows.
• EMA21 has been reclaimed and EMA50 is being tested.
• Price continues to struggle beneath the 4,340–4,345 resistance zone.
👉 Recovery shows strength. Confirmation proves direction.
🟦 Phase 1 — The Selloff
• Sellers controlled the market.
• Support levels failed one after another.
• Price dropped rapidly toward the 4,270–4,280 area.
• Bearish momentum dominated the session.
👉 Strong trends often accelerate after key support breaks.
🟩 Phase 2 — The Recovery
• Buyers defended the lower demand zone.
• Price started creating Higher Lows (HL).
• EMA21 was reclaimed.
• Momentum shifted from aggressive selling to recovery.
👉 Recovery begins when buyers stop the decline.
🟨 Phase 3 — Current Market Condition
• Price is testing resistance around 4,340–4,345.
• Buyers have reached the same resistance zone multiple times.
• Resistance continues to reject price.
• The market remains trapped beneath resistance.
👉 Repeated rejection is still rejection.
Key Lesson
Many traders see a recovery and assume buyers are taking control.
The problem?
The market only confirms strength when resistance breaks.
In today's chart, buyers had multiple opportunities to break 4,340–4,345.
They failed each time.
Until resistance breaks, sellers still control the bigger picture.
Momentum alone is not confirmation.
Execution Note (Sentinel Core)
• Watch support around 4,320–4,325.
• Watch resistance around 4,340–4,345.
• Wait for confirmation above resistance.
• Structure first → Confirmation second → Execution last.
🛡️ No confirmation = No trade.
Trend Summary
🔴 Sentinel Structure Trend: Bearish
💰 Current Price: 4,318
📈 Resistance: 4,340–4,345
🛡️ Support: 4,320–4,325
⚠️ Status: Multiple Rejections Beneath Resistance
Sentinel Principle
You do not trade the move.
You trade confirmed structure.
🛡️ Patience > Excitement
Series Note
Building consistency through observation, not prediction.
#XAUUSD #Gold #PriceAction #MarketStructure #SentinelCore #SentinelCompanion #Intraday #Scalping #TradingView WLD/USDT — Breakout Is Here, But Confirmation Still MattersWLD is finally showing the kind of move that changes the chart conversation.
For weeks, price was moving under pressure, with the major moving average acting like a ceiling above the market. Every recovery attempt looked limited because price was still trading below the main structure.
Now the situation is different.
WLD has pushed above the moving average and started building strength above the previous resistance zones. The most important part is not only the green candle. The important part is that price is trying to hold above the area that used to reject it.
This is what makes the breakout interesting.
When price breaks resistance, the first move usually attracts attention. But for me, the real test comes after the breakout.
Can price hold above the broken structure?
Can buyers defend the new support?
Can volume stay strong enough to prove that this is not only a short squeeze or one-day reaction?
The key resistance I’m watching now is around 0.5656.
A clean daily close above this area would make the breakout stronger and may open the door for continuation. In that case, the market may start treating the previous range as accumulation instead of weakness.
But if price rejects again from this zone and falls back below the breakout area, the move becomes less healthy. In that case, I would watch 0.4500 first, then the stronger support around 0.4096.
For me, the chart is simple:
Above 0.5656 = breakout confirmation improves.
Holding above 0.4500 = structure remains alive.
Losing 0.4096 = the breakout idea becomes weak again.
WLD has done the first important thing: it returned above the structure.
Now the next question is more important:
Will buyers protect the breakout, or was this only a fast move before another rejection?
I do not like chasing the candle after the move.
I prefer watching the retest.
Because real breakouts do not only break resistance.
They turn old resistance into new support. Long 
GoHealth | GOCO | Long at $6.05GoHealth NASDAQ:GOCO is a health insurance marketplace and Medicare-focused digital health company that uses a technology platform with machine-learning algorithms to match consumers with Medicare plans (Advantage, Supplement, Part D) and individual health insurance. Understandably, a lot of investors aren't bullish on this stock given all of the healthcare provider and services headwinds. However, if the company can overcome some of their financial issues and bankruptcy risk (debt-to-equity: 1.6x; quick ration of 1.1x, Altman's Z score of .3x), it may dominate the health insurance marketplace (but do not hold my word to that...). This is a purely speculative play at this point - those who are risk averse should absolutely stay away.
What truly caught my eye with this stock is that it is consolidating nicely within my historical simple moving average area. Often, but not always, this leads to a future change in momentum and propels the stock higher. It doesn't signal a bottom and there may be more room for it to plummet, but it is a bullish (overall) sign that shares are likely being accumulated by investors. Given the need for health insurance, particularly Medicare as the US / baby boom population ages, this is a company that may prosper IF it can get its financials in order.
Thus, at $6.05, NASDAQ:GOCO is in a personal buy zone (but very risky). Further declines may be ahead before a stronger move up.
Targets into 2028:
$10.00 (+64.5%)
$12.00 (+97.4%)
Bitcoin Reclaims Higher Range — What's Next?Hello traders!
In my previous post, I warned that after the consecutive breakdown of nearly all major support levels: “the next attempt at a bounce and consolidation would likely come from the 60,000 level.”
That is exactly how the market played out. We saw a strong reaction from 60,000, followed by a quick recovery not only back into the 60,000–62,500 range, but even one step higher — into the 62,500–64,890 range.
❗️📈It is now very important to watch how price behaves as it approaches 64,890. The reaction at this level should give us a good indication of the short-term direction.
• If we break above this level, the next target could be 67,600.
• If price gets rejected, we could fall back to 62,500 and potentially even revisit 60,000.
On the positive side, we have finally stopped forming lower highs and lower lows, which gives the bulls some room to breathe. On the negative side, there is a very clear bearish divergence on the 1-hour chart, which may require a cooldown before any further upside.
Peace everyone 🌄  Long
Long