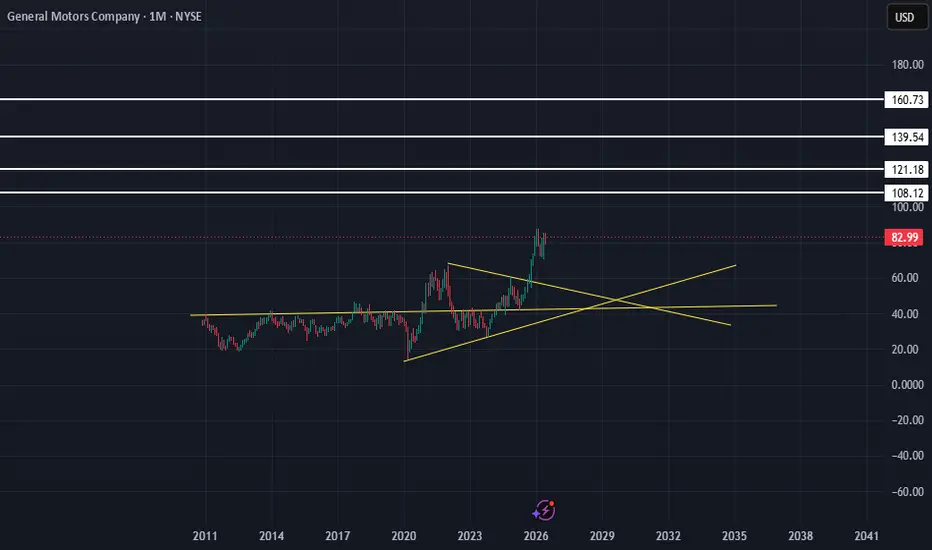
GM. Great Money on a more streamlined businessGM is a cash-generating, truck and SUV franchise.
Trading at a low valuation, aggressively shrinking its share count, growing software revenue, and no longer spending recklessly, on unprofitable EV ambitions.
1. Extremely cheap valuation
GM has often traded at a low single-digit or high single-d
Compare with General Motors Company
Key facts today
White House 50% tariffs on certain Canadian imports may hit GM: invested C$3.3B in Canada since 2020 (C$1.5B in Oshawa). Cross-border supply chains could raise costs and disrupt production. 1
GM says tariffs will hit results $2.5–$3.5B and inflation in materials, chips and logistics will shave $1.5–$2.0B from earnings. 1
2.58 USD
2.70 B USD
185.02 B USD
900.16 M
Next report date
—
Report period
—
EPS estimate
—
Revenue estimate
—
Profile
Sector
Industry
CEO
Mary Teresa Barra
Website
Headquarters
Detroit
Founded
1908
IPO date
Nov 17, 2010
ISIN
US37045V1008
CUSIP
37045V100
FIGI
BBG000NDYB67
Identifiers
ISIN US37045V1008
General Motors Co. engages in the designing, manufacturing, and selling of cars, trucks and automobile parts. It also provides automotive financing services through General Motors Financial Company, Inc. The firm operates through the following segments: GM North America, GM International, Cruise and GM Financial. The company sells vehicles under the Chevrolet, Cadillac, Baojun, Buick, GMC, Holden, Jiefang, Wuling, Maven, and OnStar brands. General Motors was founded by William C. Durant on September 16, 1908 and is headquartered in Detroit, MI.
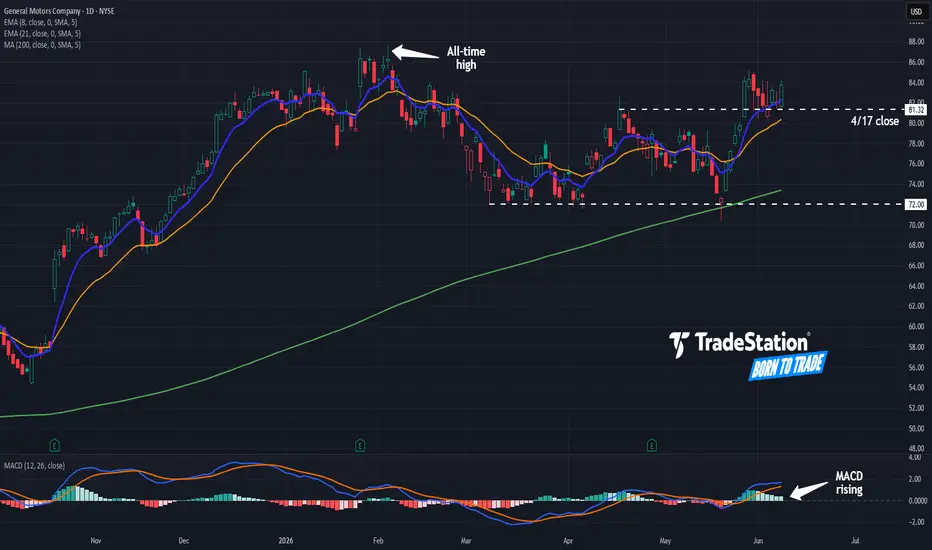
General Motors Could Be AcceleratingGeneral Motors has been rangebound for months, but some traders may expect a breakout.
The first pattern on today’s chart is the price zone around $72, which GM held in March and early April. It bounced there again last month, which may confirm support is in place.
Second, the bounce also occurred
$GM — Pennant Coil Under the HighNYSE:GM — Pennant Coil Under the High, Tariff Tailwind vs Strike Overhang (1D)
Structure: GM ran from the April $72 zone back to the premium, and after tagging the ~$85 local high it's been coiling in a tight pennant — higher lows pressing into horizontal resistance, volume compressing. Price $83.7
$GM Stock - bullish set up
NYSE:GM has broken out of a falling wedge pattern on the daily timeframe, a bullish technical signal that often precedes a strong upward move. The breakout suggests increasing buying momentum, with further upside expected in the coming sessions.
🎯 TP1: $87.62
🎯 TP2: $94.37
As long as the price
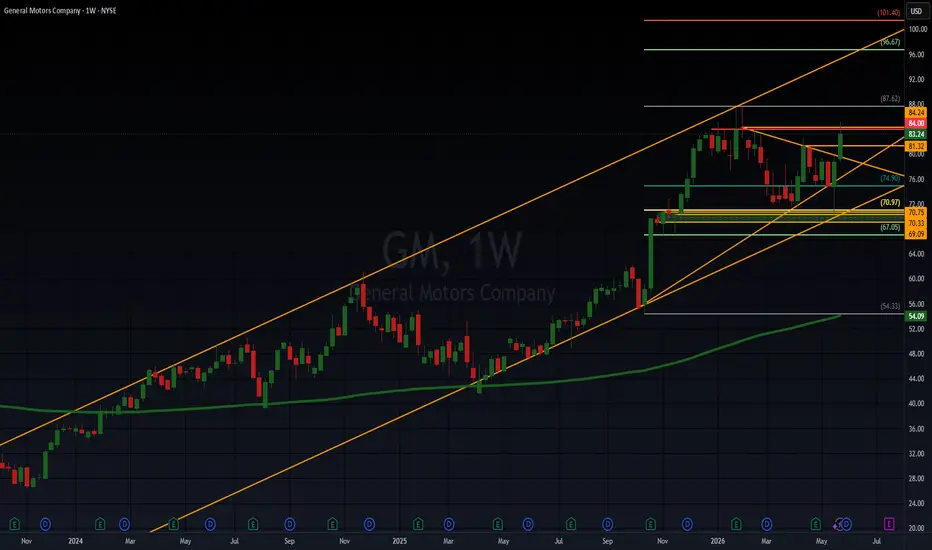
$GM Breakout Setup Targeting $100?NYSE:GM Coiling Beneath Major Weekly Resistance – Breakout Setup Targeting $100?
NYSE:GM continues to respect its long-term ascending channel while trading comfortably above the rising 200-week EMA, keeping the primary trend firmly bullish.
After the explosive breakout from the $54 region in la
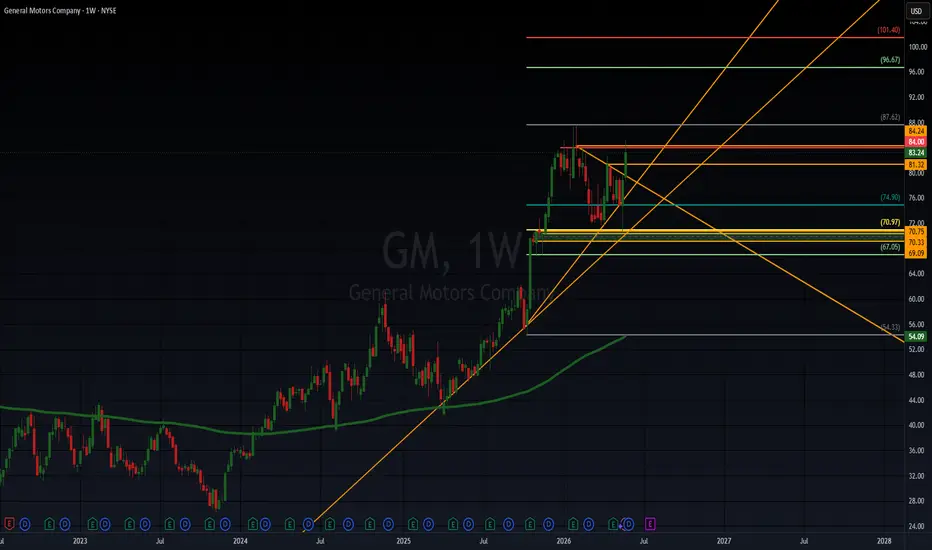
$GM Consolidating Below Resistance, Riding the Rising 200 EMANYSE:GM Testing Weekly Resistance While Holding Above the 200 EMA
NYSE:GM continues to trade within a strong long-term uptrend, maintaining a position well above its rising 200-week EMA, which remains a key indicator of underlying bullish momentum.
After its powerful breakout from the late-2025
GM showing short-term bullish momentum above $78.79Current Price: 78.79 (Analysis was generated on Monday Morning)
Direction: LONG
Confidence level: 45%(Professional trader snippets did not mention GM, but X sentiment shows bullish bias with 7 bullish posts and zero bearish signals. With limited multi-source confirmation, confidence remains modera
See all ideas
Summarizing what the indicators are suggesting.
Neutral
SellBuy
Strong sellStrong buy
Strong sellSellNeutralBuyStrong buy
Neutral
SellBuy
Strong sellStrong buy
Strong sellSellNeutralBuyStrong buy
Neutral
SellBuy
Strong sellStrong buy
Strong sellSellNeutralBuyStrong buy
An aggregate view of professional's ratings.
Neutral
SellBuy
Strong sellStrong buy
Strong sellSellNeutralBuyStrong buy
Neutral
SellBuy
Strong sellStrong buy
Strong sellSellNeutralBuyStrong buy
Neutral
SellBuy
Strong sellStrong buy
Strong sellSellNeutralBuyStrong buy
Displays a symbol's price movements over previous years to identify recurring trends.
6.447% YTM
Maturity dateApr 1, 2048
Coupon5.40% (Fixed)
6.443% YTM
Maturity dateApr 1, 2049
Coupon5.95% (Fixed)
6.444% YTM
Maturity dateApr 1, 2046
Coupon6.75% (Fixed)
6.424% YTM
Maturity dateApr 1, 2045
Coupon5.20% (Fixed)
6.401% YTM
Maturity dateOct 2, 2043
Coupon6.25% (Fixed)
5.860% YTM
Maturity dateApr 1, 2038
Coupon5.15% (Fixed)
5.763% YTM
Maturity dateApr 1, 2036
Coupon6.60% (Fixed)
5.714% YTM
Maturity dateFeb 20, 2033
Coupon5.70% (Fixed)
5.716% YTM
Maturity dateJul 15, 2035
Coupon6.15% (Fixed)
5.698% YTM
Maturity dateApr 15, 2035
Coupon6.25% (Fixed)
5.647% YTM
Maturity dateJan 8, 2036
Coupon5.45% (Fixed)
See all GM bonds
Weight0.10%
Market value2.21 B
Weight0.11%
Market value1.81 B
Weight0.67%
Market value1.51 B
Weight0.11%
Market value933.12 M
Weight0.11%
Market value836.52 M
Weight0.26%
Market value661.42 M
Weight1.19%
Market value446.45 M
Weight1.74%
Market value391.31 M
Weight3.45%
Market value313.52 M
Weight2.43%
Market value269.96 M
Weight0.19%
Market value176.77 M
Explore more ETFs
Frequently asked questions
The current price of GM is 75.80 USD — it has decreased by −0.35% in the past 24 hours. Watch General Motors Company stock price performance more closely on the chart.
Depending on the exchange, the stock ticker may vary. For instance, on NYSE exchange General Motors Company stocks are traded under the ticker GM.
GM stock has fallen by −2.88% compared to the previous week, the month change is a −5.96% fall, over the last year General Motors Company has showed a 41.92% increase.
We've gathered analysts' opinions on General Motors Company future price: according to them, GM price has a max estimate of 131.00 USD and a min estimate of 60.00 USD. Watch GM chart and read a more detailed General Motors Company stock forecast: see what analysts think of General Motors Company and suggest that you do with its stocks.
GM stock is 2.43% volatile and has beta coefficient of 1.20. Track General Motors Company stock price on the chart and check out the list of the most volatile stocks — is General Motors Company there?
Today General Motors Company has the market capitalization of 70.08 B, it has decreased by −0.85% over the last week.
Yes, you can track General Motors Company financials in yearly and quarterly reports right on TradingView.
General Motors Company is going to release the next earnings report on Jul 21, 2026. Keep track of upcoming events with our Earnings Calendar.
GM earnings for the last quarter are 3.70 USD per share, whereas the estimation was 2.66 USD resulting in a 39.30% surprise. The estimated earnings for the next quarter are 3.19 USD per share. See more details about General Motors Company earnings.
General Motors Company revenue for the last quarter amounts to 43.62 B USD, despite the estimated figure of 43.51 B USD. In the next quarter, revenue is expected to reach 47.01 B USD.
GM net income for the last quarter is 2.63 B USD, while the quarter before that showed −3.31 B USD of net income which accounts for 0.00% change. Track more General Motors Company financial stats to get the full picture.
Yes, GM dividends are paid quarterly. The last dividend per share was 0.18 USD. As of today, Dividend Yield (TTM)% is 0.85%. Tracking General Motors Company dividends might help you take more informed decisions.
General Motors Company dividend yield was 0.70% in 2025, and payout ratio reached 17.44%. The year before the numbers were 0.90% and 7.54% correspondingly. See high-dividend stocks and find more opportunities for your portfolio.
As of Jul 21, 2026, the company has 155 K employees. See our rating of the largest employees — is General Motors Company on this list?
EBITDA measures a company's operating performance, its growth signifies an improvement in the efficiency of a company. General Motors Company EBITDA is 15.62 B USD, and current EBITDA margin is 8.05%. See more stats in General Motors Company financial statements.
Like other stocks, GM shares are traded on stock exchanges, e.g. Nasdaq, Nyse, Euronext, and the easiest way to buy them is through an online stock broker. To do this, you need to open an account and follow a broker's procedures, then start trading. You can trade General Motors Company stock right from TradingView charts — choose your broker and connect to your account.
Investing in stocks requires a comprehensive research: you should carefully study all the available data, e.g. company's financials, related news, and its technical analysis. So General Motors Company technincal analysis shows the strong sell today, and its 1 week rating is neutral. Since market conditions are prone to changes, it's worth looking a bit further into the future — according to the 1 month rating General Motors Company stock shows the buy signal. See more of General Motors Company technicals for a more comprehensive analysis.
If you're still not sure, try looking for inspiration in our curated watchlists.