Value Accepted Above VT
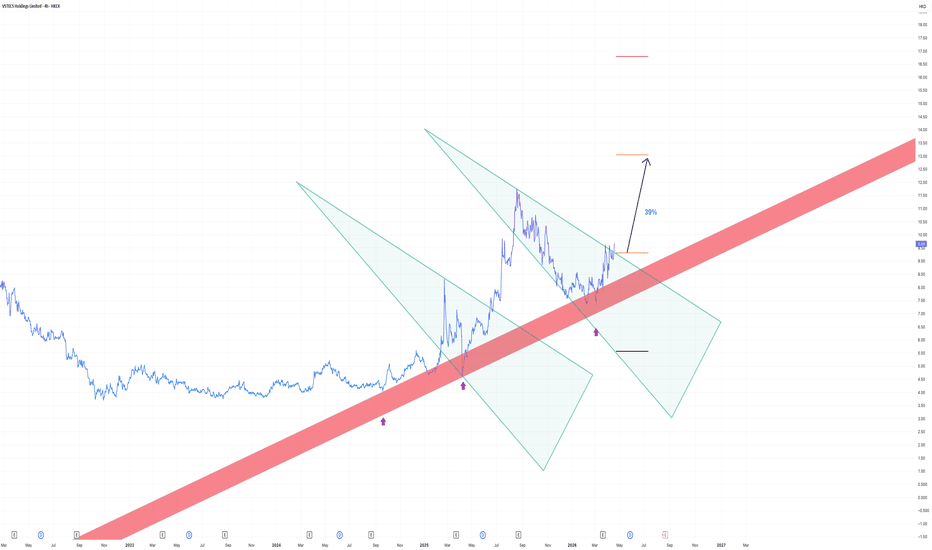
Acceptance confirmed above the Value Triangle (VT). Structure remains valid above the red Boundary Line (BL), with prior Value triangles behaviour supporting continuation.
T1 projected from VT; exit on close below BL.
Sector context:
Hong Kong tech/distribution names remain mixed over the past month, with broader Hang Seng tech sentiment still uneven.
Ticker-specific news:
No material company-specific update over the past week; move appears structurally driven.
Autonomous is in the real live deployment, works?
From the Week chart, with the indicators & trading volume it signals the reversal.
I see a good risk/reward ratio.
It’s a pure technical indicators analysis but not fundamental value.
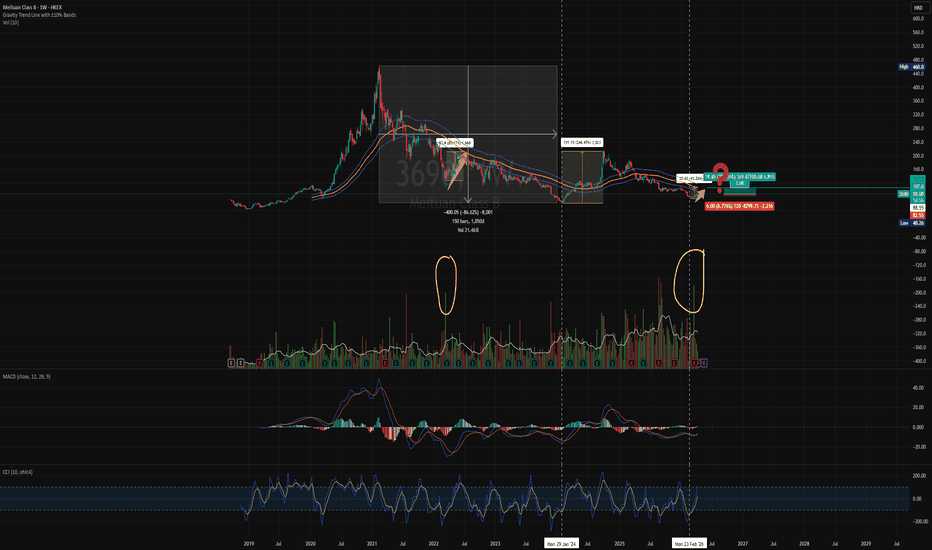
HKEX:3690
Cautious support level (Stop Level) : 81-83
Key Support : 73-77
Strong support : 61 (2024 Low level)
Next Resistance : 89, 93
Target : 107 (Graviting Trend Line)
Good Entry level : 85 - 87 - Anything within this range is good to accumulate. Cautious of the support levels.
More conservative entry wait for confirmation to stay above 89 (price closed 89)
The achievable target is 107 (~20%)
You may want to put a SL and exit if it breaks below the key support zone.
Autonomous food delivery robots and drones is now putting into real deployment of business.
“Given early commercial deployments, platform-level investment and exposure to higher labour costs that could be mitigated via automation.” Barclays expects
What do you think?
Please feel free to comment and share your thoughts.
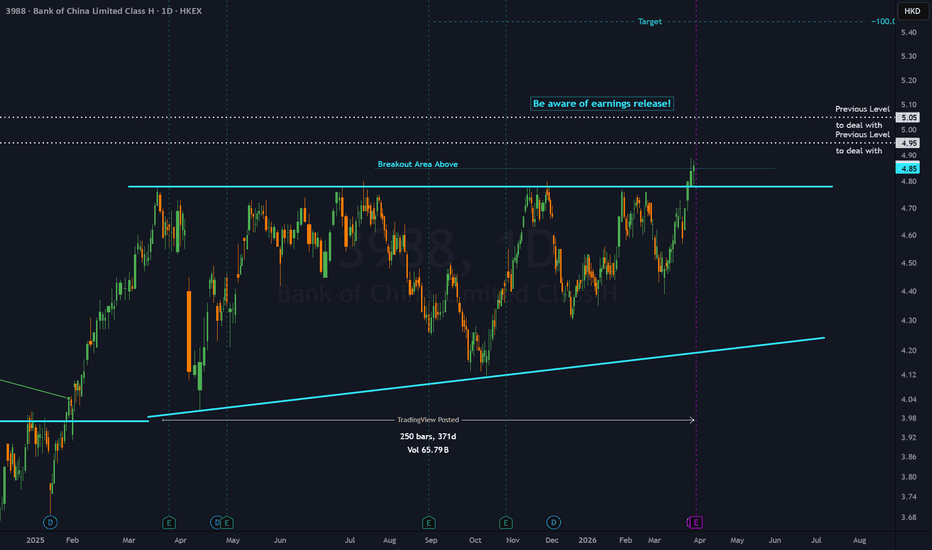
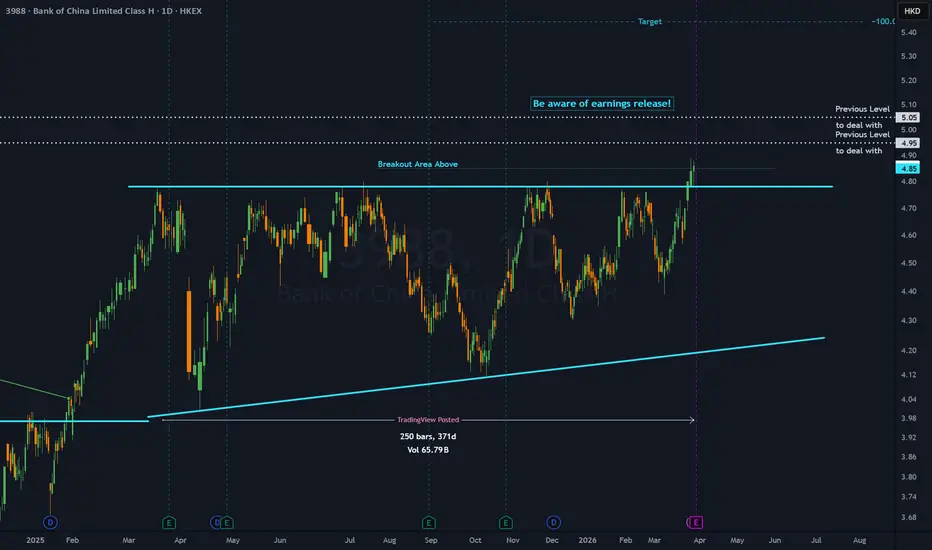
3988 - 1 year ASCENDING TRIANGLE══════════════════════════════
Since 2014, my markets approach is to spot
trading opportunities based solely on the
development of
CLASSICAL CHART PATTERNS
🤝Let’s learn and grow together 🤝
══════════════════════════════
Hello Traders ✌
After a careful consideration I came to the conclusion that:
- it is crucial to be quick in alerting you with all the opportunities I spot and often I don't post a good pattern because I don't have the opportunity to write down a proper didactical comment;
- since my parameters to identify a Classical Pattern and its scenario are very well defined, many of my comments were and would be redundant;
- the information that I think is important is very simple and can easily be understood just by looking at charts;
For these reasons and hoping to give you a better help, I decided to write comments only when something very specific or interesting shows up, otherwise all the information is shown on the chart.
Thank you all for your support
🔎🔎🔎 ALWAYS REMEMBER
"A pattern IS NOT a Pattern until the breakout is completed. Before that moment it is just a bunch of colorful candlesticks on a chart of your watchlist"
═════════════════════════════
⚠ DISCLAIMER ⚠
The content is The Art Of Charting's personal opinion and it is posted purely for educational purpose and therefore it must not be taken as a direct or indirect investing recommendations or advices. Any action taken upon these information is at your own risk.
Tencent: Back to Lower LevelsTencent stock has recently erased the gains from two weeks ago and continued to sell off, in line with our primary scenario. We currently position price in the final downward phase of the broader correction. We anticipate the low to form between the two support levels at HK$364.80 and HK$188.60. In our alternative scenario (probability: 35%), a corrective low would have already been established at the beginning of the month. In that case, the stock would now move higher with increased momentum and form a higher corrective top above the resistance at HK$715.00, before entering its final downward move.
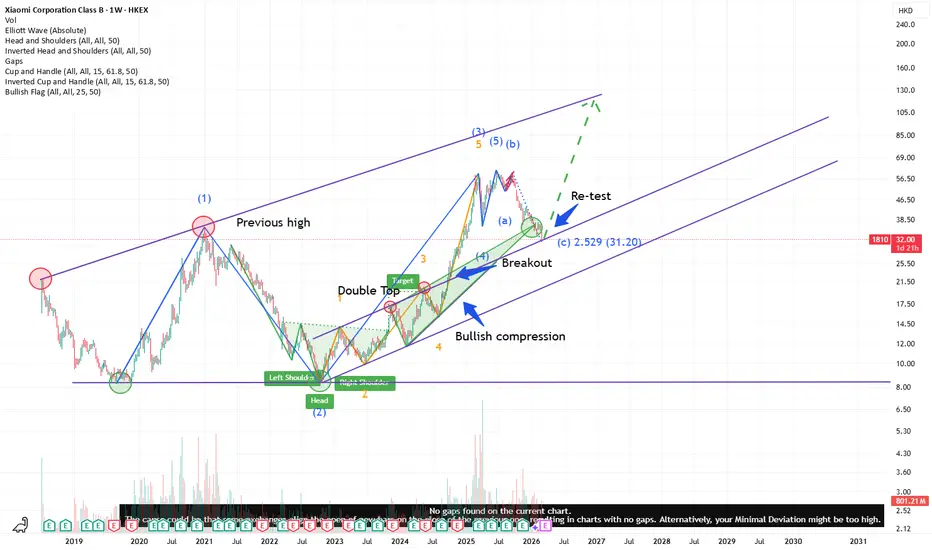
Xiaomi becomes an opportunity hereXiaomi had a steep retrace, something I've been eying for some time already as show here:
Right now Xiaomi might be starting to create a local bottom. This is very early days though, and further patience is required. As said in my initial thread with bearish views, this could go to 29HKD for sure. And maybe even lower?
Especially with US stocks dropping, and HKEX:HSI1! is also looking like it's rolling over, cautiousness is wanted here.
But right now its starting to look better and better for Xiaomi and I wouldn't judge you to start DCA.
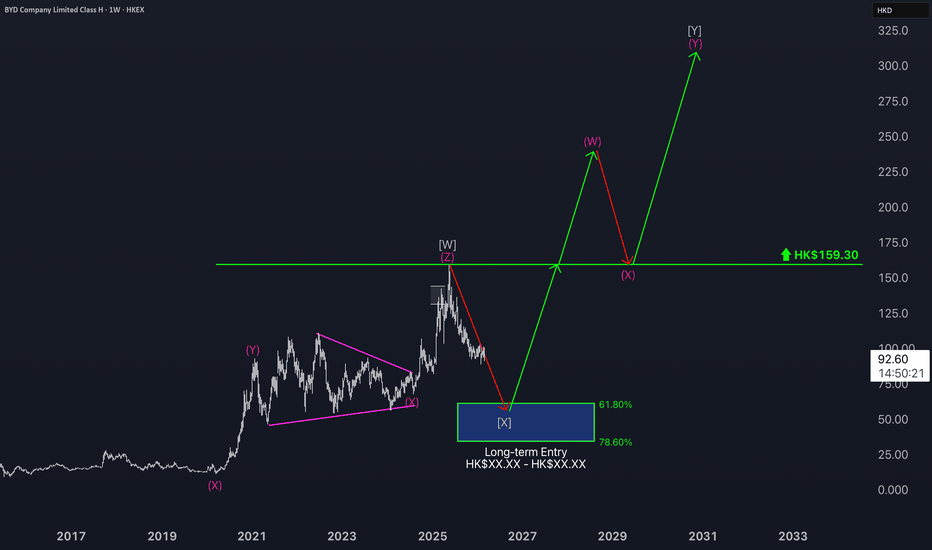
BYD long Term outlookAs shown on the weekly chart, the low of green wave should be set within our blue Long-Term Entry Area (Exact Price Levels reserved for Subscribers to our daily market analysis service). Looking ahead, we expect gains that could push BYD shares well above resistance at HK$159.30.
Do NOT Regret Overlooking XIAOMITo those who have been following Xiaomi with us, we have already explained why we believe Xiaomi is a stock that many investors may regret not entering. However, we also emphasized the importance of patience and waiting for confirmation.
For anyone who missed our previous post, please read this article first.
Xiaomi lost the support of its previous highs due to geopolitical tensions but has now found support within a very strong channel that was broken out of in September 2024. In our view, this support level is quite solid, and we expect Xiaomi to hold.
As we always advise, once confirmation is established, we will take a position in Xiaomi, as we believe the company has the potential to deliver very strong long-term gains.
If you enjoyed and/or were helped by our idea, please support us by boosting it 🚀🚀🚀
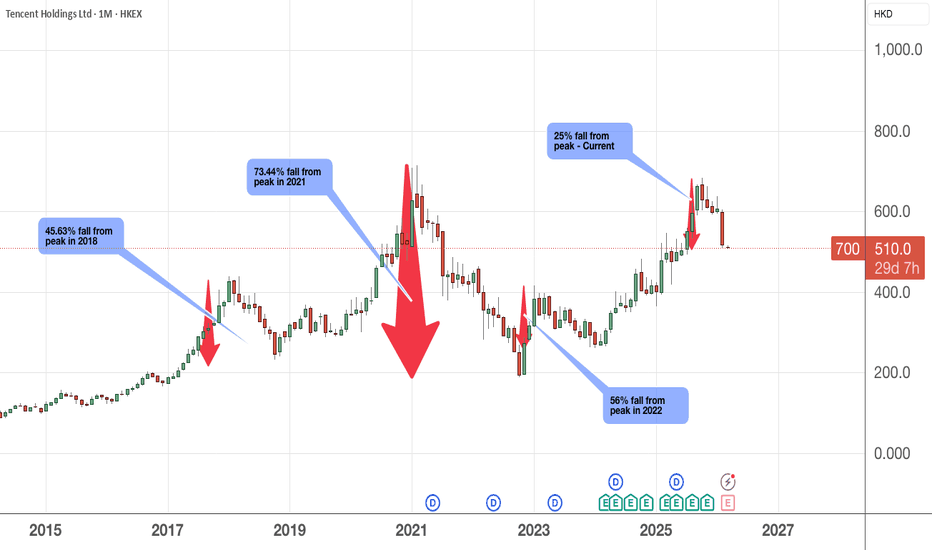
what comes down may come up......I have to mince my words carefully; choosing may instead of MUST since it is not a certainty as seen in many stocks.
When we take a big step back and review the past performance, we notice that Tencent has fallen more than its current drop from peak for 3 times since 2018. And each time after the fall, it continues to rise up higher.
Will we see another rally after this fall ? How much more to fall ? When will it rebound ? Ahh.. these are questions better left to the experts. For me, a fall from the share price could means an opportunity to grab more shares though not necessarily. It is important to check if the nature of business has been impacted by any change in government policies, industry practices or even emerging competitors as well. Just because it works 20 years ago does not mean it will for the next 20 years.
As usual, please DYODD
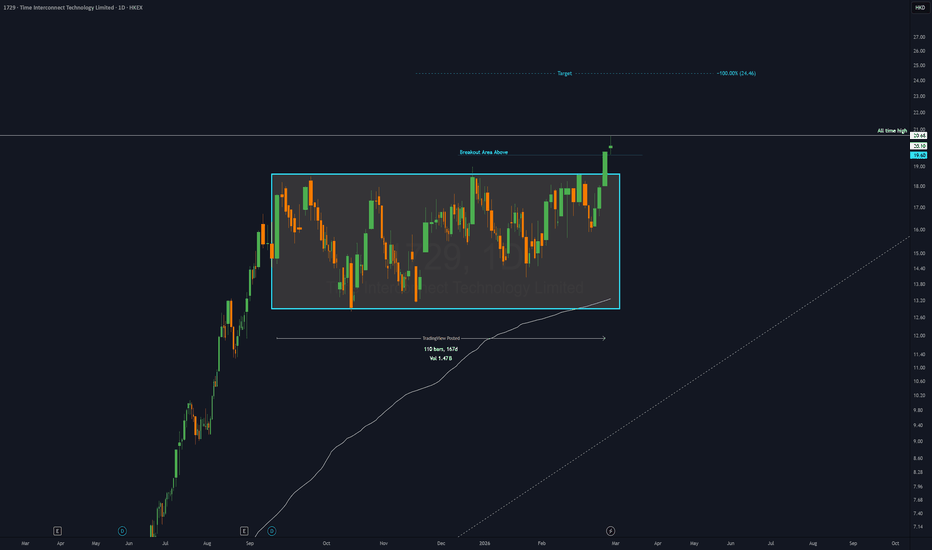
1729 - 5 months RECTANGLE══════════════════════════════
Since 2014, my markets approach is to spot
trading opportunities based solely on the
development of
CLASSICAL CHART PATTERNS
🤝Let’s learn and grow together 🤝
══════════════════════════════
Hello Traders ✌
After a careful consideration I came to the conclusion that:
- it is crucial to be quick in alerting you with all the opportunities I spot and often I don't post a good pattern because I don't have the opportunity to write down a proper didactical comment;
- since my parameters to identify a Classical Pattern and its scenario are very well defined, many of my comments were and would be redundant;
- the information that I think is important is very simple and can easily be understood just by looking at charts;
For these reasons and hoping to give you a better help, I decided to write comments only when something very specific or interesting shows up, otherwise all the information is shown on the chart.
Thank you all for your support
🔎🔎🔎 ALWAYS REMEMBER
"A pattern IS NOT a Pattern until the breakout is completed. Before that moment it is just a bunch of colorful candlesticks on a chart of your watchlist"
═════════════════════════════
⚠ DISCLAIMER ⚠
The content is The Art Of Charting's personal opinion and it is posted purely for educational purpose and therefore it must not be taken as a direct or indirect investing recommendations or advices. Any action taken upon these information is at your own risk.
If you put a gun on my head and force me to buy this stock !On the 1H chart, I would place a bet at the yellow zone , showing you my SL and profit target.
Once the price move towards somewhere near the 650 level, I would move up my SL and let the profits run as this is a new stock and it is highly likely to rally up much higher than the previous peak of 700+
Conversely, it is also possible that as a new IPO stock, it could heads south , plunging 50-70% and that is why I have a SL.
Always be clear if you are taking a trade or an investment, don't blur the line and confuse yourself.
As usual, please DYODD
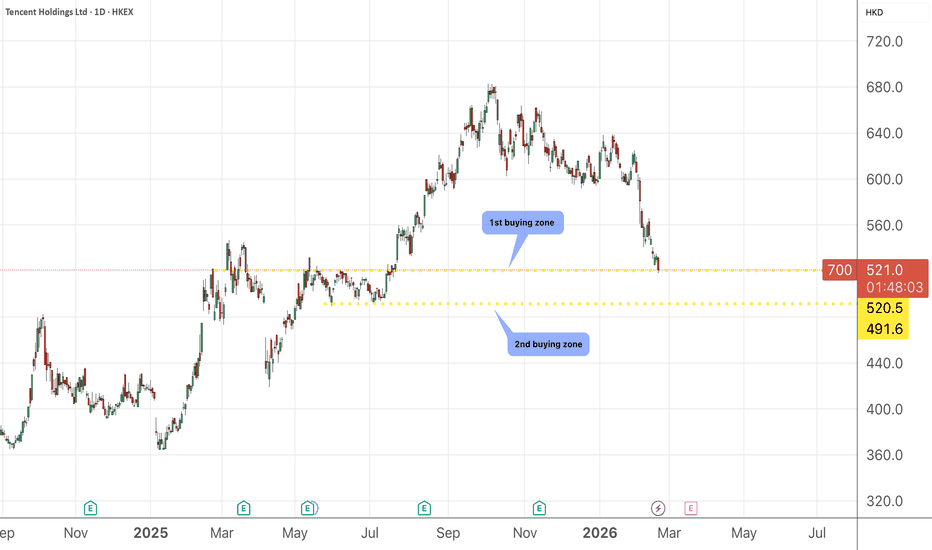
700 Tencent, pullback near completion$700 looks be finishing wave C of macro 4, of its corrective phase at the High Volume Node, $520, the 0.5 Fibonacci retracement of the larger macro move up.
The daily 200EMA is lost and the daily pivots nearly fully ran to the S5.
Daily RSI is deep into oversold with a 3 wave structure down. A reversion to mean to trade is on the cards, at least, and can be played level by level to see if it wants to go to all-time high.
Weekly RSI also nearing oversold.
Safe trading
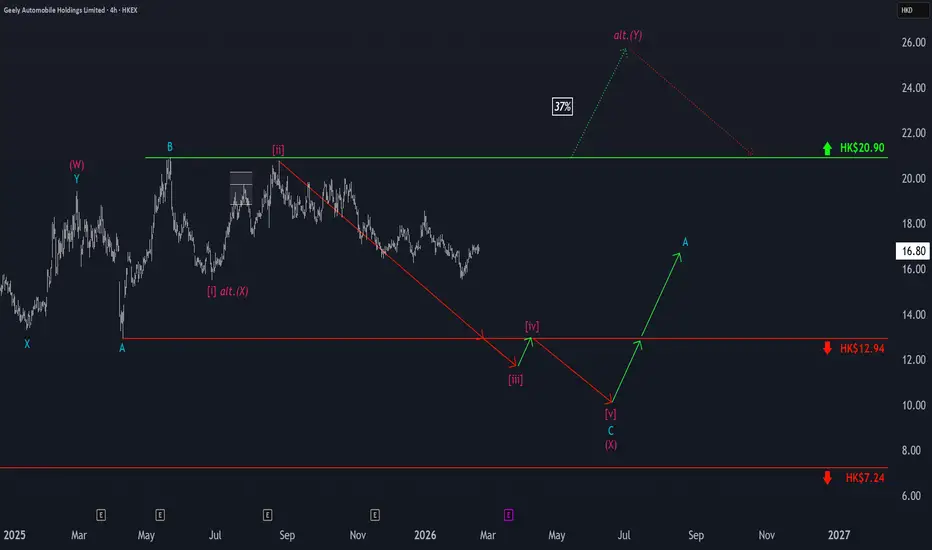
Geely: Further Sell-offs expectedGeely’s stock hasn't seen much movement recently due to the Chinese holidays. According to our primary scenario, we expect further sell-offs to push price below the HK$12.94 support. There, we anticipate the low of the magenta wave (X). However, if price climbs above the HK$20.90 resistance, it could suggest the low of wave alt.(X) has already formed, and the wave alt.(Y) top might be next (probability: 37%).
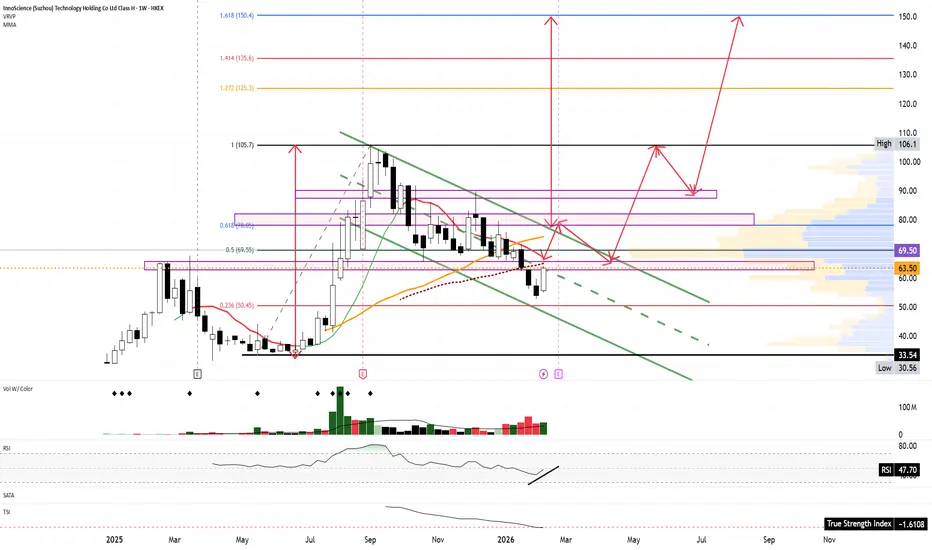
Long Innoscience Technology (2577, HKEX)Company profile : HKEX:2577 Innoscience Technology is a semiconductor company focused mainly on the development and production of gallium nitride (GaN) power devices. GaN technology is increasingly used in fast chargers, power supplies, electric vehicles, data centers, and renewable energy systems because it allows for higher efficiency and smaller components compared to traditional silicon-based solutions.
Chart timeframe: Weekly
This analysis is based on the weekly chart, which means each candle represents one week of trading. Weekly charts are typically used for medium- to long-term investment decisions rather than short-term trading.
Current Technical Structure
After a strong upward move in mid-2025 (the “flagpole”), the stock entered a controlled downward-sloping consolidation channel. This structure resembles a bull flag pattern, which is generally considered a bullish continuation formation.
Bull Flag Pattern
• The strong rally from approximately 30 HKD up to around 105 HKD forms the flagpole.
• The subsequent downward channel represents the flag consolidation.
• Price is currently near the lower-middle part of this consolidation.
If this is indeed a confirmed bull flag, the theoretical price target is calculated by measuring the height of the flagpole and projecting it upward from the breakout point.
• Flagpole height: roughly 70 HKD (approx. 35 → 105)
• Potential breakout zone: around 80 HKD
• Projected target: around 150 HKD
This aligns with the 1.618 Fibonacci extensions near 150 HKD.
However, it is important to wait for confirmation (clear breakout with strong weekly volume).
Key Support Levels:
1. 48–50 HKD zone. Around 48.40 HKD (0.236 Fibonacci). This is a major long-term support. A breakdown below this level would weaken the bullish structure significantly.
Key Resistance Levels
1. 80–82 HKD zone. Around 80.15 HKD (0.618 Fibonacci retracement). This is the most important resistance to break in order to confirm the bull flag scenario.
2. 105–110 HKD zone. Previous major high (~106 HKD).This is strong historical resistance.
Indicators
• RSI (around 47): Neutral zone, slightly below 50, suggesting neither overbought nor oversold conditions. There is a small upward turn forming, which could indicate momentum improvement.
• Volume: No explosive breakout volume yet — confirmation will require strong weekly volume expansion.
• Trendlines: Price remains inside a descending channel, typical for flag consolidation.
Fundamental Timing Consideration
The company is expected to release earnings soon. This is important because:
• Earnings can act as a catalyst for a breakout.
• They can also invalidate the pattern if results disappoint.
It may be safer to wait for either:
• A confirmed breakout above 80–82 HKD with strong volume, or
• A clear reaction to earnings before taking a larger position.
Summary:
• The weekly chart shows a potential bull flag pattern, which is generally bullish.
• Key breakout level: around 80 HKD.
• Key support zone: 48-50 HKD.
• Long-term target (if confirmed): around 140–150 HKD.
• Earnings release is a near-term risk factor.
• No confirmation yet — patience is required.
• After breaking out: stop loss, the low of a breaking-out candle
• Take profit: 140-150.
Technically a BUY but fundamentally a BIG SELLMiniMax fits the profile perfectly. What it actually is: A venture‑stage AI foundation‑model company that has come to public markets early. The bet here is on future moat (data, models, ecosystem, regulation) rather than current financial quality.
If you wear your Buffett hat strictly, this is speculation on future economics, not a present‑day “wonderful business at a fair price.”
The financials aren’t “early‑stage but scaling” — they’re pre‑economics, pre‑moat, pre‑unit‑economics clarity. In Buffett-language, that’s a hope stock : the value sits entirely in what the business might become, not what it is today.
A few things worth keeping in mind as you watch it from a distance:
The business is all story, no economics (yet)
Revenue is tiny, losses are huge, equity is negative, and debt exceeds cash. That combination means the company’s survival depends on:
- raising more capital
- convincing the market the future will be big enough to justify the burn
That’s not inherently bad — it’s just venture math, not Buffett math.
The moat is not proven
Foundation‑model companies face brutal competition:
- OpenAI
- Anthropic
- Google DeepMind
- Baidu
- Alibaba Qwen
- SenseTime
- ByteDance’s internal models
MiniMax is trying to carve out a niche, but nothing in the financials shows durable advantage yet.
The listing itself is a signal
When a company this early lists publicly, it’s usually because:
- private capital was expensive or unavailable
- founders or early investors wanted liquidity
- they needed a public‑market valuation to raise more money later
Buffett would call that a tell.
The stock can still go up — but for reasons unrelated to fundamentals. Momentum, AI hype, scarcity of listed China AI plays, and retail enthusiasm can push it higher. But that’s speculation, not investment in the Buffett sense.
An hour long rant on my China thoughts9660 looks like a Buy at this point
2318 - Looks like close to a buy
2607 - Needs more research
941 - is moving between it's ranges
3888 - Going down at perhaps 9.6
268 - reverse H&S
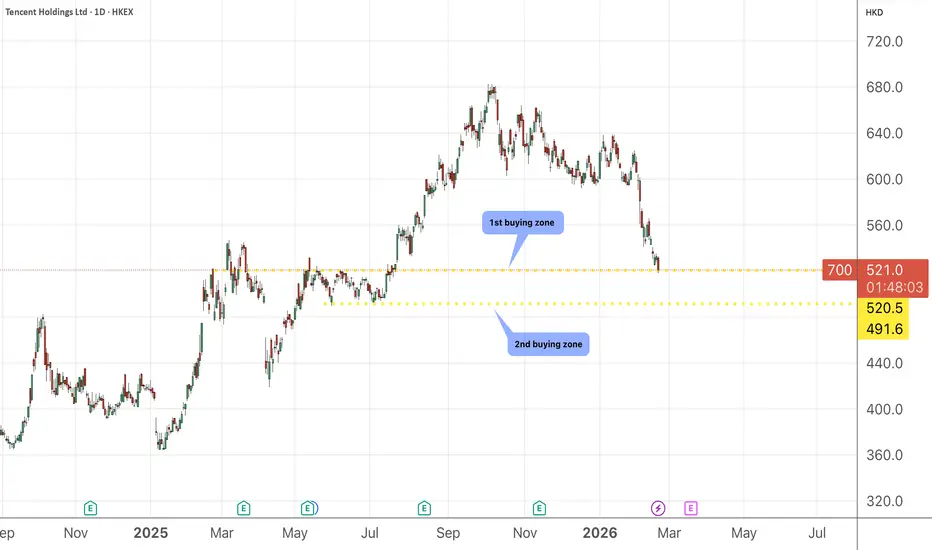
700 - looks like a good buy opportunity around 500
Research: 2268, 656, 2359 at 99, 2382, 6618, 9626, 20
Trade: 1211 - short term bounce from 83 - 120
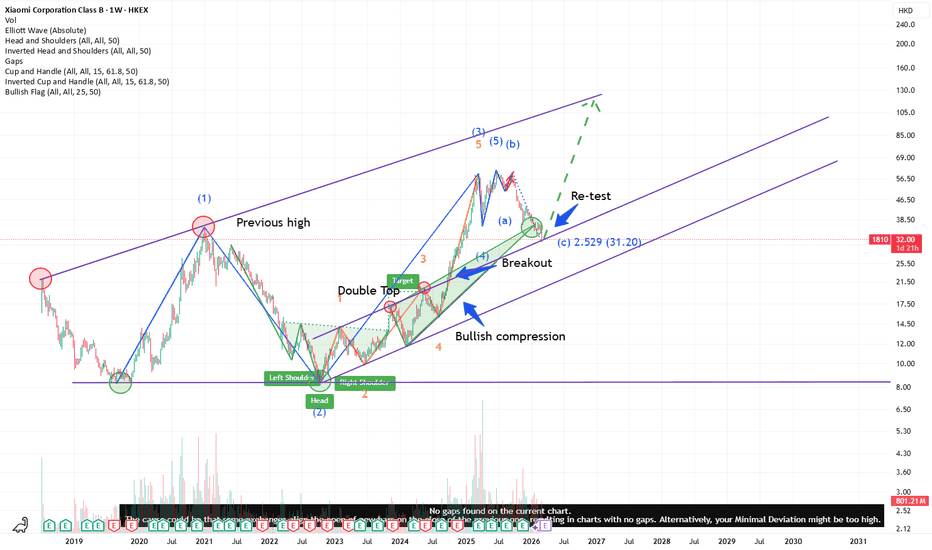
Xiaomi is offering its loyal investors an opportunityLooking at the weekly chart, I think there might be some more room for the price to fall despite the recent shares buyback by the Company. This is also the highest peak the prices went in Dec 2020 before suffering a huge fall to below 10 dollars over the next few years..........
Had you went in during its lowest price of 8+ dollars, then you would have gained more than 300% todate or more than 600% at its peak in June 2025.
EV remains a very competitive market and the safety concerns of its latest model, SU7 may have dented some confidence amongst investors. Price of EV cars will continue to fall, imo as competitors fight to maintain market shares. That means, with lower selling price, more volume need to be sold to reach the same revenue target, a pressure that the sales team globally has to face.
I still find the consumer spending lacks a push in China and hope that the CCP will usher in some stimulus package before the CNY.
This present a good buying opportunity for Xiaomi , not forgetting it has a strong 2025 revenue , a 22% YOY increase. What I like most it is flush with cash, very liquid and enjoy a low debt to equity ratio of 10.4%.
Please DYODD
Tencent 700.HK resistance $630• Reduce holdings; cut further if price breaks below $580.
• Add positions only if price breaks above $630 with ≥$4B turnover.
• Chart shows a W-shaped uptrend, but upside momentum has stalled—Tencent has failed to clear resistance for a month.
• Current drivers: buy-back program and AI narrative.
• Without fresh catalysts (new game release, AI platform integration, or IPO news), daily turnover under $2B (lagging vs. 9988.HK) signals consolidation before the next leg higher
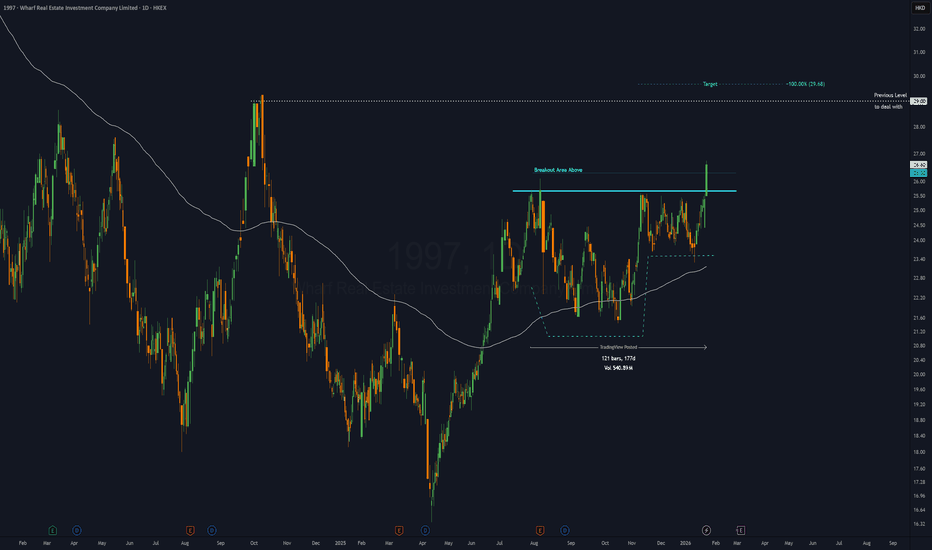
1997 - 6 months CUP & HANDLE══════════════════════════════
Since 2014, my markets approach is to spot
trading opportunities based solely on the
development of
CLASSICAL CHART PATTERNS
🤝Let’s learn and grow together 🤝
══════════════════════════════
Hello Traders ✌
After a careful consideration I came to the conclusion that:
- it is crucial to be quick in alerting you with all the opportunities I spot and often I don't post a good pattern because I don't have the opportunity to write down a proper didactical comment;
- since my parameters to identify a Classical Pattern and its scenario are very well defined, many of my comments were and would be redundant;
- the information that I think is important is very simple and can easily be understood just by looking at charts;
For these reasons and hoping to give you a better help, I decided to write comments only when something very specific or interesting shows up, otherwise all the information is shown on the chart.
Thank you all for your support
🔎🔎🔎 ALWAYS REMEMBER
"A pattern IS NOT a Pattern until the breakout is completed. Before that moment it is just a bunch of colorful candlesticks on a chart of your watchlist"
═════════════════════════════
⚠ DISCLAIMER ⚠
The content is The Art Of Charting's personal opinion and it is posted purely for educational purpose and therefore it must not be taken as a direct or indirect investing recommendations or advices. Any action taken upon these information is at your own risk.