

981 hkex, falling pattermtrade within your limits. happy trading.
falling to wait for suppor to get in some positions.
 Short

hk 981 semi - not even semi smooth.. 1st and 2nd support lines- this stock is correcting HKEX:981 HKEX:981
- hold or short until it hits 1st and 2nd support.
-May reobound after that..
- very volatile
- keep your stop losses and trade within in your limits.
trade at your own risk and limits.
Happy trading
Short
Latest kid in town - ChatGP stocks - Hype or Trend ?You can see from the daily chart that these 3 stocks have broke out of its resistance level since May 2022 and have gotten the Chinese traders/investors going bonkers over them.
I will not rush in at this moment as it has gone up way too high and its financial stability of the companies remain questionable. At this juncture, the US is just starting the trend with Microsoft and Google competing head on. Let's be patient and let the dust settle a while more before deciding the next course of acti


China Overseas - Bearish exhaustion setting inDescending triangle and the appearance of two high wave candle indicate that the bear might be exhausted. Hence, we are looking at a potential buy.
 Long

8040 longPlan for long trade at colsodiation area. Long can be limit order around support and can be stop order if breaking new high. Can take longer time to reach new top or this idea ic complitly false.

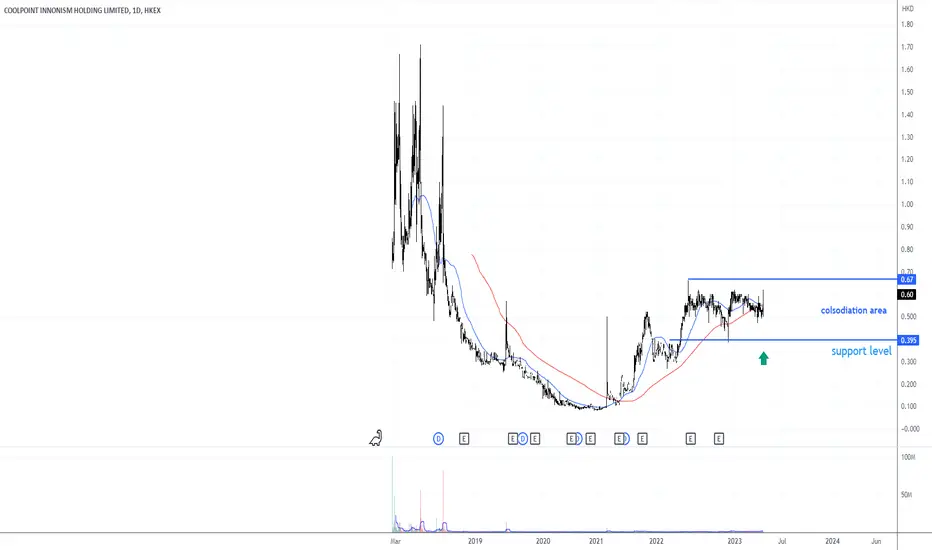
Trade entryPlans entry on 981 on both ways short and long. Depends where price moves and what will come first. Hope for short first if not it can take longer time for price to reach support.

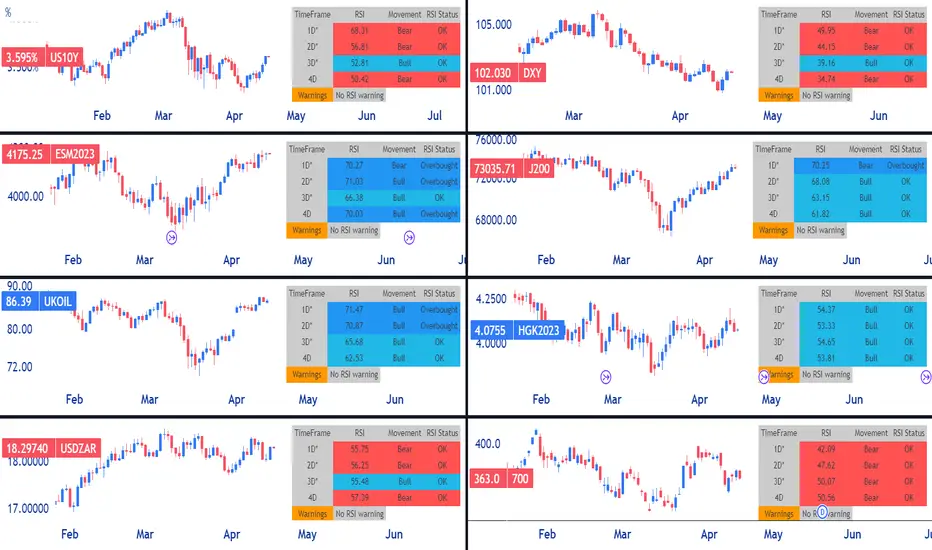
Key Markets: RatingsToday's Key Markets: Ratings
This screen gives us a flash view of the major markets.
China Mobile explosive growth momentumStock is breaking 52 week highs, with a long-sustained trend with the 50 day SMA above the 200 day SMA. China explosive growth coming back? I would think so.
 Long

My long term chart for 1810.HK XIAOMI CorpHi, let's take a look at the XIAOMI stock chart. I see two entrances there. At the lower range if the price is not able to get out of the range. Or after a breakthrough and subsequent diagonal resistance retest.
 Long

9988 | Alibaba - Wave Analysis | Inverted H&S TFW Target +100%Wave analysis and chart pattern projection:
> A possible valid inversed head & shoulders pattern in weekly timeframe, potentially 2-wave correction and rebound to retest the neckline resistance for a strong breakout.
> TP Inverted H&S @ 1.618 and 2.0 fibonacci +100+%
> MACD doubled bullish divergence signal golden cross above baseline indicating bullish move.
 Long

Should you be concerned about falling price of your stocks?Well, the answer depends ! If we take a look at Alibaba shares, we can see that it has reached its 52 week low at 60.25. But Alibaba is more than an e-commerce store with diversified investment in cloud infrastructure, retail, internet and technology.
We all know about the disappearance act of Jack Ma and how he vanished into thin air after the last public speech years ago. Rather than speculate what happened to him, we need to understand he has long relinquish his controlling position in Alib
Long
Ali Health (241)Daily chart, RSI resist breakout
- pretty subjective, sometimes requires 2 points (black triangles) to form the resist, sometimes one point is enough
- sometimes there is a pullback (red triangle), but sometimes it may not
Upside - $6.40 and above
 Long

Yankuang Energy - Bottom fishingYankuang has been on a consolidative range since its strong downside on October last year and currently, divergence from stochastic and falling wedge is seen. Harami is seen at the key support.
 Long

Key Markets: RatingsKey Markets: Ratings
Yesterday evening I reviewed several names in my report THE SUM OF THE CHARTS. These included NPN, GLN, SSW, AMS and more.
For more research insights (including trade ideas) get in touch today.

1810 1810 1810 longLook at this bullish chart. Let's see if this longer swing does work as intended. Good trades, folks!
For questions use simply the comment section here ...
Long
TENCENT - ObservationTencent is having a relief rally this morning and looks to test the down sloping 20ema.
380-387 is a major resistance zone.

9988|Alibaba Wave Projection | Bullish Divergence - Rebound?Price action and chart pattern trading - Minor downtrend ending diagonal pattern with MACD bullish divergence
> A possible wave 4.3 minor downtrend wave at the lower support 0.786 extension of wave 4.1 and upcoming rebound wave 4.4 to 0.382 - 0.5 fibonacci retraced from wave 4.3.
> Target upside +10 - 12% while downside is -6%, RRR: 1.5:1
> The final downtrend wave 5 could be slightly below Target H&S zone.
Always trade with affordable risk and respect your stoploss, nothing is 100%
Long
Tencent major 4.5% drop sending a break in structure Tencent break in uptrend structure - Bearish
Tencent has eventually broken below the Uptrend structure after fantastic upside.
This means, the price is now in free fall and is more likely to touch the previous support (brim level of the last Cup and Handle ).
21<7 price>200 - Reversal
RSI <50 - Bearish
Target 312
I just did an analysis on Naspers which we spoke about how Tencent has the correlation.
As Naspers correlates with Tencent and Prosus... We saw a sluggish market in Asia session with t
Short
 Long
 Short

Positive Closing: Executed trade generated profitXiaomi stock Recently has started a bull trend that brings the stock price, to rise from its minimum of 8.42 to 18.10 bringing a rise of 59.49%. I got my signal and entered just in time to take some profit. Now the price overpass my level of attention between 12.30 and 12.74.
the last bull impulse brings the moving average of 50 periods close to the moving average of 200 periods, and probably we will see a possible golden cross, let's see it In the coming weeks. My new next level is above 14.22.
Long
Upside potential more than downside This stock has plunged so low that it is almost impossible to go even lower already ! With the restaurants business reopening in main Tier 1 cities like Shanghai and Beijing, I expect the returns of the customers to boost its revenue greatly.
Plan to nibble some later.
 Long

1929 CHOWTAI FOOK chow tai fook has been showing a positive right side with huge buying on weekly TF , Rectangles can bo out in either direction , this one i tend to believe for Long trade
 Long
