Currenlty only IDEA is short in CHZUSDTWe are currently seeing that in pair has been declining the higher prices consolodation zone . probability it breaks down POC and go to lower is high due to seller were increasing momentum in previous impulses . only at the bottom we get absorption of sellers we look for longs . if they build liquidity at the end of the consolodation range the price collapse again
REMEMBER ONLY REACT TO MARKET , NEVER PREDICT IT
Not a financial advice
Fibonacci Extension
BTC | Weekly Structure | $83K Is the Wave 3 TriggerThesis:
BTC appears to be in the final stage of a larger Wave 2 correction after finding support around the 200-week MA. The structure is improving, but the key confirmation is still ahead. I want to see the $81,000-83,000 area and the 50-week MA reclaimed and flipped to support before treating Wave 3 as confirmed.
Context
- Weekly timeframe
- BTC completed a five-wave advance before entering a clear ABC correction
- Wave C pushed price back toward the 200-week MA before buyers stepped in
-
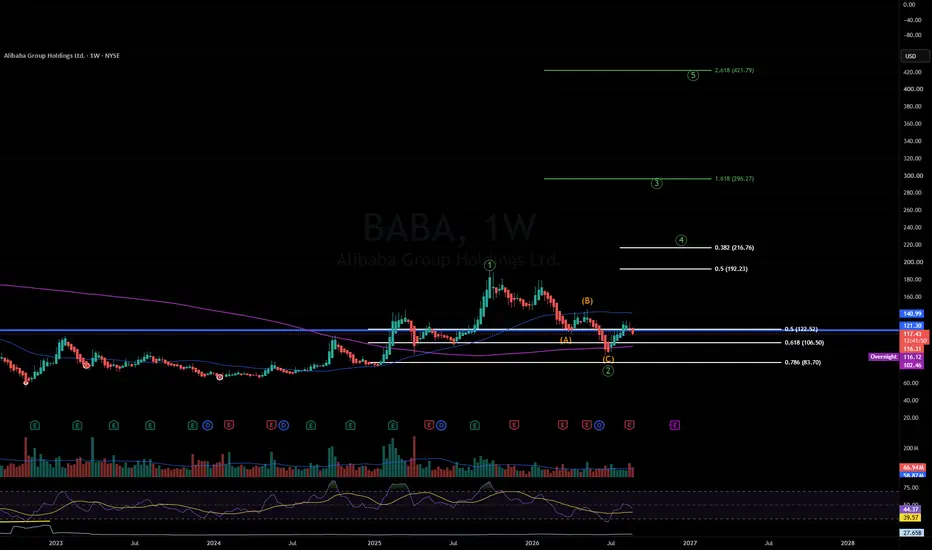
BABA | Weekly Structure | Wave 2 Add Zone DevelopingThesis:
BABA has delivered a clean five-wave move higher followed by a three-wave ABC correction. This is exactly the type of Wave 2 structure where I am most comfortable adding to a long-term position.
Context
- Weekly timeframe
- Five-wave impulsive move completed around $180
- Three-wave ABC pullback followed
- Price briefly moved back below the 200-week MA during the correction
- Our current average is approximately $111
- We added at $94 in June when price was trading below the 200-week
EQNR | The Lemonade (Energy) Stand Funding the Future | LONGImagine owning a wildly successful lemonade stand. But you notice a trend: in a few years, everyone is going to want fruit smoothies.
What do you do? You keep selling lemonade to everyone who wants it today, but you use that cash to quietly build the biggest smoothie factory in town. By the time the neighborhood switches, you’re already the boss.
That is exactly what Equinor (EQNR) is doing right now.
The Fundamental Setup:
Equinor is currently a massive supplier of traditional oil and gas to
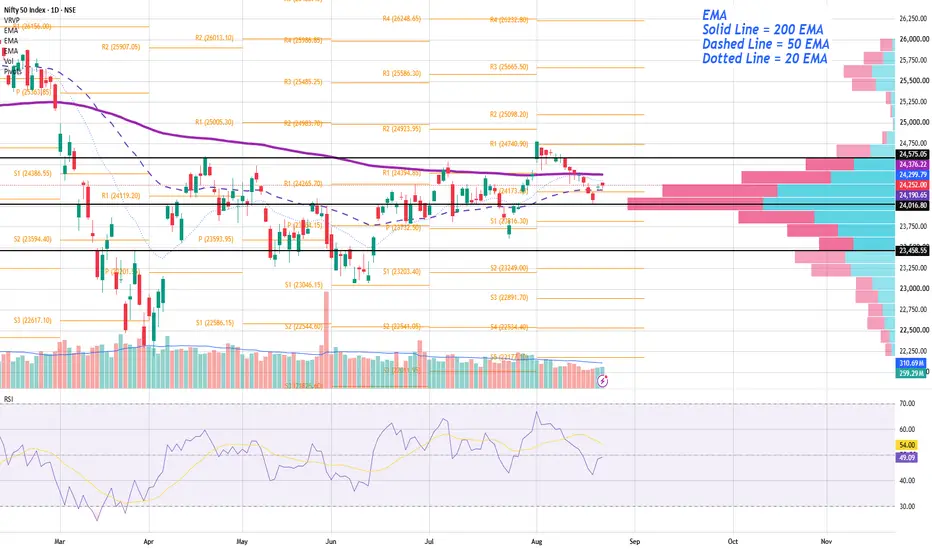
BALANCE, NOT DIRECTION — READING NIFTY THROUGH VOLUME PROFILEEducational post. Every indicator used here is built into TradingView. No custom scripts, no external tools.
WHY THIS POST EXISTS
Most people look at a chart and ask one question: will it go up or down?
Auction Market Theory asks a different question, and it is the more useful one. Where is value, and which way is it moving?
Price is what the market is asking. Value is what the market has agreed on. They are not the same thing, and the gap between them is where most of the useful informati
XAUUSD — 4,550 Holds, 4,945 Opens?
Gold is now trading inside a strong bullish recovery channel after breaking away from the old bearish structure.
The market has already shifted from accumulation into expansion, and price is now holding around 4,600.
The trend is clearly bullish.
But after a strong move, the best plan is still not to chase the candle.
The simple read
Gold is currently moving above the buy trendline area.
As long as price holds above the 4,535 - 4,550 support zone, buyers still have control.
The next imp
XAUUSD — 4,500 Is the Gate to 4,650?
Gold is showing a strong bullish structure after breaking above the previous resistance zone.
The market pushed sharply from the lower support area and is now trading around 4,480 - 4,500, right under the short-term breakout line.
This is where the chart becomes very interesting.
The trend is bullish.
But after a strong move, I still do not want to chase the candle.
I want to see if buyers can defend the new structure.
The simple read
4,500 is the first important gate today.
If gold br
National Industrialization (2060) : Resistance Ahed !!TADAWUL:2060
🚀 10 SAR: The Breakout Level That Could Unlock 12 → 15 → 20
The stock is approaching a critical breakout zone around 10 SAR.
A decisive breakout and sustained move above 10 could signal a shift in momentum and open the path toward the next resistance and profit-taking levels:
🎯 12 → 15 → 20
🔥 Longer-Term Fibonacci Targets
If the bullish structure remains intact and momentum continues to expand, the Fibonacci extension levels point toward potentially larger objectives:
🚀 27
PUMP.FUN / 4H — What happens when you tune VDS to the assetDefault settings work well across most assets. But VDS has another side — it's fully customizable per asset, timeframe, and exchange.
This chart is the result of that. Five signals. Every single one landed at a meaningful turning point — two SELL signals at local tops, two BUY signals at the lows, and a fresh SELL firing right now.
A full breakdown of how I approach custom tuning is coming soon.
BTC Short SFP 8 hr- All time Fav SetupThe Swing Failure Pattern (SFP) has endless characterizations, and this one here is one of our favorite, which is why it's a short trigger in the strategy shown here. Not only do we have a solid 9 bar OBV down with slope, it's a bearish engulfing 10 previous bars, with a follow through immediately after the signal. ROC 200 is below the zero line and in white territory which means the consolidation has been lengthy and fully exhausted; it’s in the zone for the real move to present.
This is a si
SPCX: Bearish Sequence Unfolding Toward Downside Target CFollowing the completion of the prior bullish sequence into the overhead target zone near 150.00, NASDAQ:SPCX has shifted market structure to begin a corrective phase. Price action has formed a clear bearish sequence from the highs, defining an initial impulse into Point A followed by a corrective bounce to Point B.
The aggressive breakdown from the upper consolidation confirms active continuation toward the bearish Point C target. This projected target box sits between 125.50 and 129.00, rep
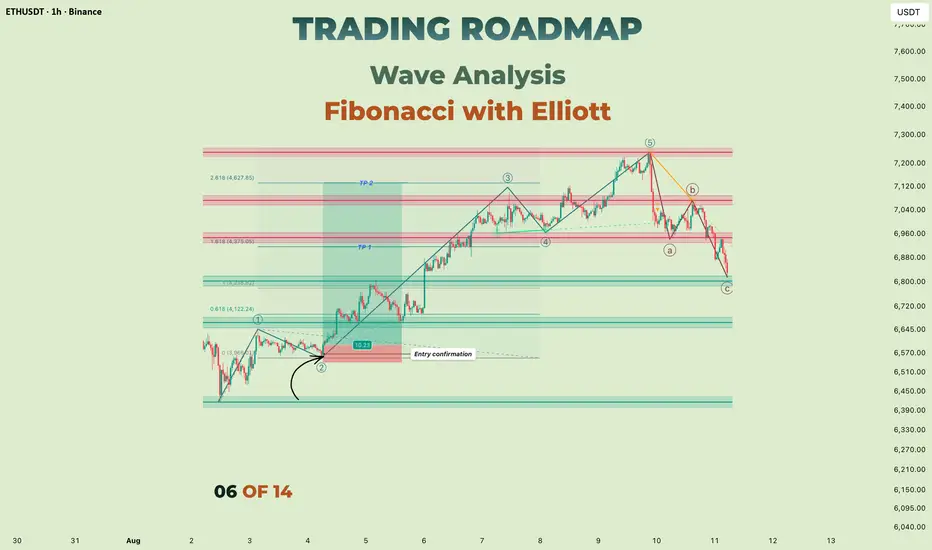
Trading Roadmap| Wave Analysis·Lesson 06— Fibonacci with ElliottLesson 6 - Fibonacci with Elliott
Difficulty: (Intermediate)
Wave counting tells you where you are in the structure. Fibonacci tells you how far the next leg might travel. On their own, each one leaves a gap — a count with no measurement, or a set of levels with no context. Used together, they answer two different questions at the same time.
A completed five-wave advance followed by an A-B-C correction. Before any measurement is added, the count has to survive the rules from Lesson
Ash-Sharqiyah Development : Bulls AliveTADAWUL:6060
🚀 13.4–13.8: Critical Retest Zone — Bulls Still Have a Chance
The stock is now sitting on a key technical confluence zone between 13.40–13.80.
This area combines two important signals:
📌 0.618 Fibonacci retracement support
📌 Trendline breakout–retest confirmation
As long as price sustains this zone, the bullish structure remains alive and buyers have a chance to push the stock toward:
🎯 17.00
🎯 19.44
🎯 22.00
📊 Key Levels
🛡️ 13.40–13.80: Critical support & breakout-retest z
XAUUSD 1H | Liquidity Sweep + Strong Sell VolumeGold swept the liquidity above the recent highs and failed to hold above the zone. After the liquidity grab we got a clear CHoCH with strong selling volume entering the market which gives bearish confirmation.
As long as price stays below the liquidity zone the setup remains bearish with 4327 as the first area and the 4200–4205 zone around Fib 0.5–0.6 as the main target.
SL is placed above the liquidity sweep high. Waiting for further bearish continuation.
NVIDIA (NVDA) Technical Analysis: Elliott Wave and Support LevelNVIDIA (NVDA) remains in a strong long-term uptrend, but my current Elliott Wave count places the structure in a late stage.
On the monthly chart, I look at the larger market structure, the long-term rising channel, and the higher-degree Elliott Wave count. I then move to the weekly chart to look more closely at the current fifth wave and the possible scenarios from here.
My working count places NVDA in wave five inside the larger wave three, with the final smaller fifth subwave potentially de
Al Munajem Foods : Slow & SteadyTADAWUL:4162
📈 Slow & Steady Climb Toward a Weekly Breakout — Is the Next Major Rally Approaching? 🇸🇦
The weekly chart continues to paint a constructive bullish picture, with price steadily advancing toward a major breakout zone. Unlike explosive rallies, this gradual ascent reflects healthy accumulation, often laying the groundwork for a stronger and more sustainable uptrend.
The key now is confirmation above resistance.
🔍 Technical Outlook
The 67 price level is the most important resist
Price Confirms Further Extension After Reversal Pattern FormsOANDA:EURUSD on the Daily chart is getting ready to complete a favorable Confirmation Candlestick Pattern called the Three Inside Up at the 1 Fibonacci Extension Level and could be eyeing to head further!
- Last week ended with a Breakout of Previous Highs on Thursday, followed by an abrupt Retest on Friday.
- This week started with price making a decline back to the 1 Fibonacci Extension Level but found Support through Tuesday to where we can see price now is attempting another Breakout of
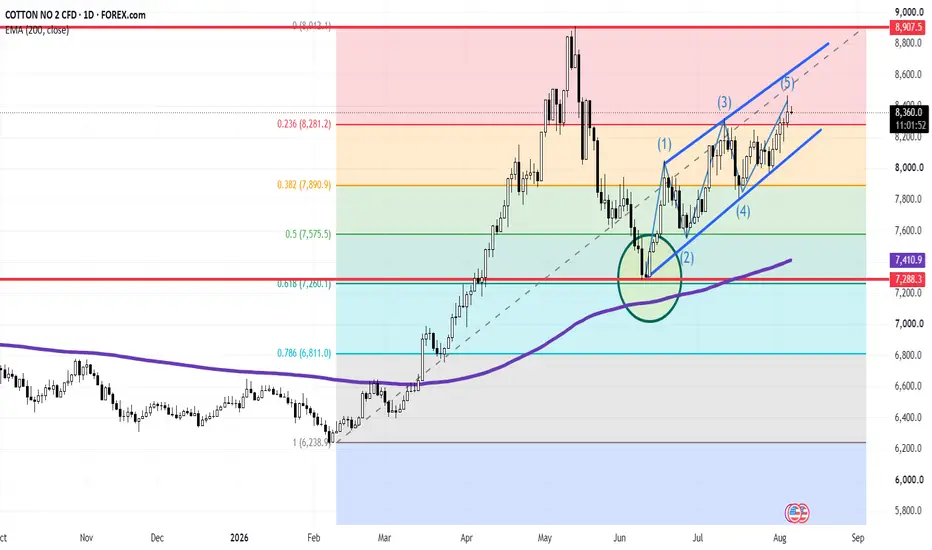
Cotton No. 2 ($COTTON) Daily: 5-Wave ElliottCotton No. 2 ( PEPPERSTONE:COTTON ) Daily: 5-Wave Elliott Impulse Advances Towards 8,907 Macro Ceiling Following 0.618 Fibo Rebound
### 🌾 Cotton No. 2 CFD ( PEPPERSTONE:COTTON ) Daily Technical Matrix (Ref: COTTON_2026-08-06_08-56-13.png)
We are releasing a Daily (1D) Elliott Wave structural framework on Cotton No. 2 ( PEPPERSTONE:COTTON ). Following a clean technical reaction off key multi-confluence support inside the highlighted green circle, price action has been executing a textbook 5-wave
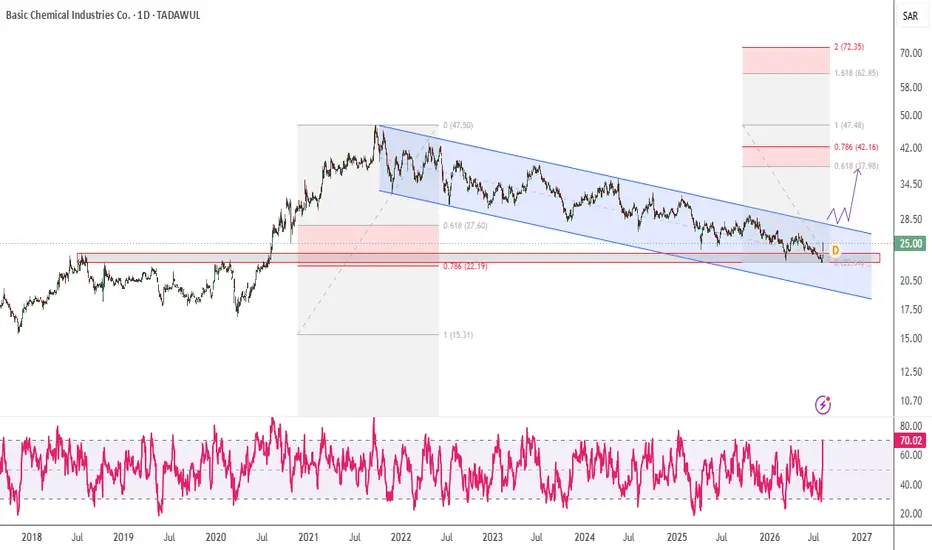
Basic Chemical : Triple Confluence for Upside !TADAWUL:1210
📈 Descending Channel Meets Triple Confluence — Is a Bullish Reversal Brewing? 🇸🇦
The stock continues to trade within a well-defined descending parallel channel, but several technical signals suggest that selling pressure may be fading and a reversal could be taking shape.
With multiple bullish confluences aligning, this is a setup worth keeping on your watchlist.
🔍 Why This Setup Stands Out
📌 1. Descending Parallel Channel
Price remains confined within a descending channel, w
AMZN – Repair Trigger Reclaimed, Add Watch Eligible | CSE OptionAmazon is currently one of the strongest live continuation cases inside my CSE Capital — Option Decision OS, also known as the Continuation Swing Engine.
The current CSE read is very clear: the underlying thesis is intact, the trend is bullish, and the tactical repair trigger has been reclaimed. This is an important shift, because AMZN is no longer in a “wait for repair” state. The stock has already moved above the key repair area and is now trading above the main CSE entry zones.
At the time
NVDA – Thesis Intact, 211 Reclaim Required | CSE Option DecisionNVIDIA remains one of the most important live momentum cases inside my CSE Capital — Option Decision OS, also known as the Continuation Swing Engine.
The current CSE read is very clear: the underlying thesis is still intact, the trend remains bullish, but the system does not classify this as a clean add setup yet. Instead, NVDA is currently in a Hold / Profit Review state with a reclaim watch around the 211 area.
At the time of this CSE snapshot, the provider price is around 207.91. That place
Thob Al-Aseel : Breakout for Upside RallyTADAWUL:4012
🚀 Trendline Breakout Loading? A Sustained Move Above 4 SAR Could Trigger Strong Upside 🇸🇦
The stock is showing encouraging signs of recovery after bouncing from a high-probability Fibonacci demand zone, and it's now approaching a critical trendline resistance that could define the next major move.
This is a setup where confirmation—not anticipation—can offer the best risk-to-reward opportunity.
🔍 Technical Outlook
The recent rebound originated from 3.11 SAR, which coincides w
Saudi Darb Investment : the Start of a Multi-Bagger Move? 🇸🇦TADAWUL:4130
🚀 Weekly Reversal at 2.50: Is This the Start of a Multi-Bagger Move? 🇸🇦
The stock is approaching a major weekly reversal zone around 2.50, a level that could determine the beginning of its next long-term trend.
After spending a prolonged period in accumulation, price is now testing a critical resistance where confirmation—not anticipation—should guide trading decisions.
🔍 Technical Outlook
The 2.50 level is the first major hurdle for the bulls.
A decisive breakout, followed