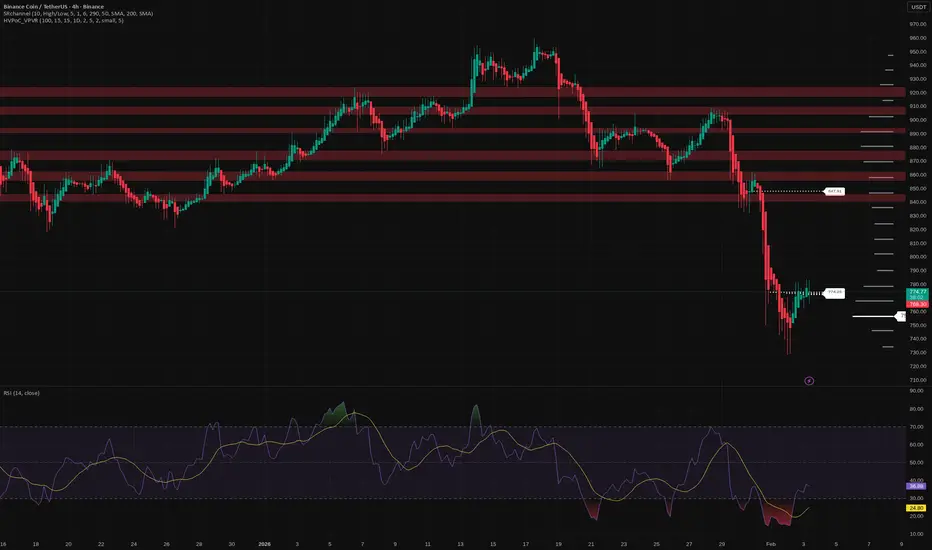
Long
Long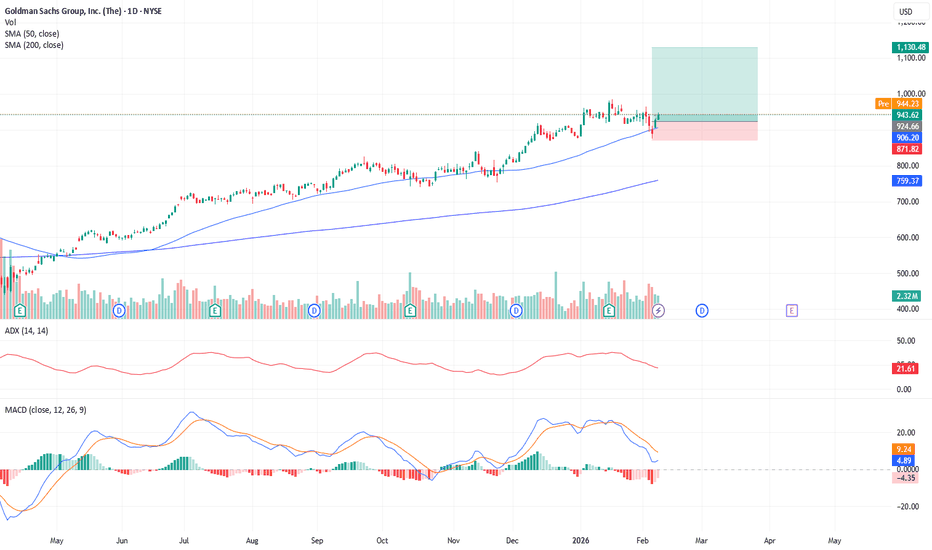
DOT: nearing capitulation? key levels and targets for todayDOT is bleeding again, but are we close to the capitulation wick everyone is hunting for? Lately, according to market chatter, capital keeps rotating into majors and away from smaller L1s, so DOT is drifting with almost no fresh buyers. On the chart that turns every bounce into a sell opportunity so far.
On the 4H chart price is hugging the lows around 1.27 with a clear series of lower highs and heavy supply above 1.33-1.38. RSI sits stuck under 40, classic bear control, and the volume profile shows a fat node above current price and a thin pocket down toward the green zone near 1.12 - meaning a break of support can slide fast. So my base scenario is still downside, with one more leg into that 1.10-1.15 demand before any serious relief.
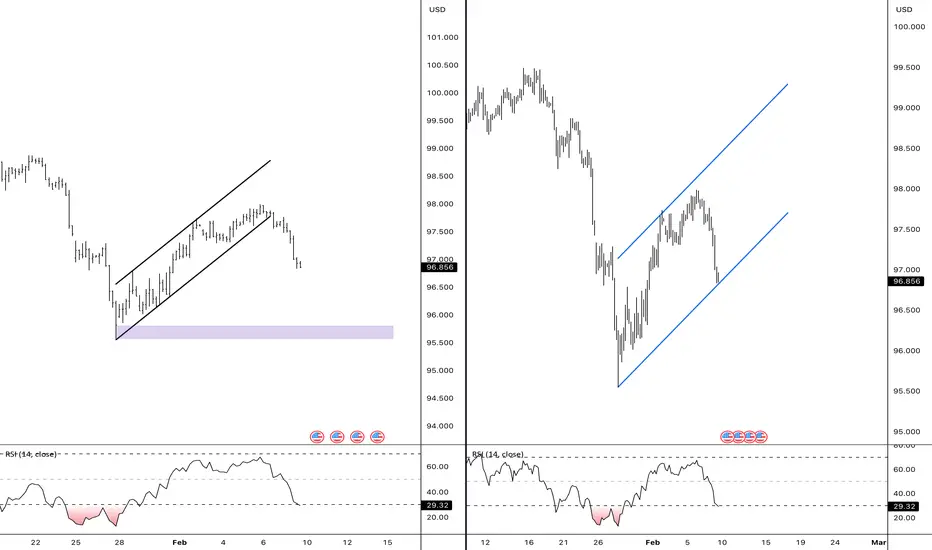
✅ My plan: watch for a weak bounce into 1.33-1.38 to look for short setups with tight invalidation just above that zone, targeting 1.15. If buyers suddenly punch through 1.38 and hold, the script flips and opens the door for a squeeze toward 1.50 and higher supply areas. I might be wrong, but until bulls prove something, I treat DOT as a sell-the-rip market, not a buy-the-dip one. USD Index | Rising Channel BreakdownThe recent USD bounce unfolded within a clearly defined rising channel, but that structure has now been broken to the downside. This suggests the counter-trend move is likely complete, with attention shifting back to the underlying support zone.
From a technical perspective, price has decisively slipped below the lower boundary of the channel, which changes the short-term bias. The highlighted support area below now becomes the primary area of interest, as it represents both prior demand and the origin of the most recent impulsive move higher.
The primary scenario is that price continues to gravitate towards this support zone, where some form of stabilisation or reaction would be reasonable to monitor. As long as price remains below the former channel base, the upside looks more corrective rather than impulsive.
That said, it’s also worth acknowledging that the downside move is becoming increasingly extended on momentum. If support does not hold cleanly, an alternative interpretation is that price may be carving out a broader rising channel, with the recent break acting as a reset rather than a full trend shift.
For now, the key focus is the support zone below. How price behaves there should help clarify whether this is continuation lower, or the early stages of a larger corrective structure taking shape. FSM (USA) - Fortuna Mining Corp Making a Fortune ?Fortuna Mining Corp has been an absolute beast over the last year, putting up a gain of roughly 280% . This is a gold and silver producer with operations spread across West Africa and Latin America, and it has clearly been riding the wave of stronger precious metal prices. When you see a trend this strong, you don’t want to chase it at the top; you want to wait for it to take a breather, and that is what seems to be happening now.
Fundamentally, the picture just got a lot clearer. Gold as a whole seems to be recovering, and the miner recently received a letter from the Malawi government which confirmed that the restriction on raw mineral exports issued in late October 2025 does not apply to the company. That regulatory clarity removes a significant overhang that might have been making investors nervous. Combined with solid production numbers, the story here remains focused on growth and operational stability.
Technically, the chart is setting up for a potential continuation. The price dipped all the way back to just above the 100-day SMA an area that it has found strong support from over the last years run. The RSI has cooled off from overbought territory back to a neutral level, suggesting some of the premium you paid has gone.
If Gold does indeed keep recovering, this stock could be well worth a watch.
..................................................
PLEASE NOTE: Nothing I post is trading advice. All investing involves risk, and past performance doesn’t predict future results. Trends can and do end. For 2026 , my goal is to try and post one new asset each day. Something outside the usual gold, silver, BTC, or big tech names. I like to find stocks worldwide showing steady trends with some good gains, a recent pullback, and signs of renewed strength. I don’t necessarily hold positions in these. They are simply companies I find interesting at the time of posting. I’ll often revisit them within a week to see how they went and share any updates. If you enjoy these posts, please BOOST and FOLLOW ME to discover more under-the-radar stocks and businesses from around the world.
.................................................. RSI Divergence – Momentum Weakening Framework📉 RSI Divergence – Momentum Weakening Framework
This chart illustrates how RSI divergence helps identify weakening momentum during a down move, even when price continues to fall.
RSI divergence is not a buy or sell signal by itself. Instead, it highlights a loss of momentum, often appearing before price stabilizes or reacts.
This framework focuses on:
The relationship between price action and momentum
Identifying exhaustion during sustained moves
Avoiding emotional entries during strong trends
RSI divergence reveals what is changing under the surface, not what price must do next.
📊 Key Observations
1️⃣ Price Action (Lower Low Formation)
In the price chart:
Price continues to make a lower low (LL)
Visually, the trend still appears bearish
At this stage, most traders assume downside continuation.
2️⃣ RSI Behavior (Higher Low Formation)
On the RSI indicator:
RSI fails to make a lower low
RSI instead forms a higher low (HL)
This creates a clear mismatch between price and momentum.
3️⃣ What RSI Divergence Means
RSI divergence occurs when:
Price and RSI move in opposite directions
Price shows strength in the trend, but momentum does not
Important clarification:
RSI divergence does not predict a reversal.
It signals that selling pressure is weakening, even if price is still falling.
4️⃣ Why This Matters
In trending markets:
Price can continue falling even as momentum fades
Strong trends slow down before they reverse or consolidate
RSI divergence often appears during:
Trend exhaustion
Pullback completion
Volatility compression before a reaction
Momentum usually changes before price structure does.
5️⃣ How RSI Divergence Is Used Effectively
RSI divergence works best when:
Used as a context tool, not a trigger
Combined with price structure or support zones
Followed by visible price stabilization or reaction
RSI tells you pressure is changing, not where to enter blindly.
6️⃣ What Invalidates the Idea?
The divergence loses relevance if:
Price continues making strong impulsive lower lows
RSI starts breaking down and follows price lower
No pause or reaction appears in price
Divergence without price response is information, not confirmation.
📊 Chart Explanation
Symbol: FX:EURUSD
Timeframe: 2H
This chart highlights:
Price forming a clear lower low
RSI forming a higher low
A bullish RSI divergence structure
Early signs of momentum exhaustion
Expected Market Behavior:
Strong trend → Momentum slows → Divergence forms → Price stabilizes or reacts
RSI divergence explains why momentum is weakening, not when to enter.
📘 How to Use RSI Divergence Correctly
Best Practices
Use RSI divergence as a warning signal
Always wait for price confirmation
Combine with structure, zones, or trend context
Common Mistake
Buying immediately after spotting divergence
Correct Approach
Let price show that sellers are losing control
⚠️ Disclaimer
For educational purposes only
Not financial advice
Markets involve risk  Education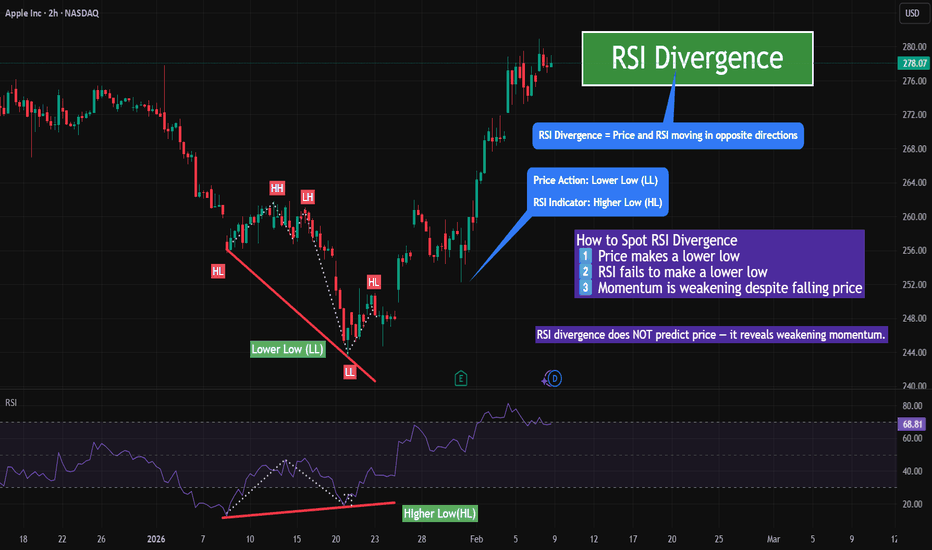
 Short
Short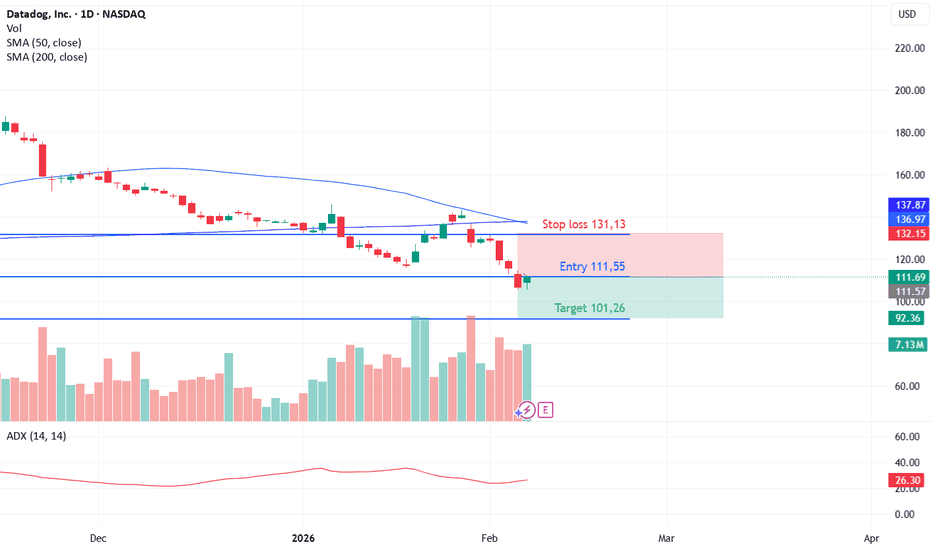
Litecoin: potential bounce or deeper drop? key levels to watchLitecoin. Catching the falling knife or loading a discount alt bluechip here? While the whole crypto market just got washed out on fresh regulatory noise and another wave of BTC volatility, LTC dumped into multi‑month lows and finally printed a nasty but promising wick from the 44–45 area. According to market chatter, majors are seeing rotation back in as panic cools off.
On the 4H chart price bounced to 52–53 after a vertical selloff, RSI was buried under 30 and is curling up, and there’s a clear volume gap above current levels. I’m leaning toward a relief rally: first magnet for me is the 57–58 zone, then stronger supply around 60–62 where the big volume shelf starts. Trend is still bearish overall, so I treat this as a counter‑trend squeeze, not a new bull market… yet. I might be wrong, but dead cats usually bounce higher than this.
My base plan: ✅ look for longs only while price holds above 50–51, targeting 57–58 and possibly 60–62 if momentum stays hot. ⚠️ If 50 gives way again, I expect sellers to drag LTC back to 45–46 and maybe sweep that spike low. I’m stalking a small long on dips toward 51 with stops tucked below 49, and I’ll happily flip bias if we lose that support with volume. Stellar: bounce ahead or more pain? key levels to watchStellar. Knife catching or discount hunting? Recently the whole alt sector got hit as traders rotated out of risk after fresh macro comments, and according to market news Stellar just rode that same liquidation wave. Price flushed into fresh lows, sentiment is in the gutter... exactly where interesting bounces usually start.
On the 4H chart we have a waterfall drop into the 0.15 area with a volume spike and RSI buried in oversold, starting to curl up. Local HVN sits around 0.17, so any short squeeze has a natural magnet there, with heavier supply stacked higher near 0.185-0.19. Technically I lean to a relief long scenario, not a fresh trend reversal yet. ✅
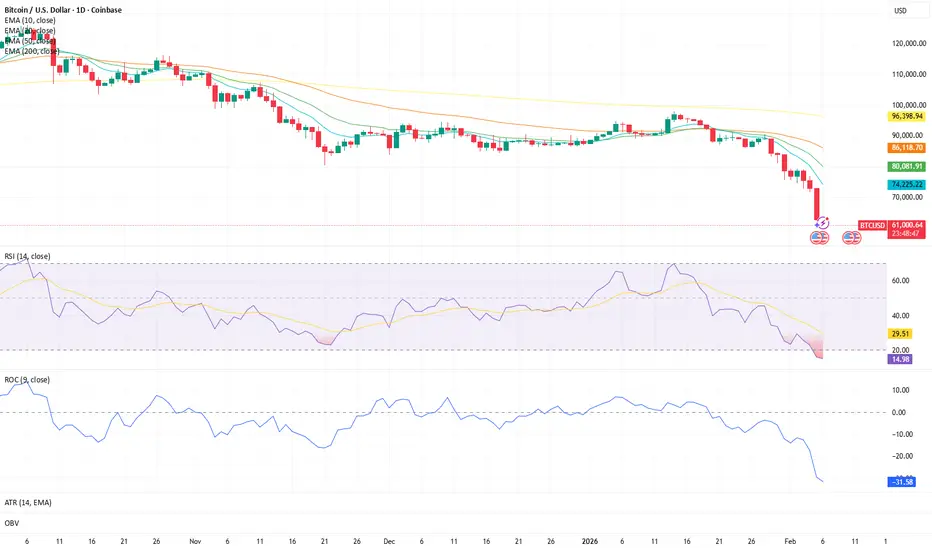
My base plan: watch 0.15-0.152 as a bounce zone, with intraday targets at 0.17 first, then 0.185 if buyers stay brave. If 0.145 gives way and price can't reclaim 0.16 quickly, I drop the long idea and expect continuation toward 0.14-0.135 instead. I might be wrong, but this looks more like late capitulation than a comfortable place to open new shorts, so I’m only interested in tactical longs here with tight risk. Bitcoin Structure Update (Daily)Bitcoin remains in a bearish structural regime on the daily timeframe.
Price continues to trade below the 200 EMA, with the 10, 20, and 50 EMAs all positioned beneath it. Shorter-term EMAs (10 & 20) maintain downward curvature, indicating that downside pressure remains unresolved and trend structure has not yet repaired.
Momentum & Participation
RSI: Downside pressure remains elevated, but momentum is beginning to decelerate following the most recent daily close. RSI is still deeply stretched and remains below key recovery thresholds, signaling early stabilization rather than confirmation.
Rate of Change (ROC): The pace of the decline is slowing, suggesting downside momentum is no longer accelerating. However, ROC remains negative, indicating that pressure has eased but has not yet transitioned into a positive regime.
Summary
Structure remains bearish. Momentum is showing early signs of deceleration, but no confirmed reversal or structural reclaim is present at this time. This remains a structural assessment of current conditions, not a prediction.  Short
Short
DF (Canada) - Slow And Steady Wins The Race?Given all the crazy volatility across metals, stocks, and crypto at the moment, I thought Id have a look for those quieter slow and steady stocks / etfs that are just ticking away and staying out of the drama.
Dividend 15 Split Corp II has quietly put together a very strong run, gaining over 54% in the last year. While the big tech names usually grab the headlines, this Canadian split share corporation has been trending steadily higher in a clear channel. It essentially acts as a leveraged bet on reliable dividend payers, and right now, in the current market, that momentum is hard to ignore.
Fundamentally, this strength is being driven by the performance of its underlying portfolio, which consists of 15 high-quality Canadian blue chips like banks, utilities, and telcos. As interest rate pressure eases, money has been rotating back into these yield-heavy sectors. Because of the split share structure, the Class A shares (DF) amplify the gains of those underlying stocks, which explains the aggressive move up compared to the broader Canadian TSX. The recent pause in price action looks like a healthy breather rather than a reversal.
Technically, the chart is well-behaved. The price has been respecting a rising channel for months, making higher highs and higher lows. The recent pullback successfully tested support near the moving average (the red line), and buyers stepped back in. The RSI is sitting at a comfortable 63, meaning there is still room to run before it gets technically overbought. It might be a little more expensive than it could be, but depends how long you want to hold it.
Might be worth a watch if you like yield with a side of momentum. ..................................................
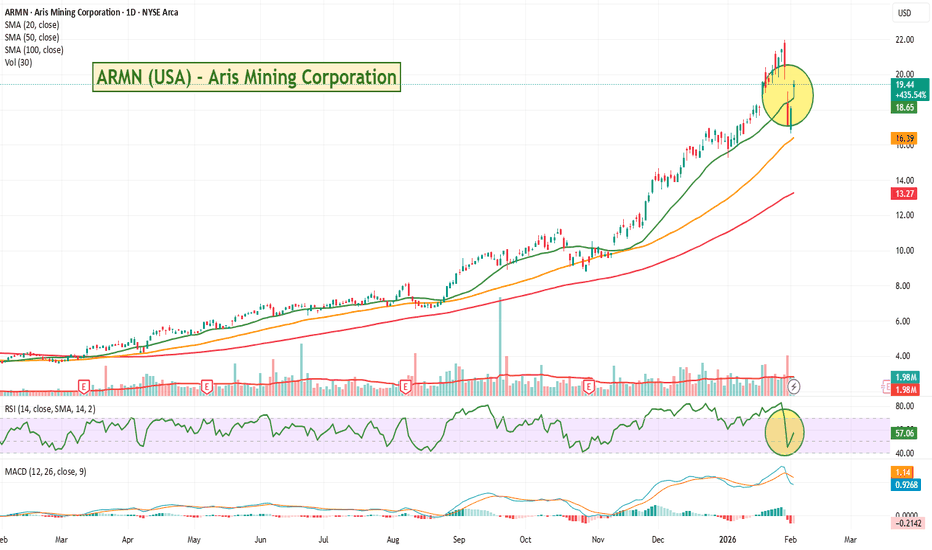
PLEASE NOTE: Nothing I post is trading advice. All investing involves risk, and past performance doesn’t predict future results. Trends can and do end. For 2026 , my goal is to try and post one new asset each day. Something outside the usual gold, silver, BTC, or big tech names. I like to find stocks worldwide showing steady trends with some good gains, a recent pullback, and signs of renewed strength. I don’t necessarily hold positions in these. They are simply companies I find interesting at the time of posting. I’ll often revisit them within a week to see how they went and share any updates. If you enjoy these posts, please BOOST and FOLLOW ME to discover more under-the-radar stocks and businesses from around the world. .................................................. ARMN (USA) - Gold Star Gold MinerAris Mining Corporation has been an absolute rocket ship over the last year, putting in a gain of over 430% . Based primarily in Colombia, Aris is a gold producer with high-grade underground operations. When you see a miner outperform the spot price of gold by this margin, it usually means they aren't just riding the commodity wave, but they are actively executing on production growth and expansion.
Fundamentally, the story here is about scaling up. They have been successfully expanding their Segovia operations and are pushing forward with major developments at Marmato. The stock has seen a sharp pullback recently caused by te overall market dropping as well as standard profit-taking after a parabolic run. There has been some chatter about rising costs (AISC) as they spend money to expand, which often gives traders an excuse to lock in gains. However, with gold prices remaining robust and their production numbers climbing, the core thesis for holding this miner remains intact.
Technically, the pullback has been orderly. As you can see on the chart, the price dropped right into the 20-day SMA area (the green line) and stayed above the 50. This is often where aggressive trend followers step back in. The RSI has reset from overbought levels down to a much more manageable 57, clearing out some of the gold hype without breaking the uptrend. The MACD histogram shows the selling momentum is already fading, suggesting the consolidation might be nearing its end.
Might be worth a watch.
..................................................
PLEASE NOTE: Nothing I post is trading advice. All investing involves risk, and past performance doesn’t predict future results. Trends can and do end. For 2026 , my goal is to try and post one new asset each day. Something outside the usual gold, silver, BTC, or big tech names. I like to find stocks worldwide showing steady trends with some good gains, a recent pullback, and signs of renewed strength. I don’t necessarily hold positions in these. They are simply companies I find interesting at the time of posting. I’ll often revisit them within a week to see how they went and share any updates. If you enjoy these posts, please BOOST and FOLLOW ME to discover more under-the-radar stocks and businesses from around the world. .................................................. A
USDT: are we due for a relief rally? key levels to monitorMarket Cap USDT Dominance. Ready for a crypto relief rally or is fear just getting started? While majors cooled off after the latest macro jitters and profit taking, traders have been hiding in stables, and dominance spiked hard according to market data. Now price is stalling right at the local highs, so this level suddenly matters a lot.
On the 4H chart we’ve got a vertical pump into 7.1–7.3% plus RSI sitting in overbought and already curling down – classic “too much, too fast” vibes. Biggest volume shelf is down around 6.3–6.4%, so any unwind of fear can send dominance back into that value zone, which usually means a bounce for BTC and alts. I might be wrong, but current structure looks more like a blow‑off than the start of a calm uptrend.
My base case ✅ rejection below 7.2% and a pullback toward 6.4% and possibly 6.2%, where I’d look to add risk on strong coins. Trigger for me is a 4H close back under 7.0% with RSI dropping from overbought. ⚠️ If buyers smash through 7.3% and hold above, then I’ll respect the squeeze, expect 7.5%+ on dominance and stay defensive on alt exposure. Bitcoin: mean-reversion play? key levels and targets aheadBitcoin. Who survived that liquidation nuke and who’s still coping with the PnL trauma? After the latest cascade of longs getting wiped and headlines about cooling ETF flows and tighter liquidity, sentiment flipped from euphoria to “get me out.” That’s exactly when I start hunting for mean‑reversion plays.
On the 4H chart we just bounced off a chunky demand block around 76–77k, with a clear volume spike on the low and RSI crawling out of oversold. Price is now camping under the first supply zone near 79.5–80k, right where the last dump accelerated. That combo looks like a classic relief‑rally setup, so I’m leaning short‑term long, aiming back into the 81–82.5k high‑volume area.
My plan: I want a small dip toward 77.5–78k to join buyers, with invalidation under 76k. Base case – squeeze into 81–82.5k, maybe even a wick toward 83.5k, where I’d start scaling out. If 76k breaks on strong volume, I drop the long idea and look for the next flush into 74–75k support. I might be wrong, but fading a freshly washed‑out Bitcoin has rarely aged well. ✅ Asahi Holdings - Gold and Precious Metals Recycler Running.
Asahi Holdings Inc has been an absolute powerhouse over the last year, putting up a gain of nearly 100% . Based in Japan, this company isn't your household brand, but they are a massive player in recycling precious metals like gold, silver, and palladium from electronics and dental materials. When commodities run hot, companies that refine and sell them tend to follow suit, and this chart shows exactly that kind of steady, aggressive buying pressure.
Fundamentally, the story here is all about the underlying metal prices. Today’s earnings report confirms that high gold and palladium prices are boosting their margins, but the immediate reaction on the chart suggests the good news was already priced in and the dip in Silver and Gold caught them out as well as the rest of the industry. We saw a gap up at the open followed by a fade, which is a classic "sell the news" event. Traders are taking profits after a long run, even if the business itself and its revenues remains solid.
Technically, the trend is still very much intact despite today's red candle. The price has dipped under the 20-day SMA (the green line), which has acted as reliable support throughout this entire uptrend. The RSI is cooling off from overbought territory, dropping back into the mid-50s, which gives the stock some room to breathe and attract investors who might have felt they missed out. The MACD is flattening out, indicating that the immediate buying frenzy is pausing, but it hasn’t collapsed. Now that we are past earnings and got a green candle back on the board it will be interesting to see if it runs again.
Could be one to keep an eye on - especially if we see a recovery in Gold and Silver.
..................................................
PLEASE NOTE: Nothing I post is trading advice. All investing involves risk, and past performance doesn’t predict future results. Trends can and do end. For 2026 , my goal is to try and post one new asset each day. Something outside the usual gold, silver, BTC, or big tech names. I like to find stocks worldwide showing steady trends with some good gains, a recent pullback, and signs of renewed strength. I don’t necessarily hold positions in these. They are simply companies I find interesting at the time of posting. I’ll often revisit them within a week to see how they went and share any updates. If you enjoy these posts, please BOOST and FOLLOW ME to discover more under-the-radar stocks and businesses from around the world. .................................................. MNST (USA) - Monster Beverage on a Monster RunMonster Beverage Corporation has put in a solid run over the last 12 months, sitting on a gain of roughly 63% . It’s a steady grinder rather than a rocket ship, which I tend to prefer for the longer term. Most people know the brand for its energy drinks, and despite the health-conscious shifts in the market, they keep finding ways to sell cans. The trend here is up, and it’s showing decent strength despite the overall market drop over the last couple of days.
Fundamentally, the momentum seems driven by their ability to maintain pricing power and expand their footprint internationally. The integration of the Bang Energy assets and the rollout of their alcohol line, The Beast Unleashed , are adding new layers to their overall momentum. We are also seeing improving margins as supply chain costs settle down. The recent pause in price just looks like investors taking some gains off the table after a strong run-up into the new year as well as the overall market dump over the last few days.
Technically, the structure remains bullish. The price is riding well above the 50-day SMA (the orange line), which has acted as support for months, and despite the pullback is still above the 20 day which has been a good short term support area. We are seeing a bit of consolidation near the highs, with the RSI cooling off to around 62 . That’s a healthy reset from overbought territory. The MACD is showing a slight dip in momentum, but the price isn't breaking down, which suggests buyers are still hanging around.
Might be worth a watch if it regains ground and heads back up.
..................................................
PLEASE NOTE: Nothing I post is trading advice. All investing involves risk, and past performance doesn’t predict future results. Trends can and do end. For 2026 , my goal is to try and post one new asset each day. Something outside the usual gold, silver, BTC, or big tech names. I like to find stocks worldwide showing steady trends with some good gains, a recent pullback, and signs of renewed strength. I don’t necessarily hold positions in these. They are simply companies I find interesting at the time of posting. I’ll often revisit them within a week to see how they went and share any updates. If you enjoy these posts, please BOOST and FOLLOW ME to discover more under-the-radar stocks and businesses from around the world. ..................................................