Long
Long
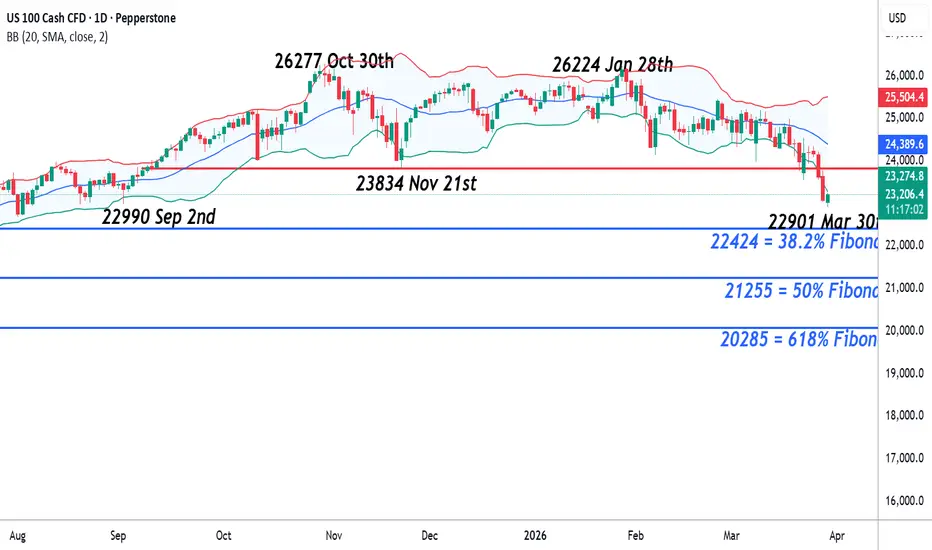
Iran conflict and Key US Data Collide to Influence sentimentIt’s the start of a critical week for US 100 traders. The index entered correction territory on Friday, officially defined as a move of 10% below its previous high, and it briefly extended that fall in early trading this morning when it touched a low of 22901 before recovering to trade around 23162 at time of writing (0700 BST). Part of the reason for the early drop to 8-month lows could have been news of the arrival of 3500 US troops in the Middle East region on Saturday, via an amphibious assault ship (Bloomberg), which has forced traders to consider the possibility of a US led ground assault of Iran, or it could have been news that Iranian backed Houthi rebels in Yemen have officially entered the conflict after firing ballistic missiles at Israel over the weekend, opening up a new risk to oil shipments from the region.
Whatever the reason for the fall and initial rebound, the price action may have already grabbed the attention of traders, which could be a good thing considering the list of scheduled events this week that may also influence the direction of the US 100 index. For example, later today Federal Reserve Chair Jerome Powell is due to speak (1530 BST) at a moderated discussion at Harvard University. Any comments he makes regarding the impact of the Iran war on inflation, growth or future interest rate moves could set the early tone for risk sentiment.
Not only that, but there are also 4 updates on the health of the US labour market due this week, starting with the JOLTs Job Openings release at 1500 BST on Tuesday, then ADP Private Sector Payrolls on Wednesday (1315 BST), Initial Jobless Claims on Thursday (1330 BST) and ending with the pivotal Non-farm Payrolls release on Friday (1330 BST). These releases may face a deeper level of scrutiny and their outcome could have a more significant influence on the direction of the US 100 index as traders try and ascertain the on-going impact of the Iran conflict on US economic growth.
Technical Update: A Potentially Important Breach of Support in Focus
Recent price activity within the US 100 index has been skewed to the negative side. The latest decline produced the first closing breaks below 23834, the November 21st correction low, and pushed the index to levels last seen on September 2nd, 2025.
In the current uncertain environment, traders may be asking whether this decline has further to run.
Potential Support Levels:
Following the latest price weakness, support levels are the first area to monitor. As shown in the chart below, the September 2nd low at 22990 may now be a key level for traders to focus on.
It may prove useful to monitor how 22990 is defended on a closing basis. While a sustained close below this level may not guarantee further weakness, it could suggest scope for a move toward 22424, which is the 38.2% retracement of the entire April 7th to October 30th 2025 advance. If 22424 is then also broken on a closing basis, it could imply a more extended phase of weakness and a deeper retracement.
Potential Resistance Levels:
While support at 22990 continues to hold on a closing basis, the risks for price strength and fresh upside could begin to reemerge. This could place initial resistance at 23621, a level which is equal to half of the latest decline, under pressure. Closing breaks above this level could indicate potential for attempts at renewed price strength.
As shown in the chart above, a closing break above 23621, may shift focus toward the next resistance at 23879, which is the 38.2% retracement of the latest weakness. Breaks above this level could then potentially open moves toward 24178, the 50% level, and even 24476, the higher 61.8% retracement.
The material provided here has not been prepared accordance with legal requirements designed to promote the independence of investment research and as such is considered to be a marketing communication. Whilst it is not subject to any prohibition on dealing ahead of the dissemination of investment research, we will not seek to take any advantage before providing it to our clients.
Pepperstone doesn’t represent that the material provided here is accurate, current or complete, and therefore shouldn’t be relied upon as such. The information, whether from a third party or not, isn’t to be considered as a recommendation; or an offer to buy or sell; or the solicitation of an offer to buy or sell any security, financial product or instrument; or to participate in any particular trading strategy. It does not take into account readers’ financial situation or investment objectives. We advise any readers of this content to seek their own advice. Without the approval of Pepperstone, reproduction or redistribution of this information isn’t permitted.
UK 100 Index – Facing a Potential Shift in SentimentDuring early March the UK 100 outperformed other European indices, in that it didn’t fall as much, when confronted with the challenge of the escalating Iran conflict. While general risk off sentiment saw selling of the UK’s primary index, its weighting towards multi-national corporates rather than simply UK affiliated businesses, alongside exposure to key commodity, energy and defense sectors helped to slow the drop off which udermined others such as the Germany 40, an index packed with industrial corporates heavily exposed to soaring energy prices.
However, last week saw a significant shift in sentiment as traders began to face up to the reality that the Iran conflict may last longer than hoped or initially anticipated. This raised inflation expectations and led to a spike in UK bond yields on the basis that the Bank of England may be forced to flip from cutting interest rates to support a sluggish economy, and pivot to hiking interest rates quickly to stop inflation from spiking due to higher cost of oil and natural gas.
These concerns reached a peak yesterday morning when major concerns about an imminent escalation of the Iran war were rippling through financial markets. At one point, UK bond yields reached their highest level since 2008, as investors priced in as many as 4 25bp (0.25%) hikes from the Bank of England in 2026, a massive shift from expecting 2 25bp (0.25%) cuts through 2026 before the Iran conflict started. This led traders to fret about the sustainability of UK government finances and the negative impact on growth in the economy, which ultimately saw the UK 100 fall to 4 month lows of 9669, before recovering some of its lost ground to trade at 9886 at the time of writing (0630 GMT). The rebound being supported by US President Trump’s decision to postpone bombing of Iran’s energy grid.
Looking forward, while UK 100 prices may continue to be driven by updates on whether a de-escalation of the Iran conflict is a real possibility, tomorrow’s UK CPI reading, released at 0700 GMT could also prove to be relevant. A higher-than-expected release could weigh on UK assets, while a tamer reading could help to calm frayed nerves.
UK 100 Index Technical Update: Gauging Potential Support Within Increasing Volatility Sell-Off
Since the outbreak of hostilities between the US and Iran, the UK 100 index has come under increasing selling pressure, falling as much as 11.5% from its highs in late February, as concerns over the impact of a prolonged conflict and rising energy prices weigh on global economic expectations. As the weekly chart below shows, this down move has produced a more extended retracement of the April 2025 to February 2026 advance.
Now, after Monday’s brief relief rally, traders may be asking where next for the UK 100? In this regard, it could be useful to identify what could be the relevant support and resistance levels that could help determine the next directional themes.
Potential Support Levels:
The Fibonacci retracements from the April 2025 low (7525) to the 10,932 all‑time high can help highlight potential support areas to monitor through the remainder of this week. The 38.2% retracement at 9637 could mark the first key support zone and is possibly where traders are now focused.
As the chart above highlights, closing breaks below 9637 could expose further downside risks toward the 9425 level, which is the November 2025 low. If that also gives way, weakness may extend toward 9233, which is the 50% retracement.
Potential Resistance Levels:
While the initial support at 9637 holds any further price weakness, attention may shift to identifying resistance levels that could cap any rebound or lead to further price strength if they give way on a closing basis. In this regard, traders may be watching a resistance band at 9970/10061, which is a combination of the 38.2% and 50% Fibonacci retracements of the March 18th to 23rd decline.
As the daily chart above shows, if closing breaks above 9970/10061 were seen, it could signal renewed attempts at price strength, opening the way for a move toward 10152, the 61.8% retracement. Sustained closes above 10152 could open potential for further gains toward 10452, which is the March 18th high.
The material provided here has not been prepared accordance with legal requirements designed to promote the independence of investment research and as such is considered to be a marketing communication. Whilst it is not subject to any prohibition on dealing ahead of the dissemination of investment research, we will not seek to take any advantage before providing it to our clients.
Pepperstone doesn’t represent that the material provided here is accurate, current or complete, and therefore shouldn’t be relied upon as such. The information, whether from a third party or not, isn’t to be considered as a recommendation; or an offer to buy or sell; or the solicitation of an offer to buy or sell any security, financial product or instrument; or to participate in any particular trading strategy. It does not take into account readers’ financial situation or investment objectives. We advise any readers of this content to seek their own advice. Without the approval of Pepperstone, reproduction or redistribution of this information isn’t permitted.
 Long
Long
Long 
 Short
Short
HOW-TO: Understand Liquidity and Track It in Real TimeUnderstanding Liquidity — and Why It Moves Markets
Most traders watch price. Institutional players watch where orders are waiting.
Every market is driven by two forces: participants who want to trade now (market orders) and those who want to trade at specific prices (limit and stop orders). These resting orders — stop-losses, take-profit targets, and limit entries — tend to accumulate at predictable price levels. This accumulation is what we call liquidity.
When enough liquidity gathers at a level, it becomes a magnet. Large players rely on it to fill positions without moving price against themselves. Retail stop-losses sitting just beyond key levels become fuel. Understanding where liquidity resides is understanding where price is likely to go next.
How to Observe Liquidity in Real Time
Understanding liquidity conceptually is one thing — observing it in real time is another.
To track these zones directly on the chart, Liquidity Radar can be used to identify areas where stop and limit orders are likely concentrated. The tool evaluates volume activity and key price ratios relative to each bar’s opening price to estimate where liquidity may be building.
When multiple levels appear near the same price, their overlap highlights increased density — these are the areas to pay attention to.
Levels are color-coded by side:
• Buy-side liquidity appears below price (where long stop-losses and limit buy orders tend to accumulate)
• Sell-side liquidity appears above price (where short stop-losses and limit sell orders gather)
Line thickness reflects participation — thicker levels indicate zones formed during higher volume activity.
How to Read the Liquidity Profile
To simplify the reading of multiple levels, the Liquidity Profile can be used as an aggregated view.
Instead of analyzing individual lines, the profile groups liquidity into horizontal zones. Each row represents a price area, and the width of each bar reflects how densely liquidity levels are clustered there, weighted by their volume significance.
Wide sections highlight areas where orders are concentrated. Thin or empty areas indicate zones where price may move more freely.
Focusing on the active price range helps keep attention on what is immediately relevant, rather than the full historical set of levels.
This approach also avoids chart limitations, as it works with the full internal dataset rather than only the visible lines.
How to Use Volume Activity for Confirmation
Liquidity interactions are often accompanied by changes in participation.
The Volume Activity Meter can be used to assess whether activity is increasing or fading as price approaches or reacts to a liquidity zone. It evaluates volume relative to expected participation, normalized across timeframes.
• Strong colors (deep green / dark red) indicate high participation
• Softer tones (aqua / orange) indicate reduced activity
• The 💥 marker highlights significant spikes, often aligning with liquidity events or structural moves
This helps confirm whether a reaction at a level is supported by meaningful activity.
How to Interpret Price Behavior at Liquidity Zones
When price reaches a high-liquidity zone, a reaction is expected due to the concentration of orders.
These zones often trigger a surge in execution — commonly referred to as a liquidity grab or stop hunt — which may result in sharp moves or long wicks.
From there, three types of behavior are typically observed:
• Stall or consolidation — price pauses as the market absorbs the orders
• Reversal — price turns after clearing weak positions
• Continuation — price moves further in the same direction, using the triggered liquidity as momentum
Observing which of these unfolds helps build context around market intent.
How to Read Price Between Liquidity Zones
The space between liquidity clusters is equally important.
In these areas, resting orders are relatively limited. With less resistance, price can move more freely — often accelerating between zones.
These conditions can lead to fast directional moves, but also to whipsaws or false breakouts. At the same time, when price leaves a dense zone and enters a low-liquidity area, momentum can build quickly.
Tracking both clusters and gaps provides a more complete view of market structure.
Putting It All Together
Liquidity zones represent areas where the market is most likely to react.
By identifying where liquidity is concentrated — and observing how price behaves around those levels — it becomes possible to focus on key decision areas rather than random price movement.
Using tools that visualize these zones in real time helps structure this process, making it easier to follow how liquidity influences price as it unfolds.
Education 
NYSE Moves Toward 24/7 Stock Trading With Blockchain PushThe financial world is entering a new phase of innovation. Traditional systems no longer meet modern demand. Investors want speed, flexibility, and continuous access. This shift has pushed major institutions to rethink how markets operate. Now, tokenized stock trading stands at the center of this transformation. The New York Stock Exchange(NYSE) has taken a bold step forward. It has partnered with Securitize to build a blockchain-powered platform. This platform will allow stocks to trade as digital tokens. Unlike traditional markets, it will operate around the clock. This development signals a major evolution in how global markets function.
As a result, Wall Street is embracing crypto-style infrastructure. The move combines trust with innovation. It also introduces real-time settlement and stablecoin funding. Therefore, the system could reshape how investors access and trade assets worldwide.
Why NYSE Is Betting On Tokenized Markets
The traditional stock market follows fixed trading hours. This system limits global participation. Investors often miss opportunities due to time zone differences. However, tokenized stock trading removes these barriers completely.
NYSE recognizes this growing demand for accessibility. By adopting blockchain technology, it aims to modernize its operations. The new platform will allow assets to exist as digital tokens. These tokens can move instantly across networks. As a result, users can trade anytime without waiting for market openings.
Moreover, the blockchain stock market structure increases transparency. Every transaction records on a distributed ledger. This improves trust and reduces errors. Therefore, both retail and institutional investors benefit from greater efficiency
How Tokenized Stock Trading Actually Works
Tokenized stock trading converts traditional equities into blockchain-based tokens. Each token represents ownership of a real-world stock. These tokens function just like cryptocurrencies but link to regulated assets.
The system uses blockchain networks to record transactions. When investors trade tokens, the network verifies and settles instantly. This removes the need for intermediaries like clearinghouses. As a result, settlement times drop from days to seconds.
Additionally, stablecoins will fund transactions on this platform. These digital currencies maintain stable value. Therefore, they reduce volatility during trades. This ensures smoother operations within a 24 7 trading environment.
The Rise of 24 7 Trading in Global Finance
Markets never sleep in the digital age. Crypto exchanges already operate nonstop. Now, traditional finance wants to follow the same model. The NYSE initiative brings 24 7 trading closer to reality.
This shift offers several advantages. Investors gain flexibility to react instantly to global events. They no longer wait for market hours to adjust positions. As a result, liquidity increases across time zones.
Furthermore, continuous trading supports global participation. Investors from Asia, Europe, and America can trade simultaneously. This creates a more connected financial ecosystem. Therefore, markets become more dynamic and efficient.
Stablecoins Power The New Financial Infrastructure
Stablecoins play a crucial role in this transformation. They provide a stable medium for transactions. Unlike cryptocurrencies, their value remains consistent. This makes them ideal for trading environments.
NYSE plans to integrate stablecoin-based funding into its platform. This allows seamless transfers between accounts. Investors can move funds instantly without relying on banks. As a result, trading becomes faster and more efficient. Additionally, stablecoins support global accessibility. Users can participate without traditional banking barriers. Therefore, 24 7 trading becomes more inclusive and scalable.
The Future Of Financial Markets Looks Always On
The NYSE partnership marks a turning point in financial history. It blends traditional finance with blockchain technology. This creates a hybrid system that combines trust with efficiency.
As tokenized stock trading grows, more institutions will follow. The demand for 24 7 trading will continue to rise. Investors now expect constant access to markets. Therefore, always-on systems will become the new standard.
In the coming years, the blockchain stock market could dominate global finance. This transformation will redefine how assets trade, settle, and store value. As a result, the financial world will become faster, smarter, and more connected.  Short
Short
Institutional Bias is SHORT. My Order Flow Waits For The Entry🛑 Institutional Bias is SHORT. Why my Order Flow is BLOCKING the Entry.
The market is bleeding. If you trade manually, your amygdala is screaming at you to slam "SELL" before you miss the drop.
But according to the quantitative data printing right now on my chart:
⏳ SYSTEM DECISION: STANDBY — Awaiting final confirmation.
Retail traders lose money because they blindly trade the direction. Professional Quants win because they trade the Entry Timing.
Here is the exact order flow reality of why I am not shorting this yet. 👇
(Note: Order flow is dynamic; these specific metrics update tick-by-tick).
⚙️ THE TRAP: Macro vs. Micro Conflict
To win in this game, knowing that Gold is bearish isn't enough. Right now, we have a dangerous divergence in the data:
🩸 The Macro Picture (READY TO SHORT): Institutional Supply and Macro Structure are perfectly aligned (Short 4/4). The big money wants this to go lower.
⚠️ The Micro-Execution (WAIT FOR TIMING): Look at the underlying execution triggers:
❌ Price Velocity (ROC H1): STALLING.
🟢 H1 ROC Momo: BUYERS.
What does this mean in the order book?
At this exact micro-second, localized buying algorithms are absorbing the selling pressure. The downward momentum has temporarily died. If you market-short right now just because "the candle is red," you are shorting directly into active buyers. You are providing the exact Exit Liquidity that larger funds need.
🎯 TRADING THE EXACT PRICE (The Sniper Approach)
Amateurs market-execute out of FOMO anywhere on the chart. Quants define the exact coordinates in advance. The models have already calculated the mathematical battlefield for today:
🎯 Target Entry Level: 4294.41 (SHORT)
📐 Entry Zone:
But having the target price is useless without the trigger. I am not entering at 4294.41 until the micro-momentum (H1 ROC) shifts back in our favor. We want to execute in that specific zone only when the buyers have exhausted their absorption.
🚪 THE LONDON GATE: The Missing Fuel
Add to this the London session data: ⏸️ INSIDE (Skip).
Professional breakout systems rely on "statistical fuel"—trapped liquidity. A clean London "Judas Swing" traps early retail traders and uses their stop-losses to fuel the New York expansion.
Today, London stayed inside its range. There is no major trap. Without that engineered liquidity, entering a breakdown is statistically dangerous. The move becomes sluggish, choppy, and prone to violent mean-reversion pullbacks.
💼 THE QUANTITATIVE EDGE
This is a Grade B (Standard) setup. The macro direction is beautiful, we have the exact Entry Level, but the final timing triggers are stalling.
We don't force entries. We let the algorithms fight it out, and we pull the trigger only when the execution aligns with the bias. That is how you protect capital.
🎯 Stop guessing the breakdown. Start reacting to confirmed data.
If you want to stop trading blind, the MarketMakersLab Quant Radar I use to track this is live on my TradingView profile.
👇 I’M DROPPING ALPHA FOR FREE.
I could keep this institutional logic behind closed doors, but I’m putting it out there. If you want me to keep exposing how the sausage is made, drop a 🚀 in the comments and smash the like button. It costs you $0.00, it feeds the algorithm, and it tells me to keep printing these. Deal?
⚠️ Disclaimer: The content of this post is strictly educational. It does not constitute financial advice. Market data is dynamic and constantly evolving. Trading involves massive risk. Always do your own research and manage your risk.  Short
Short
 Long
Long
UK 100 Index – Facing a Potential Shift in SentimentDuring early March the UK 100 outperformed other European indices, in that it didn’t fall as much, when confronted with the challenge of the escalating Iran conflict. While general risk off sentiment saw selling of the UK’s primary index, its weighting towards multi-national corporates rather than simply UK affiliated businesses, alongside exposure to key commodity, energy and defense sectors helped to slow the drop off which udermined others such as the Germany 40, an index packed with industrial corporates heavily exposed to soaring energy prices.
However, last week saw a significant shift in sentiment as traders began to face up to the reality that the Iran conflict may last longer than hoped or initially anticipated. This raised inflation expectations and led to a spike in UK bond yields on the basis that the Bank of England may be forced to flip from cutting interest rates to support a sluggish economy, and pivot to hiking interest rates quickly to stop inflation from spiking due to higher cost of oil and natural gas.
These concerns reached a peak yesterday morning when major concerns about an imminent escalation of the Iran war were rippling through financial markets. At one point, UK bond yields reached their highest level since 2008, as investors priced in as many as 4 25bp (0.25%) hikes from the Bank of England in 2026, a massive shift from expecting 2 25bp (0.25%) cuts through 2026 before the Iran conflict started. This led traders to fret about the sustainability of UK government finances and the negative impact on growth in the economy, which ultimately saw the UK 100 fall to 4 month lows of 9669, before recovering some of its lost ground to trade at 9886 at the time of writing (0630 GMT). The rebound being supported by US President Trump’s decision to postpone bombing of Iran’s energy grid.
Looking forward, while UK 100 prices may continue to be driven by updates on whether a de-escalation of the Iran conflict is a real possibility, tomorrow’s UK CPI reading, released at 0700 GMT could also prove to be relevant. A higher-than-expected release could weigh on UK assets, while a tamer reading could help to calm frayed nerves.
UK 100 Index Technical Update: Gauging Potential Support Within Increasing Volatility Sell-Off
Since the outbreak of hostilities between the US and Iran, the UK 100 index has come under increasing selling pressure, falling as much as 11.5% from its highs in late February, as concerns over the impact of a prolonged conflict and rising energy prices weigh on global economic expectations. As the weekly chart below shows, this down move has produced a more extended retracement of the April 2025 to February 2026 advance.
Now, after Monday’s brief relief rally, traders may be asking where next for the UK 100? In this regard, it could be useful to identify what could be the relevant support and resistance levels that could help determine the next directional themes.
Potential Support Levels:
The Fibonacci retracements from the April 2025 low (7525) to the 10,932 all‑time high can help highlight potential support areas to monitor through the remainder of this week. The 38.2% retracement at 9637 could mark the first key support zone and is possibly where traders are now focused.
As the chart above highlights, closing breaks below 9637 could expose further downside risks toward the 9425 level, which is the November 2025 low. If that also gives way, weakness may extend toward 9233, which is the 50% retracement.
Potential Resistance Levels:
While the initial support at 9637 holds any further price weakness, attention may shift to identifying resistance levels that could cap any rebound or lead to further price strength if they give way on a closing basis. In this regard, traders may be watching a resistance band at 9970/10061, which is a combination of the 38.2% and 50% Fibonacci retracements of the March 18th to 23rd decline.
As the daily chart above shows, if closing breaks above 9970/10061 were seen, it could signal renewed attempts at price strength, opening the way for a move toward 10152, the 61.8% retracement. Sustained closes above 10152 could open potential for further gains toward 10452, which is the March 18th high.
The material provided here has not been prepared accordance with legal requirements designed to promote the independence of investment research and as such is considered to be a marketing communication. Whilst it is not subject to any prohibition on dealing ahead of the dissemination of investment research, we will not seek to take any advantage before providing it to our clients.
Pepperstone doesn’t represent that the material provided here is accurate, current or complete, and therefore shouldn’t be relied upon as such. The information, whether from a third party or not, isn’t to be considered as a recommendation; or an offer to buy or sell; or the solicitation of an offer to buy or sell any security, financial product or instrument; or to participate in any particular trading strategy. It does not take into account readers’ financial situation or investment objectives. We advise any readers of this content to seek their own advice. Without the approval of Pepperstone, reproduction or redistribution of this information isn’t permitted.
Short 
Long 
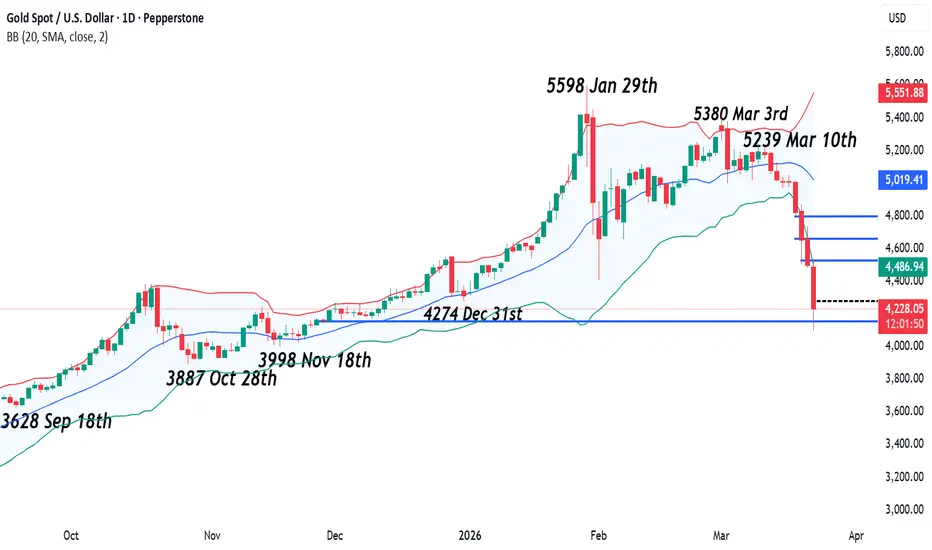
Gold – Facing a Potential Capitulation ChallengeThe current backdrop for precious metals is challenging to say the least. Last week, Gold prices experienced their biggest weekly fall since the early 1980s. A drop of over $500 or 10% from opening levels at 5010 on Monday (March 16th) to close at 2 month lows of 4497. This move has extended further this morning to register a 5 month low at 4102, wiping out the entire 2026 gains for the shiny metal in the process.
The latest catalyst for the drop could be attributed to weekend comments from US President Trump and Iran which may represent a hardening of their positions on the conflict, creating the possibility for a new escalation at the start of this new trading week. First, late on Saturday President Trump gave Iran a 48 hour deadline to reopen the Strait of Hormuz or have its power plants bombed, to which the ruling Iranian regime responded by saying if that were to happen, it would close the key Hormuz shipping lane entirely and target energy, IT and desalination infrastructure linked to the US and Israel (Bloomberg).
With the Iran conflict now entering its 4th week, with no clear end game in sight, this has led markets to raise their inflation outlook, which has cast doubt on the ability of the Federal Reserve to deliver an interest rate cut in the first half of 2026, possibly even across the year in its entirety. This type of backdrop can weigh on the price of Gold as it pays no dividend or interest, making it less desirable to hold in the face of other yielding opportunities in assets such as cash.
Looking forward, after such a deep fall to a new low, Gold traders may be looking at how events in the Middle East unfold across the week once President Trump’s 48 hour deadline passes. In this increasingly volatile environment, it can be useful to understand the technical trends and key support or resistance levels that may impact the direction of prices.
Technical Update: Increasing Volatility Sees Gold Testing Next Support:
While Gold saw a strong recovery from the February 2nd low to the March 3rd high, recent price action has turned sharply lower again. The near 24% decline into this morning’s current low of 4099 (8.00am GMT) raises the question for traders: Can the current phase of weakness carry further?
While it is impossible to say for certain, there is a key support area in focus today that may help determine Gold’s next directional moves.
Potential Support Focus:
As shown on the chart below, the 4157 level, which is equal to the 61.8% Fibonacci retracement of the August 2025 to January 2026 advance, is now under pressure. This is a level that traders may anticipate being a key support focus. However, price action this morning is currently threatening the possibility of closes below this level on a daily basis.
If downside pressure continues to build and Gold closes below 4157, it could suggest risks are for a deeper phase of weakness. Such a move might open declines toward 3998, the November 18th low, possibly even further toward 3887, the October 28th extreme.
Potential Resistance Focus:
If closing breaks below the 4157 support aren’t seen and Gold attempts to recover, attention may turn to potential resistance at 4317, equal to half Monday’s current range. A break above this level would not be an outright positive signal on its own, but it might indicate that upside pressure is beginning to rebuild once more.
If 4317 is cleared on a closing basis, higher resistance levels will potentially come back into play, with focus first on 4529, the 38% retracement and then 4664, equal to the higher 50% level.
The material provided here has not been prepared accordance with legal requirements designed to promote the independence of investment research and as such is considered to be a marketing communication. Whilst it is not subject to any prohibition on dealing ahead of the dissemination of investment research, we will not seek to take any advantage before providing it to our clients.
Pepperstone doesn’t represent that the material provided here is accurate, current or complete, and therefore shouldn’t be relied upon as such. The information, whether from a third party or not, isn’t to be considered as a recommendation; or an offer to buy or sell; or the solicitation of an offer to buy or sell any security, financial product or instrument; or to participate in any particular trading strategy. It does not take into account readers’ financial situation or investment objectives. We advise any readers of this content to seek their own advice. Without the approval of Pepperstone, reproduction or redistribution of this information isn’t permitted.
Don't Be Liquidity: Most Hedge Funds Aren't Trading Gold Today🛑 Stop Being the Exit Liquidity: Why Most Hedge Funds Aren't Trading Gold Today.
Take a close look at the chart above. My algorithm, the MarketMakersLab Quant Radar, is flashing a massive ⛔ BLOCKED TODAY.
Why? Because the "Liquidity Base" (the Asian Range) sits at a staggering ❌ 3.29x its average ATR.
While the average retail trader watches Gold drop 300 pips in panic, scrambling to short the bottom or blindly buy the dip out of FOMO... most portfolio managers at New York hedge funds are likely stepping aside or already off to play golf. 🏌️♂️⛳
Here is exactly why you often become exit liquidity if you click a button on days like this, and how our algorithm is built to protect you from the chop. 👇
⚙️ THE MECHANICAL CYCLE: How Size Typically Moves Price
The MarketMakersLab Institutional Order Flow Strategy is designed to track the mechanical cycle of how big money generally delivers price. When massive capital enters the market, it leaves footprints. Our strategy translates these marks into high-probability execution zones.
Major institutional players typically operate in a mechanical daily loop to ensure their massive orders are filled efficiently:
1️⃣ Phase 1 — Asian Session | Silent Accumulation: While retail sleeps, institutional desks tend to build positions within a tight range. These High/Low boundaries often establish the institutional cost-basis for the day.
2️⃣ Phase 2 — London Open | The Judas Swing: London is frequently used as a trap. Price violently sweeps beyond the Asian range to trigger breakout orders and stop losses. This rush of liquidity allows large participants to load final positions at a discount.
3️⃣ Phase 3 — NY Open | The Distribution: Once the trap is set and liquidity is collected, the real directional expansion usually begins. This is where the strategy looks to strike.
🚨 TODAY'S ANOMALY: The Statistical Void
Look at the data. Today, Asia didn't accumulate. It distributed massively.
The market burned through more than 3 times its daily volatility (ATR) before London even had its morning coffee.
When the Asian Range is this blown out:
❌ The "Judas Swing" is usually ineffective: There is no tight range to trap retail. The move has largely already happened.
⛽ The Statistical Fuel is heavily depleted: Hoping for a massive, clean New York expansion today is like expecting a car that just drove 500 miles overnight to win a drag race in the afternoon.
Many retail traders force trades because "the chart is moving." Professional quants typically trade only when the mathematical expectancy is heavily in their favor. Today, the R:R is statistically poor. It's a prime setup for erratic wicks, mean-reversion chop, and Monday gap digestion.
🛡️ THE QUANTITATIVE EDGE
We don't guess the breakout. We measure it. Our radar dynamically tracks order flow to keep you aligned with the dominant flow instead of fighting it.
🚪 The London Gate: We evaluate the "Judas Swing." If London confirms the trap, the gate opens. If a fakeout is detected, the strategy dynamically adjusts setup quality to prioritize capital preservation.
📈 Directional Displacement (ROC): We use a normalized Rate of Change to help ensure momentum is driven by genuine institutional flow, not just retail noise.
🌪️ The Storm Shield: Entries are automatically blocked if market volatility enters a designated "Chaos" regime (e.g., VIX Proxy spikes) or if the Asian base is invalid, just like today.
⏱️ Time-Specific Blocking: Built-in protection against historically erratic conditions like Monday pre-open gap digestions and late-week institutional profit-taking.
📊 GRADING THE SETUP
Not all signals are equal. The strategy grades every opportunity to define the highest probability path:
⭐ Grade A (Prime): High conviction alignment across inter-market data and micro-structure (Vol Delta & VWAP).
✅ Grade B (Standard): Valid footprints but subject to stricter timing and range restrictions.
🎯 Stop Being the Exit Liquidity. Start Tracking It.
Lower the noise. Increase your edge. The Institutional Order Flow Radar is now live on TradingView on my Profile! 🚀
👇 I’M DROPPING ALPHA FOR FREE.
I could keep this logic behind closed doors, but I’m putting it out there. If you want me to keep exposing how the sausage is made and posting these breakdowns, drop a 🚀 in the comments and smash the like button. It costs you $0.00, it feeds the algorithm, and it tells me to keep printing these. Deal?
⚠️ Disclaimer: The content of this post is strictly educational. It does not constitute financial advice. Trading involves massive risk. If you blindly force trades and blow your account, that's on you. Always do your own research and manage your risk. Short 
$IONQ: Sovereign Capital Meets a Technical BottomThe quantum computing race just got a historic injection of capital, and NYSE:IONQ is standing right at the center of it.
Fundamentally, the landscape shifted this week. The UK government just announced a massive £2 billion initiative to roll out quantum computers at scale by the early 2030s. More importantly for this ticker, IonQ has directly partnered with Cambridge University to establish a Quantum Innovation Centre, deploying their advanced 256-qubit system. This is no longer speculative tech; this is sovereign-level adoption and deployment.
Now, let's look at how the chart is reacting to this news.
The Technical Breakdown
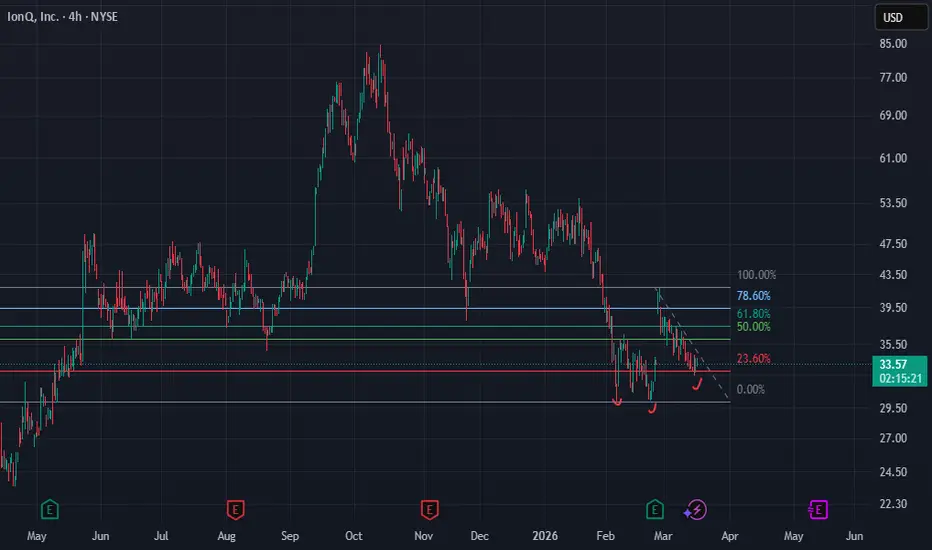
Looking at the 4-hour timeframe, the technicals are aligning perfectly with this macro fundamental shift. We've endured a brutal markdown phase from the previous highs, but the structure is finally changing.
The Accumulation Zone: Price has compressed into a deeply discounted descending structure, finding a rock-solid floor in the low $30s. This area has transitioned from a falling knife into a clear accumulation block where sellers are exhausted.
Fibonacci Confluence: We are currently testing the first major Fibonacci resistance band on the retracement from the recent swing high. Notice how the price is coiling tightly just below this level.
The Breakout Trigger: The sequence of lower highs is flattening out. We are right at the apex of the descending trendline. When you combine a multi-billion dollar fundamental catalyst with a deeply compressed technical structure, you get the recipe for a sharp trend reversal.
The Game Plan
Patience pays here. I am watching for a confirmed 4-hour candle close above the immediate descending trendline and the local Fibonacci resistance (the $33.50 zone).
If we can successfully flip that resistance into support, the "lower high" sequence is broken. The path of least resistance then shifts higher, targeting a fill of the massive structural imbalances left behind during the sell-off.
The fundamentals have provided the spark; now we wait for the technical confirmation to light the fire.
Are you tracking the quantum computing sector, or sticking to traditional tech? Let me know your thoughts on this setup below! 👇
Disclaimer: This post is generated for educational purposes and finance enthusiast content creation. It is not financial advice. Always manage your risk.  Long
Long