
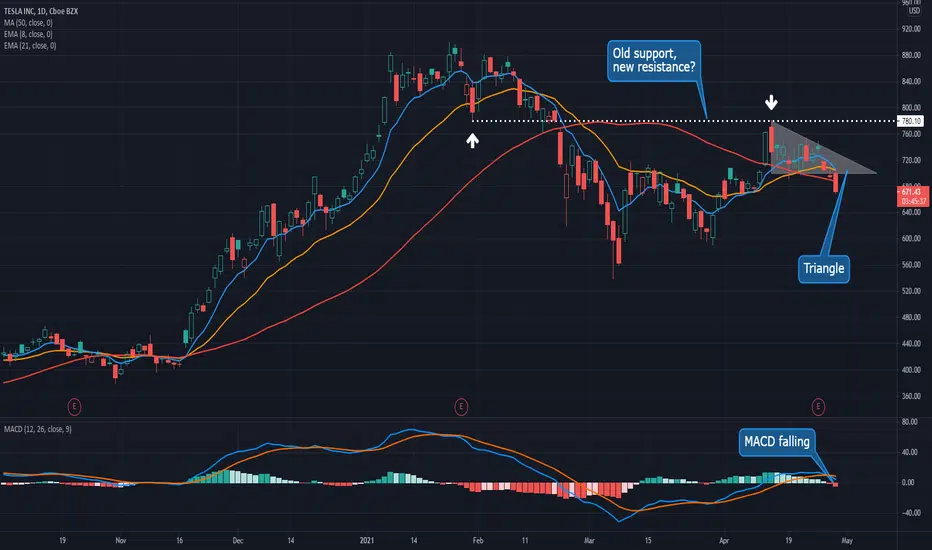
Tesla hasn’t hit a new 52-week high since January 25. It bounced feebly this month, and now the price action is looking more problematic.
First, notice how the April 14 high closely matched the January 29 low. Old support could be new resistance.
Second, TSLA has made lower highs since while holding roughly $700. That now resembles a bearish descending triangle, with a break to the downside.
Third, prices are back under $700 and the 50-day simple moving average (SMA). Additionally, the 8-day exponential moving average (EMA) could now fall back under the 21-day EMA.

Finally, there's risk of an ABC correction on the weekly chart. The March low could be “A” point and April’s high could turn into “B”. The result could be “C” somewhere near $500.
TradeStation is a pioneer in the trading industry, providing access to stocks, options, futures and cryptocurrencies. See our Overview for more.
First, notice how the April 14 high closely matched the January 29 low. Old support could be new resistance.
Second, TSLA has made lower highs since while holding roughly $700. That now resembles a bearish descending triangle, with a break to the downside.
Third, prices are back under $700 and the 50-day simple moving average (SMA). Additionally, the 8-day exponential moving average (EMA) could now fall back under the 21-day EMA.
Finally, there's risk of an ABC correction on the weekly chart. The March low could be “A” point and April’s high could turn into “B”. The result could be “C” somewhere near $500.
TradeStation is a pioneer in the trading industry, providing access to stocks, options, futures and cryptocurrencies. See our Overview for more.

관련 발행물
면책사항
해당 정보와 게시물은 금융, 투자, 트레이딩 또는 기타 유형의 조언이나 권장 사항으로 간주되지 않으며, 트레이딩뷰에서 제공하거나 보증하는 것이 아닙니다. 자세한 내용은 이용 약관을 참조하세요.
면책사항
해당 정보와 게시물은 금융, 투자, 트레이딩 또는 기타 유형의 조언이나 권장 사항으로 간주되지 않으며, 트레이딩뷰에서 제공하거나 보증하는 것이 아닙니다. 자세한 내용은 이용 약관을 참조하세요.