The key is whether it can rise above 237.60
Hello, fellow traders!
Follow us to get the latest information quickly.
Have a great day.
-------------------------------------
(SOLUSDT 1M Chart)
To understand the strangely drawn trendline, you need to refer to the StochRSI indicator.
This is because the StochRSI indicator was used to draw the trendline.
When the K indicator of the StochRSI forms a peak in the overbought zone, a trend line is drawn by connecting those peaks. When the K indicator forms a peak in the oversold zone, a tren
Breadth Indicators
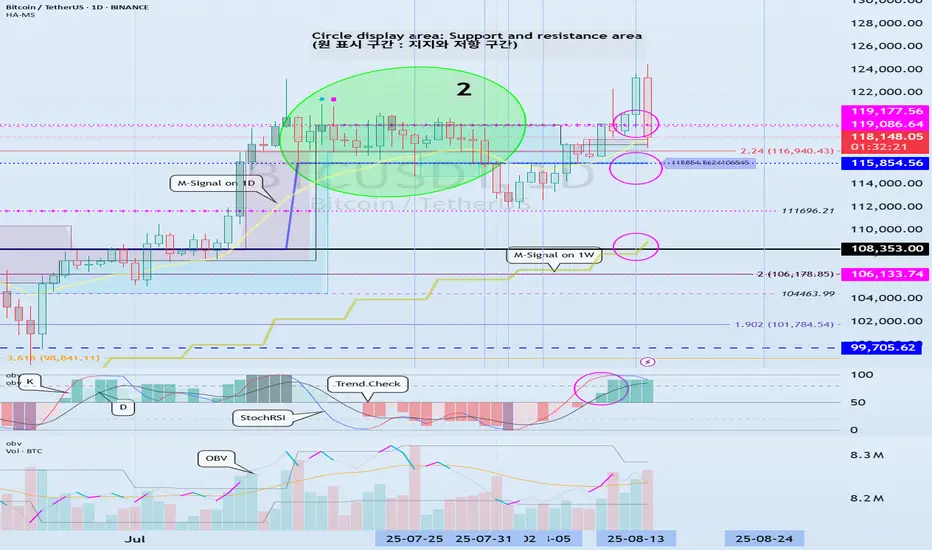
Important range: 115854.56-119177.56
Hello, traders!
Follow us for quick updates.
Have a great day!
-------------------------------------
(BTCUSDT 1D chart)
This period of volatility is expected to last from August 23rd to 25th.
It found support near 111696.21 and rose above 115854.56.
Therefore, the key question is whether it can find support near 115854.56 and rise above 119177.56.
If it falls below 115854.56, it could fall to around 108353.0.
If it rises above 119177.56 this time and holds, it could attempt to rise near
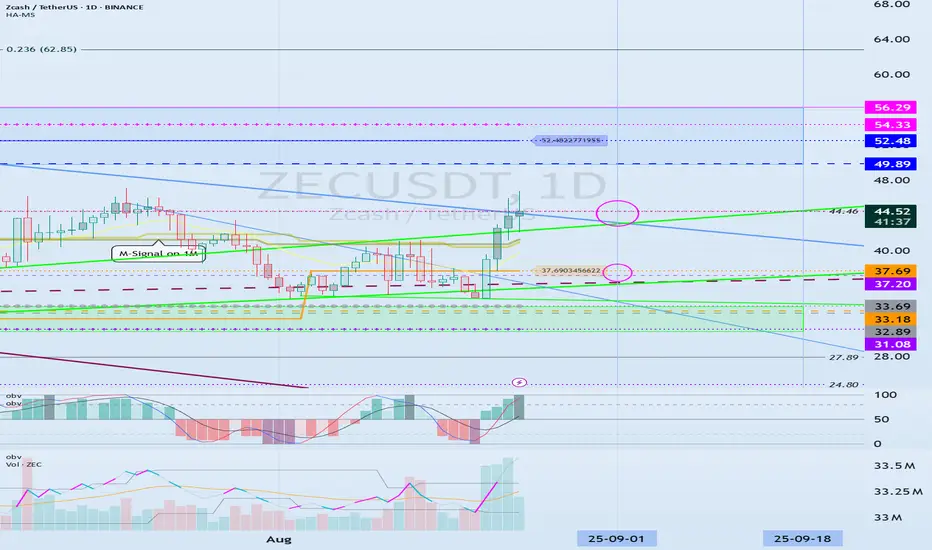
The key is whether it can find support near 44.46 and rise
Hello, fellow traders.
Follow us to get the latest information quickly.
Have a great day.
-------------------------------------
(ZECUSDT 1M chart)
It appears to have broken away from the long-term downtrend line (1).
However, to initiate an uptrend, the price must remain above the M-Signal indicator on the 1M chart.
The key is whether the price can rise above 56.29 and hold its value.
-
(1D chart)
The key is whether the price can find support around 44.46 and rise above 49.89-56.29.
To
Check for support near 4302.41-4372.72
Hello, traders!
Follow us to get the latest updates quickly.
Have a great day!
-------------------------------------
(BTC.D 1M chart)
For an altcoin bull market to begin, the price must either fall below 55.01 and hold or continue its downward trend.
(USDT.D 1M chart)
I believe that USDT dominance must remain below 4.91 or continue its downward trend for the coin market to continue its upward trend.
The maximum decline in 2025 is expected to be around 2.84-3.42.
After that, the coin mar
A rise above 3.725 could start a new bullish wave
Hello, fellow traders!
Follow me to get the latest information quickly.
Have a great day.
-------------------------------------
The original TON coin (token) failed, and this is the TON coin that was acquired and rebuilt.
Therefore, there are currently two TON coins, so it's recommended to verify them before trading.
This TON coin was acquired and rebuilt by Coinbase Ventures.
-
(TONUSDT 1D chart)
If the price holds above 3.725, there's a possibility of an upward trend as it breaks above
T
Important range: 10.626-12.130
Hello, traders!
Follow us to get the latest information quickly.
Have a great day!
-------------------------------------
Uniswap (UNI) is used on DEX exchanges.
This makes it connected to many ecosystems.
However, it's worth considering whether this coin (token) is worth holding in the medium to long term.
This is because if the DEX exchange fails to activate and fails, it could disappear completely.
Therefore, to trade this coin (token), I recommend holding it by gradually increasing th
Check if it finds support around 23.98-25.17 and rises
Hello, fellow traders!
Follow us to get the latest information quickly.
Have a great day.
-------------------------------------
Chainlink is one of the coins connected to many ecosystems.
Therefore, I believe it's worth holding for the medium to long term.
(LINKUSDT 1M chart)
The key is whether the price can find support around 23.98-25.17 and rise along the uptrend line.
If not, caution is advised as it may touch the lower uptrend line.
-
(1W chart)
If the price finds support around 2
See if it finds support near 0.21409 and can rise
Hello, fellow traders!
Follow me to get the latest information quickly.
Have a great day.
-------------------------------------
(DOGEUSDT 1M Chart)
I'm not sure if I should hold DOGE for the medium to long term.
However, if you plan to hold the coin for the medium to long term, I recommend increasing the number of coins (tokens) that represent profit.
The 0.21409-0.31600 range is an important high point boundary.
If this area supports the price and the price rises, a stepwise upward tren
See if the price can hold above 0.8289-0.8836
Hello, fellow traders!
Follow us to get the latest information quickly.
Have a great day.
-------------------------------------
(ADAUSDT 1D chart)
From a trend perspective, the key is whether the price can hold by breaking above the first and second trend lines.
If the upward movement fails, we should check for support around 0.8289-0.8836.
Therefore, we should check whether the price remains above 0.8289-0.8836 after August 31st, which is ADA's volatile period.
-
(1W chart)
To continue
The key is whether it can rise above 3.086
Hello, fellow traders.
Follow us to get the latest information quickly.
Have a great day.
-------------------------------------
(CAKEUSDT 1W chart)
For the uptrend to begin, the price must rise above 5.750 and hold.
-
(1D Chart)
The key is whether the price can maintain support around 2.465-2.740 and rise above 3.086.
If the price holds above 3.086, a stepwise upward trend is highly likely.
At this point, the key point to watch is whether it can rise above 4.217.
If it finds support ar
SOL Volatility Period: Around August 18
Hello, traders!
Follow us to get the latest information quickly.
Have a great day!
-------------------------------------
(SOLUSDT 1M Chart)
If the price stays above the M-Signal indicator on the 1M chart, the uptrend is expected to continue.
If it falls below 126.36, you should stop trading and observe the movement.
Since the HA-High indicator is forming at 179.74, the key question is whether it can find support near this level and rise.
The start of a stepwise uptrend is likely to begin
Check if the price can hold above 2.9092
Hello, traders.
If you "Follow" us, you'll always get the latest information quickly.
Have a great day.
-------------------------------------
(XRPUSDT 1D Chart)
If the price falls below the 1.5-1.9669 range, a major downtrend is likely to begin.
To maintain the uptrend, the price must hold above the 2.5102-2.6013 range.
If the price falls below the M-Signal on the 1D chart, it is highly likely to meet the M-Signal indicator on the 1W chart.
In that sense, we should check for support arou
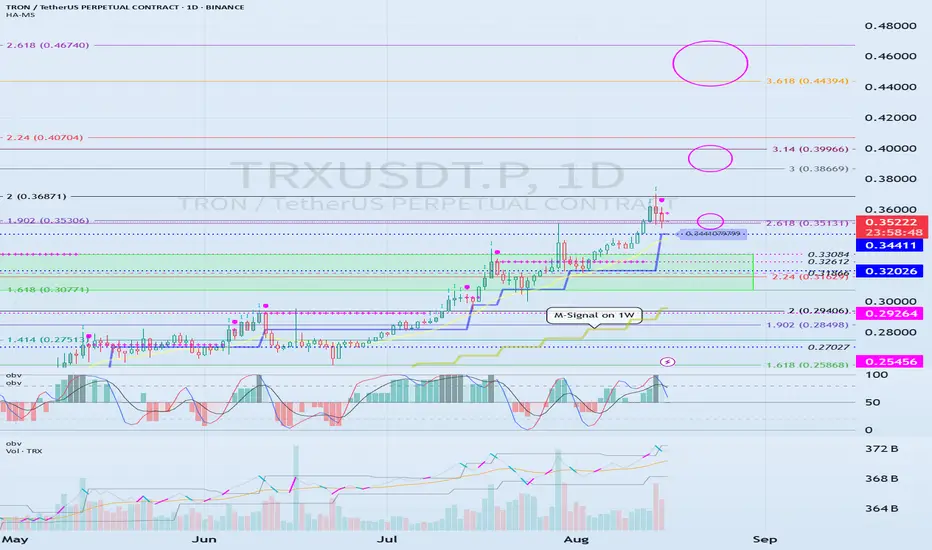
Important Area: 0.30771-0.33084
Hello, fellow traders!
Follow us to get the latest information quickly.
Have a great day!
-------------------------------------
(TRXUSDT 1D Chart)
TRX is one of those coins (tokens) that has a lot of users, yet feels neglected.
For TRX to maintain its uptrend, the price must remain above the 0.30771-0.33084 range.
The circled areas represent important support and resistance zones.
When the M-Signal indicator on the 1W chart rises near the 0.30771-0.33084 range, a price decline below that
Next Volatility Period: Around August 24th
Hello, traders!
Follow us to get the latest updates quickly.
Have a great day!
-------------------------------------
(BTCUSDT 1D Chart)
After this volatility period, the price has re-entered the 115854.56-119177.56 range.
Accordingly, the key question is whether the price can rise after finding support in the 115854.56-119177.56 range.
The next volatility period is around August 24th (August 23rd-25th).
----------------------------------------
To determine the volatility period, support
ETH's next volatility period: around August 28th
Hello, traders!
Follow us to get the latest information quickly.
Have a great day!
-------------------------------------
(ETHUSDT 1D chart)
This volatility period for ETH is expected to last until August 15th.
Therefore, caution is advised when trading.
The key question is whether the price can rise above the previous all-time high (ATH) of 4868.0.
Currently, the key support and resistance levels are 3900.73-4107.80.
Therefore, even if there is a further decline, if the price remains wi
The key is whether it can rise above 5.886.
Hello, fellow traders!
If you "Follow" me, you'll always get the latest information quickly.
Have a great day.
-------------------------------------
I don't necessarily recommend coins (tokens) that exhibit this behavior.
However, if you have spare funds or have or can generate significant profits from other coins (tokens), I think it's worth looking into these coins (tokens) when they're ready to trade.
The key is to maintain the price above the M-Signal indicator on the 1M chart.
------
ETH ETF Inflows Surge to $1B; BitMine Eyes $20B ETH AccumulationInvestor confidence in Ethereum is reaching new heights. Spot Ethereum ETFs have recorded a record-breaking inflow of over $1 billion in a single day, marking a significant milestone in institutional adoption of ETH. Among them, one major ETF stood out with an extraordinary $640 million in new capital, signaling renewed conviction in Ethereum’s growth trajectory.
This ETF momentum comes amid broader market sensitivity to macroeconomic developments. Recent U.S. inflation data suggests cooling pr
Support and Resistance Areas: 114454.57-115854.56
Hello, traders!
Follow us to get the latest information quickly.
Have a great day!
-------------------------------------
(BTCUSDT 1D Chart)
The K indicator on the StochRSI indicator appears to have entered the overbought zone, leading to a change in slope.
Therefore, the upward trend appears likely to be constrained.
-
We need to confirm whether the price falls within the range indicated by the index finger.
The key question is whether there is support around 114454.57-115854.56.
If it
Next Volatility Period: Around August 21
Hello, traders.
Please "Follow" to get the latest information quickly.
Have a nice day today.
-------------------------------------
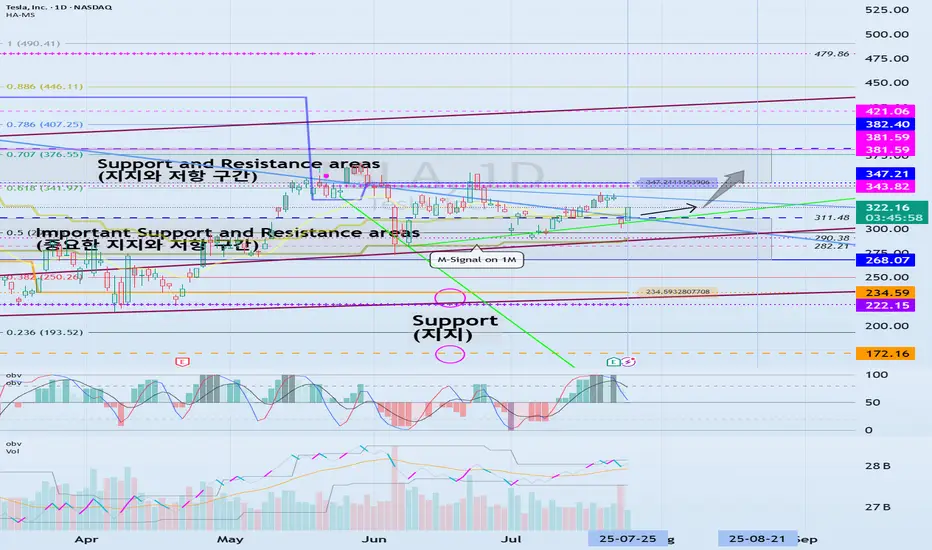
#TSLA
We need to see if it is rising along the rising channel.
The key is whether it can rise with support near 311.48 to break out of the downtrend line.
The key is whether it can rise along the short-term uptrend line and break through the short-term downtrend line after passing through this volatility period around July 25.
Therefore, we need to see whe
The key is whether the price can hold above 3900.73-4107.80
Hello, fellow traders!
Follow us to get the latest information quickly.
Have a great day.
-------------------------------------
(ETHUSDT 1D chart)
This period of volatility is expected to last from around August 6th to 14th (maximum from August 5th to 15th).
The key question is whether the price can find support and rise above the 3900.73-4107.80 range after this period of volatility.
The next period of volatility is expected to occur around August 28th, so we need to see if the price can
Examples of Conditions for Starting a Trade
Hello, fellow traders!
Follow us to get the latest information quickly.
Have a great day!
-------------------------------------
This time, I'm going to talk about when to start and when to close a trade.
Trading has no beginning or end.
In other words, you can start a trade at any time and close it at any time.
The only question is whether you can profit from the time you start the trade and when you close it.
Therefore, it's best to be clear about why you need to start trading.
In othe
August is a key turning point
Hello, fellow traders!
Follow us to get the latest information quickly.
Have a great day!
-------------------------------------
(ABNB 1M chart)
ABNB is at a key turning point.
The key question is whether it can find support near 126.34 and rise.
-
(1D chart)
The key is whether the price can rise after finding support in the 126.34-133.72 range.
If it falls below 133.72,
1st: 112.91-118.67
2nd: 97.35-106.30
We need to check for support near the 1st and 2nd levels above.
We'll have to w
The key is whether it can rise above 590.0
Hello, fellow traders.
Follow us to get the latest information quickly.
Have a great day.
-------------------------------------
(BCHUSDT 1M Chart)
If the price holds above 473.4, it is expected to attempt to rise above 678.7.
-
(1D chart)
The key is whether the price can find support in the 541.9-572.6 range and rise above 590.0.
If it falls below 541.9, we need to check for support near 473.4.
The upward trend is expected to continue only if it breaks above the intermediate-term trend