NASDAQ 100 (NDX) — Monthly Elliott Wave RoadmapScenario: Expanded Fifth Wave | First Scenario (Aggressive Idea)
This long‑term Elliott Wave roadmap tracks the Nasdaq‑100 from the structural origin in October 1985 (106.75). The market structure continues to evolve within a large impulsive cycle, currently projecting the development of an Expanded Fifth Wave.
The overall structure is framed by two primary channels:
• Base Channel — defining the historical structural advance
• Terminal Channel — outlining the potential trajectory of the fin
Economic Cycles
NOLEADGASOLINE (4H) | Updated Elliott Wave RoadmapThe updated roadmap shows Wave I completed and Wave II still unfolding as a complex correction before the next major bullish expansion.
Aggressive Scenario
In the aggressive view, Wave II may resolve as a Triple Zigzag (W-X-Y-X-Z).
This would allow the market to complete the correction sooner and begin a fast Wave III advance.
This path becomes more credible if price breaks the Corrective Channel and the Terminal Channel, signaling that the corrective phase is losing control.
Conservative Sc
BTC Long-Term Cycle – 3rd Bottom Forming Around 20K–30K?Bitcoin continues to respect its historical cycle structure.
🔵 Previous Bull Run: 1066 days
🔴 Correction: 365 days
🔵 Next Bull Run: 1065 days
🔴 Current Phase: Correction (ongoing)
If the cycle symmetry plays out again, we could be approaching a 3rd major bottom around 01-Oct-2026.
📍 Key Reversal Zone: 20K – 30K (Grey Zone)
This area aligns with long-term trendline support and historical accumulation zones.
If price delivers into this discount region during the 365-day correction window
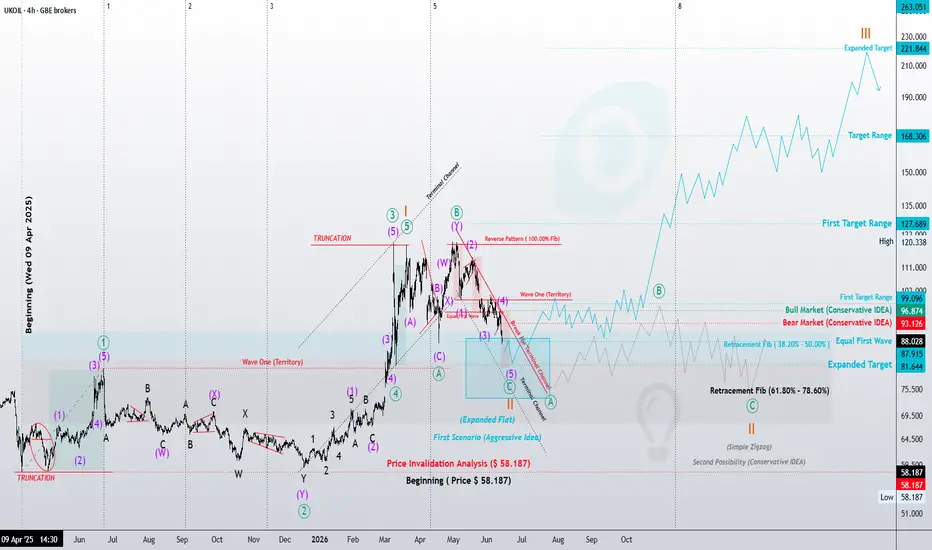
UKOIL (4H) – Structural UpdateThe current roadmap still favors a higher‑degree bullish expansion, but recent price behavior suggests that the market is developing an intermediate corrective phase before the next directional move.
Aggressive Scenario
Under this interpretation:
Price has already completed a five‑wave impulsive structure.
After reaching the previous high, the market reacted with a sharp decline.
This fast drop may indicate the beginning of a Flat correction.
At this stage the correction may evolve as either:
ETHUSD (4H) | Structural UpdateIn the updated ETHUSD roadmap, the structure has become more developed and mature compared to the previous version.
The May 30 chart primarily outlined a bearish structural roadmap.
This update shows that the market has already progressed deeper into the downside phase, while also presenting a clearer post-terminal recovery path.
At this stage, the focus is no longer just about expecting a decline.
It is about observing how the downside has unfolded, identifying where structural maturity may
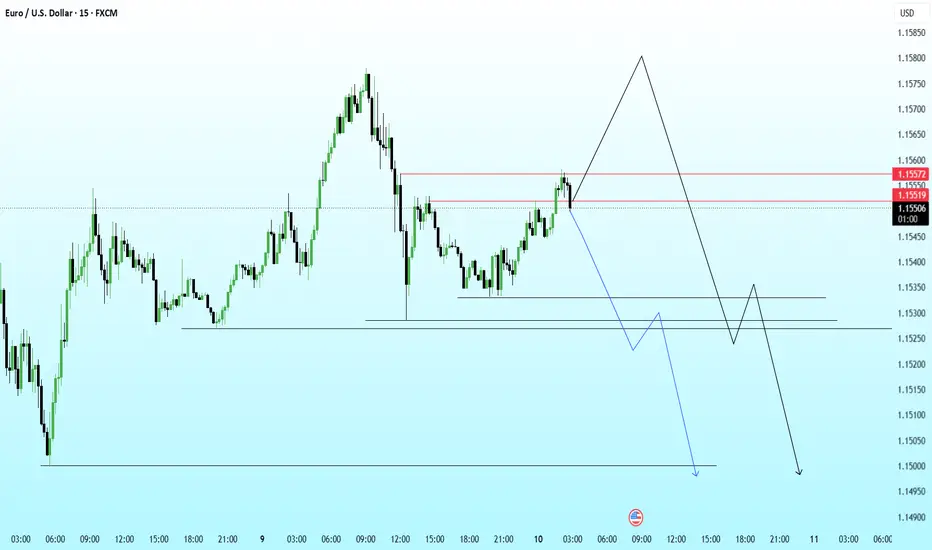
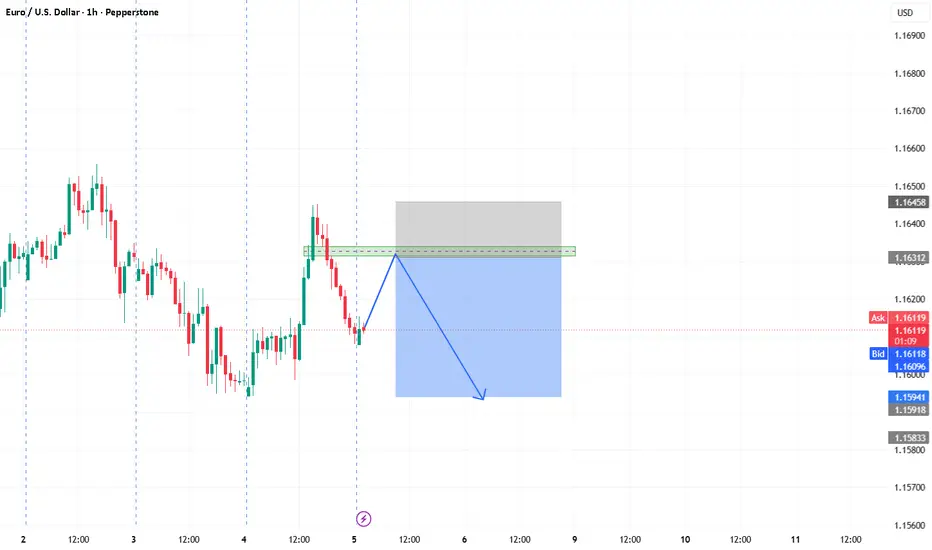
EURUSD Approaching Premium Pricing Before Sellside ExpansionPrice has rallied into a key premium zone after a strong displacement from the lows and is now approaching short-term buyside liquidity.
Current framework:
Price is trading inside a premium pricing region
Nearby highs and liquidity pools sit directly above current price
Multiple intraday support levels remain below current structure
Market has already shown strong bullish expansion into resistance
Sellside liquidity remains resting beneath the recent range
My expectation:
A sweep of the near
Inside the Algo Script Bleeding Retail Tech TradersThe Premarket 4% Pump: Inside the Algo Script Bleeding Retail Tech Traders
If you have been trading the AI hardware and semiconductor sector over the last few days, you have likely found yourself caught in a highly repetitive, brutal intraday cycle. The market opens with an explosive green surge, only to completely reverse and leave traders trapped in deep losses by the afternoon.
This isn't random market volatility. It is a highly calculated institutional distribution script designed to milk
Yield Curve Inversion IHS Breakout - Recession WarningMORE RECESSION INDICATORS FLASHING 🚨
The Yield Curve Inversion chart appears to have broken out of an Inverse Head & Shoulders pattern reclaiming the 50MA.
Note the constant higher lows and higher highs since this trend started making its way back to inversion in 2011.
probably nothing 👀
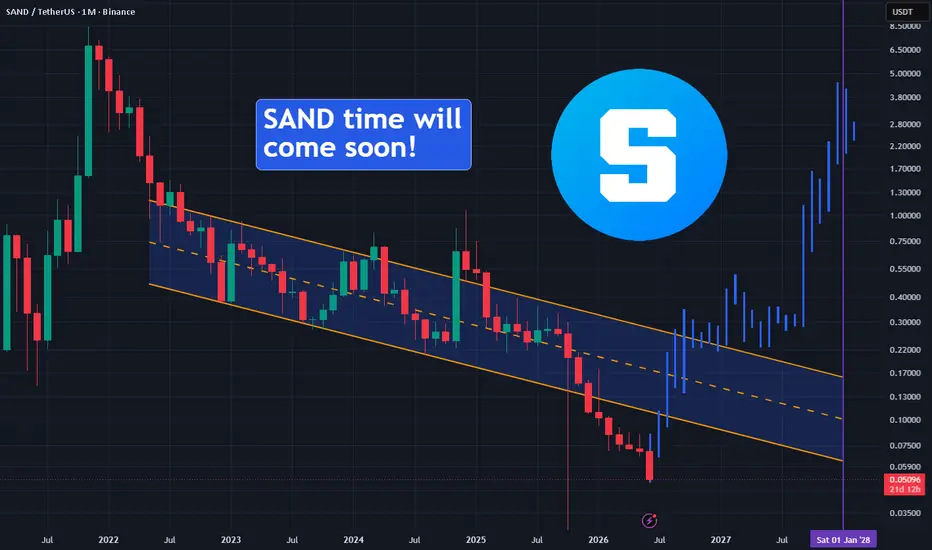
SAND Ultimate BottomIt's difficult to predict the ultimate bottom of an Altcoin, but it seems that SAND has finally reached it! With BTC'D having been in a downtrend since June 2025 and expected to drop to 38% or below before 2028, altcoins could shift to be bullish as explained here:
SAND, similar to related altcoins, has been in a long-term parallel channel that has been going on since early 2022 making all most investors either exchasted or liquidated. This channel is showing us the upper and lower bands, and
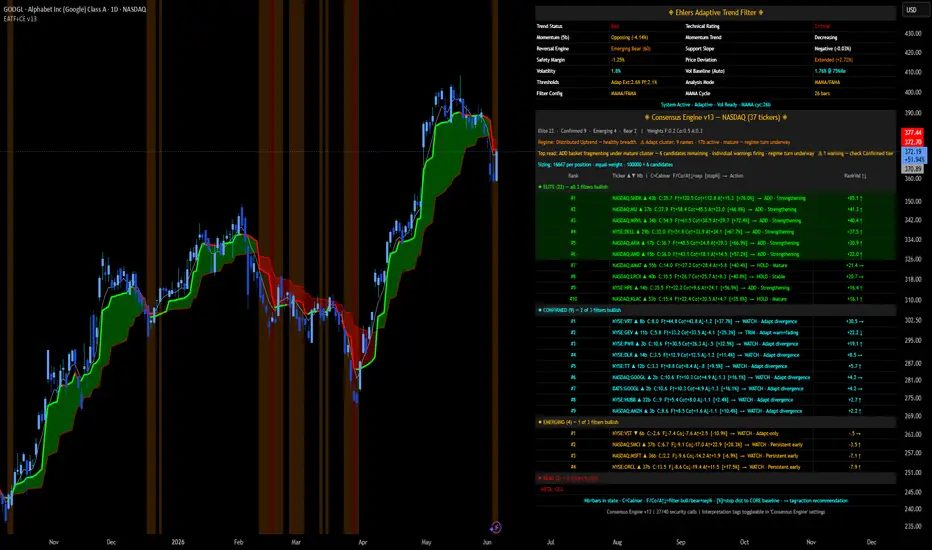
NVDA — NASDAQ, 4HEATF+CE v13 — NVDA at the centre of a regime turn the 4H is already confirming
NVDA — NASDAQ, 4H
NVDA itself is the most useful illustration of why this matters. On the daily NASDAQ AI infrastructure basket, NVDA still sits in the Elite tier under broader regime classification of "Broad Uptrend (turning down)". On the 4H verification timeframe — the screen above — NVDA has already dropped to the Confirmed tier with a TRIM·Adapt warn+fading label. The Adapt filter has flipped bearish at the 4H r
Everyone is waiting for the dip… May 2026What if it never came?
A few days ago the idea of an approaching resistance “ Expect resistance 86-87k - May 2026 ” was published. It is clear from various quarters this is interpreted as a forecast “crash” event prediction as and when resistance is tested. An event that’ll cover long orders to those that panic sold around $65k now looking to capture a missed opportunity.
Here's the thing, resistances can be broken. Resistances, just like support, can fool the market. The trade or opportunity
The AI Infrastructure Trade — A Probability Read on Where We AreThe AI Infrastructure Trade — A Probability Read on Where We Are
If you're holding from the broader AI infrastructure basket — NVDA, AVGO, AMD, ARM, MU, MRVL, TSM, LRCX, AMAT, KLAC, ASML, ANET, SMCI, DELL, HPE, VRT, ETN, PWR, HUBB, JCI, TT, GEV, CEG, VST, EQIX, DLR, GOOGL, AMZN, META, MSFT, plus SMH/QQQ/SPY benchmarks — here's what a multi-filter structural read says about the probability distribution of where the basket is likely going over the next 1-12 weeks. Not a recommendation, not a predi
Bitcoin test long-term Mega Channel support.In summary, the current overall picture of Bitcoin is flashing its most dangerous signal in four years.
The breakdown below the long-term Mega Channel support, combined with a price pattern fractal mimicking the 2022 crash, strongly indicates that the macro bull market has come to an end, marking the inception of a massive new bear market.
The downward price targets are locked in at the $41,000 zone, with the ultimate bottom potentially plunging as deep as $33,500.
Therefore, the optimal s
BTCUSDT - Accumulation Strategy: Preparing for the Next CycleGoal - make a proper preparation for next BTC cycle, that happens after each 4 years.
TL;DR
Patience is key. The plan is to wait for Bitcoin to drop into the highlighted green demand zone and slowly begin a weekly Dollar Cost Averaging (DCA) routine. Historically, BTC tends to base in these lower ranges for several months. The ultimate premium entry sits around the $32,000 level.
Market Structure & Macro View
Bitcoin operates on well-defined, 4-year macro cycles. While the overarching market
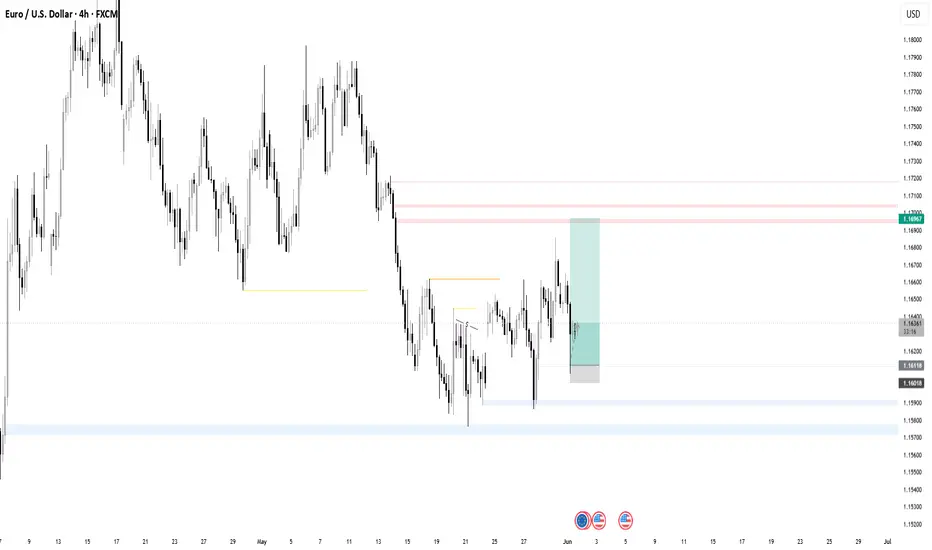
EURUSD Continuation Buy PendingThe entry I have was taken during the recent NY session. Anticipating that price will continue to go upward towwards the 'POIs' at the higher levels. The current price action from a bit higher timeframe can be seen as a accumulation and volume is favoring as well since the spring is there and other phases too. At this point just waiting for a re-entry during one of the sessions coming up.
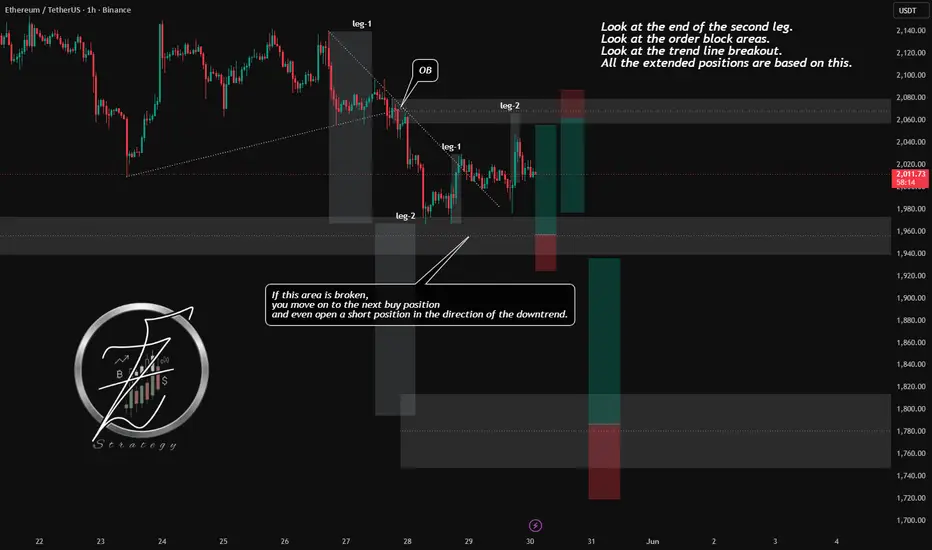
ETH position | 30 may 2026ETHUSDT position | 1h Chart
Follow price BINANCE:ETHUSDT
❇️ Analysis Description: Look at the end of the second leg, order block areas, and the trend line breakout. All extended positions are based on this. If the support area is broken, we move on to the next buy position or even open a short position in the direction of the downtrend.
🔼 Buy-sell Setup: Enter after the trendline break and pullback to the 1,980 - 2,013 area.
🕯 Entry Plan (1-Hour Confirmation):
H1 candle must confir
Gold Bearish move and Reversal Gold is now in bearish move after sweeping high liquidity pool now on recent swing low could be bullish trap and then sweeping the liquidity high probability zone is Nested fvg as levels are marked. these level with Sequential SMT divergence between xauusd and xagusd could be bullish strong move otherwise it will be considered as bearish.
Why Crypto Liquidity Thins Out in Summer
Summer gets treated like market folklore. Traders go away, liquidity dries up, volatility acts strange, and someone eventually says "Sell in May and go away" as if that explains the whole thing.
It doesn't.
The calendar is not the trade. The liquidity behind the calendar is what matters.
Still, the old phrase is useful because it points to a real market habit. "Sell in May and go away" comes from the traditional finance idea that traders reduce exposure before the quieter summer months and