The Anatomy of a Trap: Why Structure Alone Isn’t EnoughMarkets often look their most convincing right before they become the most deceptive. Clean chart patterns, widely recognized levels, and textbook formations can create a powerful sense of certainty — especially when many traders are seeing the same thing at the same time. Yet, certainty in markets is often where risk quietly concentrates.
The current structure on E-mini Dow Jones futures offers a textbook example of this dynamic. A rising wedge on the daily timeframe, a retracement toward a pr
Rising Wedge
Play on Levels!PAEL Analysis
Closed at 57.21 (28-01-2026)
Rising Wedge!
Shooting Star on Bigger tf appearing.
Monthly Closing Matters!
One positive point is a Morning Star formation on Monthly basis.
Immediate Support lies around 54.50 - 55.50.
a bounce is expected from this support.
Upside Resistance 64 - 65 can be touched again with mid way
resistance around 59 - 60.
Rising Wedge Pattern S&P 500There is clear a Rising Wedge Pattern formed on S&P 500 4h chart .
There was even a retracement from all-time highs of 6979 back inside the wedge before the weekend.
My suggested SL is 7030-7050 and TP 6500-6550 for the short-to-mid term.
On a larger scale, there is also a huge channel that we are testing the top of right now:
Going all the way back to 2008..
It could easily end up like this:
So for longer term I can see 6100, 5500, 5000 and if recession hits than even 3500
GBPCAD Triple Top Points To Potential Triple EventOANDA:GBPCAD on a multi-timeframe analysis allows us to breakdown this False Breakout of the Rising Wedge on the Weekly chart, lets check it out!
Price on the Weekly had made a Bearish Breakout of the Rising Wedge but price has had a great Bullish rally all week and undid all the Price Action following the Breakout of the Rising Support.
On the Daily since the Low of the Breakout @ 1.83238, OANDA:GBPCAD has begun to form an Expanding Range with Higher Highs laying out a Rising Resistance.
-
Why This 2022 Bitcoin Fractal Might Fail The 2022 bear‑market fractal 📉
The fractal taken from the 2022 bear market. Back then Bitcoin built a rising wedge pattern and then dropped about 60% in value from the breakdown.
What “everyone” expects now 😱
Many traders now expect Bitcoin to repeat that same pattern crash.
Social media, bears and even cautious bulls keep pointing to the old wedge and saying “this dump is next.”
Why this time can be different 💡
Markets rarely give the majority the easy trade; when everyone leans to one
Price-Action Analysis (Gold – Daily Chart)Price-Action Analysis (Gold – Daily Chart)
1. Rising Wedge Structure
The chart highlights a rising wedge, where price is moving higher but the slope of the highs and lows is converging.
This shows that although price is advancing, the momentum is slowing because each new high is made with decreasing strength.
The wedge boundaries show price repeatedly touching both the upper and lower trendlines.
2. Recent Price Behavior
Price moved from the lower wedge boundary upward and recently touched
Rising Wedge Breakout Spells Decline Continuation For GUFX:GBPUSD delivered a Breakout of A Rising Wedge to end the week last week!
Next, we should suspect a Retest of this Breakout @ the 38.2% Retracement level around 1.31864.
This level proved to hold price below it through the formation of the pattern and would serve as a great area of opportunity to short the pair and ride Price down!
If the Retest of the Breakout is successful, Price would next find Support at the April Lows around the 1.28 - 1.27 area!
Fundamentally its a heavy week for U
Bitcoin Bear Market 2026 | Macro Cycle & Rising Wedge BreakdownBitcoin Macro Cycle Analysis (2013–2029) | Rising Wedge Breakdown • 2026 Bear Market Targets • Historical % Drops & Next Accumulation Zone
Bitcoin historical data strongly follows multi-year macro cycles , where each bull market has been followed by a deep bear market correction:
📉 2nd Cycle (2017–2018)
Top: 19,666 (17 Dec 2017)
Bottom: 3,122 (15 Dec 2018)
Correction: –84.23%
📉 3rd Cycle (2021–2022)
Top: 68,997 (8 Nov 2021)
Bottom: 15,479 (9 Nov 2022)
RK Forgings Showing a Clean Reversal Setup — Trend Change Ahead?This is the daily timeframe chart of Ramkrishna Forgings.
The stock is forming a well-defined pattern at a strong support zone near 490–510.
The pattern resistance is placed near 570, and a breakout above this level may open the path for a potential upside target toward the 710+.
If the support zone near 490–510 continues to sustain, we may witness higher prices in Ramkrishna Forgings.
THANK YOU !!
CDSL !! Time to Be Cautious! Bearish Signals Getting StrongerThis is the Daily Timeframe Chart Analysis of CDSL
CDSL is currently forming a Rising Wedge pattern near the key resistance zone of 1680–1700. A breakout above this level with strong volume could lead to an upside target around 1800.
However, if the stock fails to break this resistance and the zone holds, we may witness a downside move. In that case, CDSL could retrace towards the range-bound support area of 1500–1520.
Thank you.
TSLA 3-Drive & ABCD Pattern – Path to $500 Before a PullbackThis chart highlights multiple harmonic and Elliott structures aligning for a potential bullish extension in Tesla (TSLA). A well-defined ABCD pattern and 3-Drive pattern suggest momentum building toward the $500 zone, supported by Fibonacci projections and channel resistance.
The current wave structure points to an imminent 5-wave advance, likely completing the “Drive 3” and pattern D confluence area near $500–505. Following that move, a corrective pullback (ABC) is anticipated, possibly retes
S&P500 | Mild CrashRisk assets looking to sell off as the stock market tops out around $6,800.
Current price action is only pulling back to test sellers again and we should see a continuation in selling until mid November and hopefully to see a Christmas rally to end the year off.
Since price action awfully looks similar to '24 - '25 Fractal we could say the SPX will look to top next year February/March also considering we're on correction 4 in the Elliott Wave Theory.
Would like to see the S&P bottom out aroun
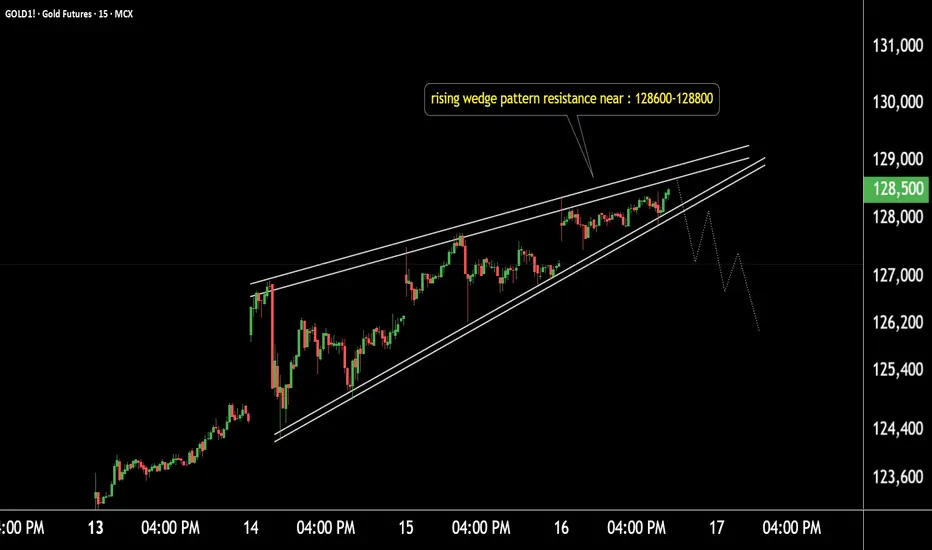
Gold at Risk of Pullback as Rising Wedge Pattern Emerges!Gold Technical Update (15-Min Timeframe)
Gold is forming a Rising Wedge pattern.
Resistance zone: 128600 – 128800.
If the resistance zone holds, selling pressure may increase.
The pattern indicates a potential downside move if price breaks below the lower trendline.
Traders should watch for a breakdown confirmation before taking any fresh positions.
S&P 500: Rising Wedge signals movement before NFP📈 BLUEBERRY:SP500 | Rising Wedge + Non-Farm Payrolls: Which breakout scenario is more likely?
A Rising Wedge pattern is forming on the 30-minute chart of US SPX 500, with price approaching the convergence point of two trendlines. This pattern typically signals weakening bullish momentum but doesn’t rule out a breakout to the upside 🚀.
🔍 Technical Analysis:
• Price is consolidating within a narrowing channel, forming a Rising Wedge 🔺.
• Key support lies between 6717 - 6734 (lower blue zone
What’s a Wedge Pattern?What's up traders! 👋
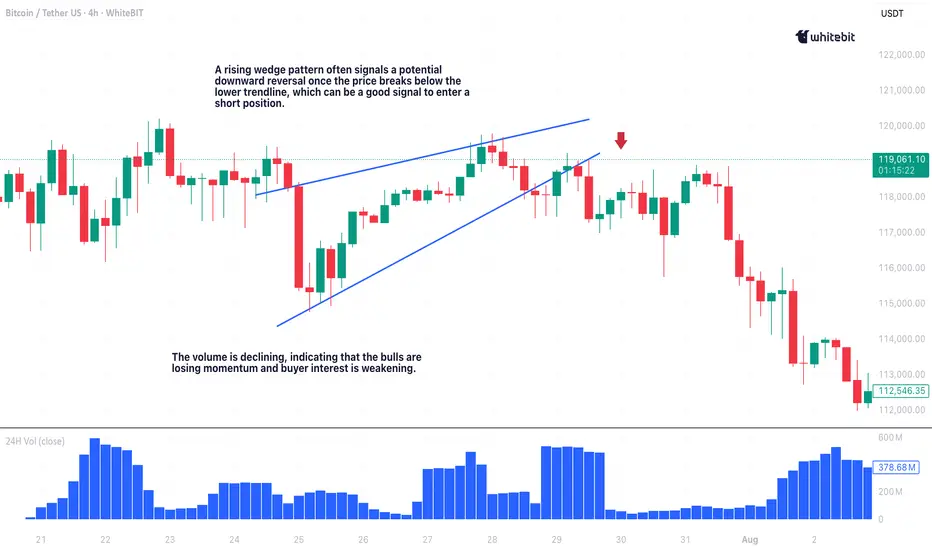
Wedge patterns are a powerful tool in technical analysis that can give you a heads-up about potential price moves. Whether you’re spotting a falling wedge or a rising wedge, these formations can reveal key signals about market direction.
What’s a Wedge Pattern?
A wedge pattern forms when price moves between two converging trendlines, creating a shape resembling a triangle. These patterns usually appear when the market is slowing down or consolidating before making a b
GOLD's Situation, A Comprehensive Analysis ! (XAUUSD)In my opinion, the price will rise to around $4000 and then enter a corrective wave. Currently, the price is forming the third upward wave, which I have estimated using technical analysis. These upward waves will continue up to around $4000, and after this rise, the price could decline toward the PRZ (Potential Reversal Zone). However, this price correction depends on the breakout of the wedge pattern.
SOLANA → When will the sale end? Bullish trend...BINANCE:SOLUSDT.P is testing the key support zone of 210-215 amid a market decline. However, it is too early to say that the correction is over; additional signs are needed...
Bitcoin is not slowing down yet, a small correction is forming, and there is a chance for the market to fall to 110K. This could also trigger a decline in altcoins before further growth. SOL has been hit by a general sell-off across the entire market. Technically, the chart shows a sell-off and a halt to the decline
GOLD → The uncertainty factor before the news. Down / up?FX:XAUUSD after updating another high to 3578 went into the phase of profit taking before two busy news days. The trend is aggressively bullish, but the risks of correction are quite high due to the uncertainty factor....
The price pulled back from record highs amid profit taking and reduced panic in the bond market. The dollar stabilized, but remains under pressure due to expectations of Fed rate cuts this year. The key event will be the publication of US employment data (NFP) on Friday.
A
Bitcoin at Make-or-Break: Will BTC Fill the CME Gap?Bitcoin ( BINANCE:BTCUSDT ) increased to $113,500 as I expected in my previous idea .
Do you think Bitcoin can fill the upper CME Gap($117,235-$113,800) !?
Bitcoin is currently moving near the Resistance zone($114,720-$113,580) , Cumulative Short Liquidation Leverage($115,000-$113,588) , Resistance lines , and Monthly Pivot Point .
In terms of Elliott Wave theory , Bitcoin’s movement over the past 2 days has been in the form of corrective waves and has had low momentum .
Gold at Resistance ! Next move will decide trend.Daily Chart Update – Gold1!
Gold is currently forming a rising wedge pattern, with resistance near the sell zone of 103550–103700. The metal is also trading within a well-defined ascending parallel channel, where the channel resistance aligns with the first selling level around 10500.
On a percentage basis, after a 5–6% upward move, gold has reached the key levels of 104700–10500. If these resistance levels hold, we may witness a potential decline in prices. Accordingly, positions can be shift
GOLD → Retest 3400. Readiness for a breakthroughFX:XAUUSD is "consolidating" creeping up on resistance, which generally increases the chances of a breakout, but the initial resistance test may end in a pullback. However, there is news ahead that could trigger one of two scenarios...
At the moment, gold is testing $3,400, but is ready for a correction pending new data from the US. However, further decline may be limited for the following reasons: Weak dollar: The probability of a Fed rate cut in September is estimated at 90%. Trump-Fed c