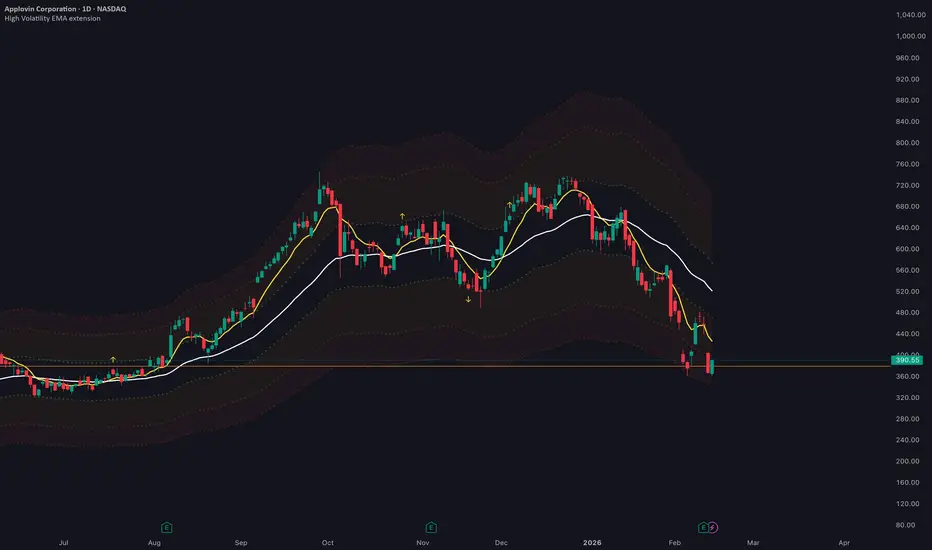
지표
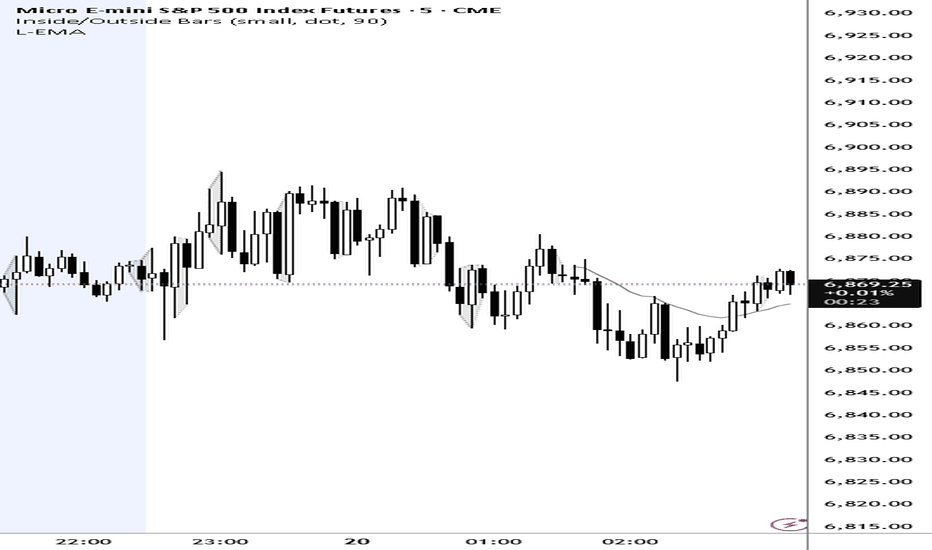
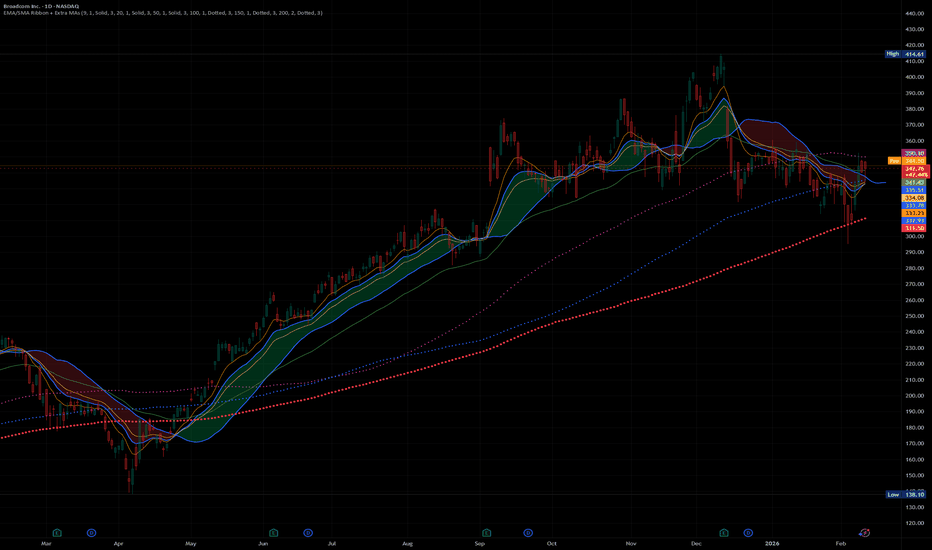
Custom EMA SMA Ribbon
Indicator name and purpose
Custom EMA SMA Ribbon is a six-layer moving average ribbon built to show trend alignment, momentum structure, and signal readiness in a single glance. Rather than relying on one crossover, it renders a stacked relationship between fast, medium, and slow averages so the trend context is visible without extra indicators. The purpose is to make trend direction, trend stability, and momentum alignment readable at a glance, while also providing filtered entry signals and a visual status matrix that summarizes the current bias against each moving average.
Long set up
Short set up
Mixed scenario
What it does
Each moving average layer is colored based on whether it is above or below the next slower layer. When the ribbon is stacked with fast lines above slow lines, the structure is bullish. When fast lines fall below the slower lines, the structure is bearish. This layered coloring reveals whether the trend is cleanly aligned or mixed. The script also highlights full alignment, where all fast layers sit above or below the slowest line, which is usually the most stable trend condition. In addition to the visual ribbon, it generates trend-filtered signals: a bullish signal appears only when the slow ribbon is aligned bullish and MA1 crosses above MA2, while a bearish signal appears only when the slow ribbon is aligned bearish and MA1 crosses below MA2. A signal status matrix in the chart corner shows whether price is above or below each moving average, giving a compact snapshot of current bias without scanning every line.
How it works in detail
The indicator calculates six moving averages from a single price source. You can use EMA for a more responsive ribbon or SMA for a smoother ribbon that reduces noise. Each line’s color is determined by its position relative to the next slower line, building a visible map of internal trend health. The slowest line acts as the anchor. If all faster lines remain above it, the ribbon is fully bullish. If all faster lines remain below it, the ribbon is fully bearish. The trend-filtered signals add a momentum layer: they require a clean macro stack first, then confirm entry with the fast crossover of MA1 and MA2. Signals are plotted as tiny circles, so they do not clutter the chart. Bullish signals plot at the bottom in green, bearish signals plot at the top in red. Optional background shading emphasizes the full alignment zones, and all signal states can be confirmed on bar close with the non-repainting toggle. The signal status matrix is updated on the last bar and labels each MA as LONG or SHORT depending on whether the current close is above or below that line, allowing quick context checks during live monitoring.
Default settings
The default lengths 10, 20, 50, 100, 150, and 200 create a balanced mix of short-term, mid-term, and long-term context. The 10 and 20 lengths capture fast swings and early shifts. The 50 and 100 lengths reflect the core trend structure. The 150 and 200 lengths anchor the ribbon to the broader market bias. This combination makes it easy to see if short-term momentum is moving with the larger trend or if it is fighting it. EMA is selected by default to keep the ribbon responsive enough for intraday and swing traders, but you can switch to SMA for smoother, slower trend mapping. With the default configuration, the signal logic is naturally conservative because the faster cross must occur only after MA3, MA4, MA5, and MA6 are stacked in the same direction, filtering many counter-trend crosses. The matrix defaults to the bottom right so it stays visible without covering price action, but you can move it to any corner or center position.
How to use it on charts
Use the ribbon as a trend filter first. When most lines are green and stacked in order, the trend is bullish and pullbacks can be treated as potential continuation zones. When most lines are red and stacked downward, rallies can be treated as corrective unless the stack flips. The strongest trend environments occur when the ribbon is fully aligned above or below the slowest line. If the ribbon becomes mixed with alternating colors, that signals transition or consolidation and signals should be treated more cautiously. In those mixed states, ignore the MA1/MA2 crosses because the macro alignment filter will not allow signals, which is intentional to reduce noise. The matrix helps confirm whether price is holding above multiple layers during a bullish trend or below multiple layers during a bearish trend, which can support trade management decisions like scaling in or tightening stops.
Signal logic explained
Bullish signal requirements: MA3 above MA4, MA4 above MA5, and MA5 above MA6 must all be true, confirming a clean bullish macro stack. Once that macro alignment exists, a bullish signal is generated when MA1 crosses above MA2. This is the earliest momentum entry that still respects the larger trend. Bearish signal requirements: MA3 below MA4, MA4 below MA5, and MA5 below MA6 must all be true. Once that macro alignment exists, a bearish signal is generated when MA1 crosses below MA2. This ensures the momentum entry is taken only in the direction of the larger ribbon stack. Signals appear as tiny circles to keep the chart clean: white at the bottom for bullish signals, black at the top for bearish signals. The matrix adds a second layer of confirmation by showing whether the close remains above each MA during a bullish signal or below each MA during a bearish signal.
Practical usage examples
Trend continuation example: price rises, the ribbon is fully bullish, and fast lines stay above the slowest line during pullbacks. When MA1 crosses back above MA2 after a shallow pullback, the green circle appears at the bottom, indicating a momentum continuation aligned with the macro structure. If the matrix also shows LONG across most rows, it confirms that price remains above the key layers. Trend reversal example: the ribbon compresses, fast lines cross down, and the full alignment flips bearish after several mixed states. Once MA3 to MA6 are stacked bearish, the red top circle appears when MA1 crosses below MA2, signaling the first momentum entry in the new trend direction. If the matrix shifts to SHORT across multiple rows, it confirms the shift in control.
All Long signals on matrix
Mixed signals on matrix
How the components work together
The layered coloring shows immediate, mid, and macro alignment in one view. The full alignment state acts as a high confidence filter for trend bias. Optional background shading gives a quick visual signal of those high confidence zones. The trend-filtered MA1/MA2 cross signals provide a concise momentum trigger that only fires when the broader ribbon is aligned. The signal status matrix summarizes price position versus each MA, helping traders quickly gauge whether momentum entries are supported by broader structure. Together these components provide a complete trend map, entry framework, and state dashboard without overloading the chart.
What makes this script original
This ribbon is not a simple fast slow crossover. Each layer is colored relative to its adjacent layer, which exposes the internal order of the ribbon and the health of the trend rather than only the outer edges. The macro alignment filter combined with a fast crossover creates a structured momentum signal that is stricter than most ribbons, helping avoid counter trend entries. The added status matrix provides a compact decision aid that shows whether price is above or below each layer in real time, which most ribbons do not include. The non-repainting toggle ensures the behavior is consistent between historical and live data. The indicator focuses on structural clarity and disciplined signals rather than generic crossover spam.
Markets, timeframes, and trading styles
This indicator is suitable for any liquid market including Forex, Crypto, Stocks, Commodities, and Indices. For scalping on 1m to 5m charts, keep lengths shorter or use EMA to maintain responsiveness, and focus on quick momentum continuation after macro alignment while using the matrix to confirm price remains above the faster layers. For day trading on 5m to 1H charts, the default lengths provide a balanced view of trend and pullback structure. For swing trading on 1H to daily charts, the default lengths remain effective and reduce noise. For position trading or investing on weekly charts, consider increasing all lengths proportionally to match the longer holding horizon and only take signals that align with the macro stack and matrix bias.
Settings guidance
Shorter lengths create faster signals but more noise; longer lengths create smoother signals but more lag. EMA reacts faster and suits active styles, while SMA smooths the ribbon for broader trend interpretation. Line styles and thickness controls let you emphasize the layers you care about most. Background shading is best kept subtle to preserve chart readability and should be used primarily to highlight full alignment states. Signal markers can be toggled off if you want a purely visual ribbon without entries. The matrix position can be moved to any corner or center area of the chart to avoid overlapping price action or other annotations.
Alerts
The script includes alerts for full bullish alignment, full bearish alignment, fast crosses between MA1 and MA2, and the trend-filtered bullish and bearish cross signals. All alerts respect the non-repainting toggle, so they fire on confirmed bars only when that option is enabled. Messages include symbol, timeframe, and price placeholders for automation or logging.
Non-repainting behavior
When non-repainting mode is enabled, all signal conditions and background states are confirmed on closed bars. This avoids signals appearing and disappearing mid bar and ensures live behavior mirrors historical behavior. Disabling the toggle makes the ribbon update in real time but signals should be treated as provisional until the bar closes.
Disclaimer
This indicator is a technical analysis tool and does not constitute financial advice. Always test settings on your chosen market and timeframe, use risk management, and confirm signals with additional context. No indicator is perfect; use this ribbon as one component of a broader trading plan.
지표

Eight Moving Average Cross with Macro DivergencesCredits and acknowledgment
The percentage-based moving average difference concept that powers the core oscillator in this script was inspired by the open-source "MA difference" indicator created by @cereallarceny
I am grateful for that foundation and have expanded it into an eight-layer system with cascade alignment logic, macro divergence detection, additional filters, a non-repainting framework, and a publication-ready alert suite. This credit appears first to clarify lineage, and the rest of the description focuses on the specific additions and behavioral logic in this version.
Indicator name and purpose
Eight Moving Average Cross with Macro Divergences is a multi-layer trend alignment and macro reversal map. It converts eight moving averages into a percentage-difference oscillator so you can read how far each layer of the trend structure is positioned relative to a base reference. The script then adds two complementary decision layers: a Cascade signal to detect synchronized momentum shifts across the trend stack, and a Macro Divergence map that highlights early warning signs of trend exhaustion or trend continuation.
What it does
You receive a clean oscillator pane that shows when short-term momentum aligns with the long-term structure, and when the price action is losing strength at meaningful pivots. The Cascade layer provides a filtered trigger for momentum shifts, while the divergence layer provides a higher-timeframe context for reversals or continuation. The result is an indicator that can be used as a standalone oscillator for structure analysis, or as a confirmation layer in a broader trading plan. If you already use moving averages in your workflow, this script turns them into an objective percentage-based structure map that is easier to compare across markets and timeframes.
How it works in detail
The engine calculates the percentage distance between a base moving average and seven additional moving averages. Every layer expresses whether it is above or below the base, and by how much. These percentage differences are plotted and can be filled against the zero line to visualize bullish and bearish structure. The Cascade logic looks for a cross of the zero line from the short, medium, or long layer, but only allows a signal when the extra long-term layers are already aligned in the same direction. This ensures that a short-term shift is supported by the broader trend stack instead of being a simple noise move.
The Macro Divergence module is built from confirmed pivot swings. It uses a long-term reference, defined by the long moving average, to find price pivots and compares those pivots with a smoothed oscillator derived from the extra long-term averages. Classic divergences are detected when price makes a higher high while the oscillator makes a lower high, or when price makes a lower low while the oscillator makes a higher low. Hidden divergences are detected when price retains trend structure but the oscillator counter-swings, often signaling trend continuation. To reduce random signals, the algorithm enforces a minimum spacing between pivots and a minimum amplitude for divergence strength. This makes the divergence layer a macro view rather than a noisy micro-signal engine.
How to use it
Use the zero line as the structural boundary. When the short, medium, and long layers move above zero, the short-term structure is bullish. When they move below zero, the short-term structure is bearish. Cascade signals are intentionally strict: they appear only when a base layer crosses zero and all extra long-term layers are aligned. This is a momentum confirmation event rather than a prediction. Divergences should be interpreted as early warnings: a classic bearish divergence suggests that a rally is losing strength at a macro high; a classic bullish divergence suggests accumulation at a macro low. Hidden divergences help you stay with the dominant trend when a temporary retracement appears.
Practical examples
Example for a bullish setup: The short or medium layer crosses above zero, all extra layers are already above zero, and a Cascade Buy highlight appears. This indicates a synchronized bullish structure across short and long horizons. If a hidden bullish divergence appears during a pullback while the extra layers remain positive, it supports the continuation case and provides a structure-based reason to hold the position rather than exit too early.
Example for a bearish setup: The short or medium layer crosses below zero, extra layers are already negative, and a Cascade Sell highlight appears. If a classic bearish divergence appears near a price high, it warns that the bullish structure is weakening and that risk should be reduced.
How the components work together
The Cascade layer acts as a strict trend-alignment filter. The Divergence layer provides macro context and early warnings. Together, they allow you to trade momentum in the direction of the dominant structure while also identifying areas where the structure is at risk of reversal. The oscillator visuals let you see when the trend stack is compressing or expanding, which adds additional context beyond simple cross signals. The percentage-difference approach also makes it easier to compare trend strength across different instruments, because the values scale relative to the base average instead of absolute price.
What makes this script original
This is not a simple moving-average mashup. The script transforms eight averages into a percent-difference oscillator, then uses a layered alignment system to validate momentum shifts and a pivot-based divergence engine to detect macro-level structure shifts. The combination of these two modules produces information that you do not get from a single MA crossover or a standard oscillator divergence. The multi-layer structure, amplitude filtering, pivot spacing, non-repainting framework, and alert language are original additions and are central to the script’s usefulness.
Markets and timeframes
The script is designed for any liquid market, including Forex, Crypto, Stocks, Commodities, and Indices. For intraday use, 15m to 4H timeframes give stable Cascade signals and readable divergences. On daily and weekly charts, divergences are fewer but carry higher significance. For scalping on 1m to 5m charts, reduce moving average lengths and pivot spacing to maintain responsiveness and keep the divergence layer from lagging too far behind. For day trading on 5m to 1H, the defaults work well and provide a balanced signal frequency. For swing trading on 1H to daily charts, consider increasing pivot spacing and smoothing to emphasize macro swings. For longer-term investing on weekly to monthly charts, increase the long and extra MA lengths to match the broader cycle.
Settings guidance
Base Length controls the anchor average used for all percentage differences. Short, Medium, and Long define the base cross structure and provide the momentum layer. Extra MA 1-4 are the long-term alignment stack for Cascade and the core of the divergence oscillator. Pivot lookback left and right define how far the script looks to confirm a swing; higher values mean fewer but stronger divergences. Minimum bars between pivots is a noise filter that avoids consecutive pivots. Oscillator smoothing reduces erratic swings and sharpens macro structure. Minimum divergence amplitude filters out weak divergence signals.
Tips for tuning
If the oscillator feels too reactive, increase the base length and smoothing to reduce noise. If Cascade signals are too rare, reduce the extra MA lengths or increase the base layer responsiveness. If divergences are too frequent, raise the minimum amplitude or increase the bars-between-pivots setting. If divergences are too slow, reduce smoothing and pivot length, but expect more false positives. These changes should be tested per symbol, because volatility and trading session behavior can differ significantly between markets.
Alerts
The alert system is fully integrated with the non-repainting framework. Cascade Buy and Cascade Sell alerts trigger only after confirmed bar close when the Cascade conditions are met. Divergence alerts trigger only after confirmed pivot formation, so they do not move once printed. Alert messages include symbol, timeframe, and price to support automation or manual monitoring. This makes the alerts suitable for discretionary traders and for automated alert-to-webhook workflows.
Non-repainting behavior
This script includes a dedicated non-repainting toggle. When enabled, all signals, drawings, and alerts are confirmed on closed bars. This means a signal cannot appear and then disappear. The trade-off is a small delay in signaling, but it ensures historical and live behavior match, which is critical for honest backtesting and reliable alerts. When disabled, the script remains visually responsive for exploration, but users should treat signals as provisional until the bar closes.
Disclaimer
This indicator is a technical analysis tool and does not constitute financial advice. No indicator is perfect. Always use risk management, validate signals with additional context, and test settings on your chosen market and timeframe before trading with real funds.
지표

Log Return Price Change Tanh OscillatorPrice Acceleration Oscillator (Normalized) — Detailed Description
Price Acceleration Oscillator (PAO) is a normalized momentum–acceleration indicator designed to measure how fast price is speeding up or slowing down, rather than simply whether it is going up or down.
Unlike traditional momentum oscillators that react mainly to price direction, PAO focuses on changes in momentum dynamics, making it especially useful for identifying early acceleration, deceleration, and momentum exhaustion phases.
Core Concept
PAO decomposes price movement into two components:
Velocity – the smoothed rate of price change
Acceleration – the change in velocity (momentum increase or decrease)
These components are statistically normalized and blended into a bounded oscillator, allowing consistent interpretation across different assets, timeframes, and volatility regimes.
Calculation Logic (High-Level)
Log Return (Scale-Invariant)
Uses N-bar logarithmic returns instead of raw price changes
Ensures consistency across instruments with different price levels
Velocity
Exponential moving average of log returns
Represents smoothed price speed
Acceleration
First difference of velocity
Measures whether momentum is increasing or fading
Statistical Normalization
Velocity and acceleration are independently normalized using rolling standard deviation
Converts both into dimensionless z-score–like measures
Weighted Blending
User-defined weighting between velocity and acceleration
Allows emphasizing trend persistence or momentum change
Nonlinear Compression (tanh)
Hyperbolic tangent transformation bounds the oscillator to ±100
Prevents extreme spikes while preserving structure
Dead Zone Filtering
Small values near zero are suppressed
Reduces noise and visual clutter in low-momentum conditions
Oscillator Interpretation
Above 0 → Bullish acceleration
Below 0 → Bearish acceleration
Key Zones
±25 → Early acceleration / deceleration
±50 → Strong momentum expansion
±80 → Extreme acceleration (potential exhaustion zones)
The oscillator measures momentum intensity, not trend direction alone.
Signal Line & Histogram
A smoothed EMA signal line is included for:
Momentum confirmation
Acceleration / deceleration transitions
Histogram shows the spread between oscillator and signal, highlighting momentum shifts and convergence/divergence behavior.
Background Regime Coloring
Optional background shading reflects acceleration strength:
Light colors → weak / early momentum
Darker colors → strong or extreme acceleration
This provides fast visual context without relying on signals.
Live Statistics Dashboard
The built-in table displays:
Current market state (Bullish / Bearish)
Momentum strength classification
Oscillator value and intensity
Signal spread and momentum bias
Return measurement context
Designed for decision support, not automated trade execution.
Alerts
Optional alerts are available for:
Zero-line acceleration shifts
Strong acceleration thresholds
Oscillator / signal crossings
Alerts reflect momentum state changes, not buy/sell instructions.
Intended Use
PAO is best used to:
Detect early momentum expansion or loss
Filter low-quality trades during choppy conditions
Complement trend-following or mean-reversion systems
Analyze market regime behavior rather than price direction alone
This indicator is not a standalone trading system and should be used in conjunction with broader market context, risk management, and confirmation tools. 지표

Dynamic Sigmoid ATR-Normalized EMA Distance OscillatorDynamic Sigmoid ATR-Normalized EMA Distance Oscillator
Overview
This indicator is built to evaluate trend strength and trend sustainability, not to prioritize mean-reversion calls.
It measures directional pressure relative to a long-term EMA, scales that pressure by current volatility, and maps the result into a stable 0-100 oscillator using a sigmoid transform.
The key advantage is dynamic adaptation: center and regime bands are not static references only, they adjust to evolving oscillator behavior.
This helps separate healthy trend continuation from weak, noisy movement.
Mathematical Construction (No Code Description)
1) Trend baseline:
A long-horizon exponential moving average defines structural direction.
2) Signed distance:
Distance = Price - EMA
Positive values imply price is structurally above baseline; negative values imply below-baseline pressure.
3) Volatility normalization:
Normalized Distance = Distance / ATR
This makes the signal scale-aware across different volatility environments.
4) Nonlinear compression:
Sigmoid(x) = 1 / (1 + e^(-k*x))
The multiplier k controls response sharpness.
The output is then scaled to 0-100.
5) Dynamic center:
Center = EMA of oscillator values (adaptive midpoint).
Optional fixed midpoint mode is available for a classic 50-line reference.
6) Dynamic regime bands:
Upper Band = Center + (StdDev of oscillator * multiplier)
Lower Band = Center - (StdDev of oscillator * multiplier)
These bands expand/contract with oscillator volatility, making the framework regime-aware.
How to Read It (Trend-Focused)
- Oscillator above dynamic center: bullish pressure dominates current regime.
- Oscillator below dynamic center: bearish pressure dominates current regime.
- Persistent distance from center: trend continuation probability is generally stronger.
- Oscillator flattening back toward center: trend sustainability may be weakening.
Long and Short Signal Framework
Long setup concept:
1) Oscillator crosses above dynamic center.
2) Oscillator remains above center for multiple bars (persistence confirmation).
3) Pullbacks that hold above center and re-expand upward can be treated as continuation entries.
Short setup concept:
1) Oscillator crosses below dynamic center.
2) Oscillator remains below center for multiple bars.
3) Bounces that fail near center and rotate down can be treated as continuation entries.
Strength confirmation:
- Rising histogram above zero supports long continuation quality.
- Falling histogram below zero supports short continuation quality.
Example Use Cases (Educational)
Example A - Long trend continuation:
- Market transitions from neutral to bullish as oscillator crosses and holds above center.
- Dynamic upper band begins rising, indicating expanding bullish regime capacity.
- Dips in oscillator that stay above center suggest trend remains structurally intact.
Example B - Short trend continuation:
- Oscillator breaks below center and stays suppressed under it.
- Lower band trends down while histogram remains negative.
- Failed recoveries toward center often mark lower-risk continuation timing.
Example C - Potential trend fatigue:
- Price makes a new directional push, but oscillator fails to sustain distance from center.
- Histogram contracts progressively.
- This can indicate weakening impulse and the need for tighter risk control.
Why Dynamic Components Matter
- A fixed 50-level alone can be too rigid when regime characteristics shift.
- Dynamic center adapts to the oscillator's local equilibrium.
- Dynamic bands adapt to oscillator variance, helping contextualize what is truly "extended" in current conditions.
Inputs (Configurable Parameters)
- EMA Length: structural trend anchor sensitivity.
- ATR Length: volatility normalization depth.
- Sigmoid Multiplier: nonlinear response intensity.
- Use Dynamic Center: adaptive center or fixed 50 reference.
- Center Length: smoothness of adaptive center behavior.
- Band Length: lookback horizon for oscillator variance.
- Band Stdev Multiplier: adaptive band width.
- Visual toggles: gradient and table display options.
Risk and Implementation Notes
- This is an analytical framework, not a guaranteed signal engine.
- Choppy markets can still produce false transitions.
- Parameter calibration should be done per symbol and timeframe with independent testing.
- Position sizing, stop logic, and risk limits remain essential.
Publishing and Compliance Notes
- Educational and analytical content only; not financial advice.
- No guaranteed returns, no performance promises, no misleading language.
- Real-world outcomes vary by market conditions, execution, and risk management.
지표

Multi Timeframe Scalper StructureWhat It Does
This indicator generates trend-filtered scalping entries by requiring three independent layers of confirmation before any signal appears. A higher-timeframe trend filter sets the allowed direction. Two separate EMA structure zones on the micro timeframe must both confirm momentum alignment. Only when all three agree does an entry dot print on the chart.
It also includes a real-time signal matrix table that shows which conditions are currently met, an on-chart TP/SL line system for quick risk-reward visualization, and configurable alerts.
How It Works
The indicator operates on two timeframe layers:
Macro layer — A moving average (selectable: EMA, SMA, WMA, or VWMA) is calculated on a higher timeframe you choose (default: 4H). If the closing price on that timeframe is above the MA, the macro trend is bullish. If below, bearish. This acts as a directional gate — no signal can fire against it. The chart background tints green or red to reflect this bias.
Micro layer — Two pairs of EMAs run on the chart timeframe (or a custom micro timeframe), each forming a colored filled zone:
Structure 2 (default periods: 16 and 30) — the wider zone. When its fast EMA is above its slow EMA, the zone fills green, confirming bullish intermediate momentum. Below fills red.
Structure 1 (default periods: 8 and 16) — the tighter zone, used for precise entry timing. A crossover of its fast EMA above the slow EMA is the trigger event for a long entry. A crossunder triggers a short entry.
Entry conditions:
A long entry dot appears when:
The macro layer is bullish (price above the higher-TF MA)
Structure 2 is bullish (fast above slow)
Structure 1 crosses bullish (fast crosses above slow)
A short entry dot appears under the mirror conditions — macro bearish, both structures bearish, Structure 1 crosses down.
Early reversal detection (optional) — When enabled, the indicator can also trigger a signal when Structure 2 flips from bearish to bullish (or vice versa), allowing entry before Structure 1 has crossed, as long as the macro confirms. This captures momentum shifts earlier.
Non-repainting — All higher-timeframe data uses lookahead_off. The "Wait for Candle Close" option (on by default) ensures signals only appear after the candle is fully confirmed.
How the Components Interact
The macro layer decides which direction you are allowed to trade — it is the filter. Structure 2 confirms that intermediate momentum on the chart timeframe has already shifted in that same direction — it is the confirmation. Structure 1 provides the exact timing — its crossover is the trigger that places the entry dot. Each layer serves a distinct purpose: direction, confirmation, and timing. A signal must pass through all three before it appears, which is what reduces noise compared to a single crossover system.
When early reversal detection is active, Structure 2 can also serve as an alternative trigger (its color flip), but only while the macro still confirms. This creates two possible trigger paths under the same directional filter.
How to Use It
Set your macro timeframe meaningfully above your chart timeframe. If you scalp on the 5-minute chart, a 1-hour or 4-hour macro works well. On the 1-minute, try 15 minutes or 1 hour.
The background color tells you the macro bias instantly — green for bullish, red for bearish.
Watch the two filled zones on your chart. When both turn green (or both red) and align with the background color, conditions are building toward a signal.
Entry dots appear at the bottom of the chart for longs (green) and at the top for shorts (red).
The signal matrix table (movable to any corner) shows real-time status of each layer: Macro Trend, Structure 2, Structure 1, and the combined result — LONG, SHORT, or WAIT.
Use the TP/SL tool to project take-profit and stop-loss lines on the chart. Set the direction (Long or Short), optionally enter a manual entry price, and configure your percentages. Up to two partial TP levels can be displayed alongside the main TP.
Set alerts using the built-in alert conditions ("LONG Signal" or "SHORT Signal") to be notified when a confirmed entry fires.
Key Features
Three-layer hierarchical filtering architecture: Each layer has a distinct role — directional gating (macro), momentum confirmation (Structure 2), and entry timing (Structure 1) — and all three must agree simultaneously. This multi-layer approach reduces noise compared to single crossover systems.
Dual EMA structure zones: Two independent pairs of EMAs operating at different speeds provide both intermediate momentum confirmation and precise entry timing under a separate higher-timeframe umbrella.
Early reversal detection: Optional second trigger path that reads when the wider Structure 2 zone changes polarity, allowing entries at the point where intermediate momentum shifts.
Real-time signal matrix: Dashboard view showing which conditions are satisfied in real time, turning the indicator into a structured workflow rather than just a dot generator.
Integrated TP/SL system: On-chart trade management with optional partial targets keeps risk management visible without needing a separate tool.
Non-repainting design: All signals are confirmed and use proper lookahead settings to ensure historical accuracy matches real-time behavior.
Suitability
Markets: Any liquid market — forex pairs, crypto, stock indices, commodities, equities.
Timeframes: Designed for lower chart timeframes (1m, 3m, 5m, 15m) with the macro set higher (1H, 4H). Can also be adapted for intraday swing setups using 15m–1H charts with a daily macro.
Trading style: Trend-following momentum scalping — taking quick entries in the direction of the dominant trend when short-term momentum confirms the higher-timeframe bias. Entries target short directional bursts within established trends, not reversals or range-bound conditions. The built-in candle-close confirmation and the three-layer filter are designed for disciplined, fast-execution scalping where you enter with momentum and exit at predefined percentage targets.
Disclaimer
This indicator is a technical analysis tool, not financial advice. It does not guarantee profits and does not predict future price movements. No indicator can eliminate risk. Past behavior of signals does not ensure future results. Always use proper risk management and assess your own financial situation before entering any trade.
지표

지표
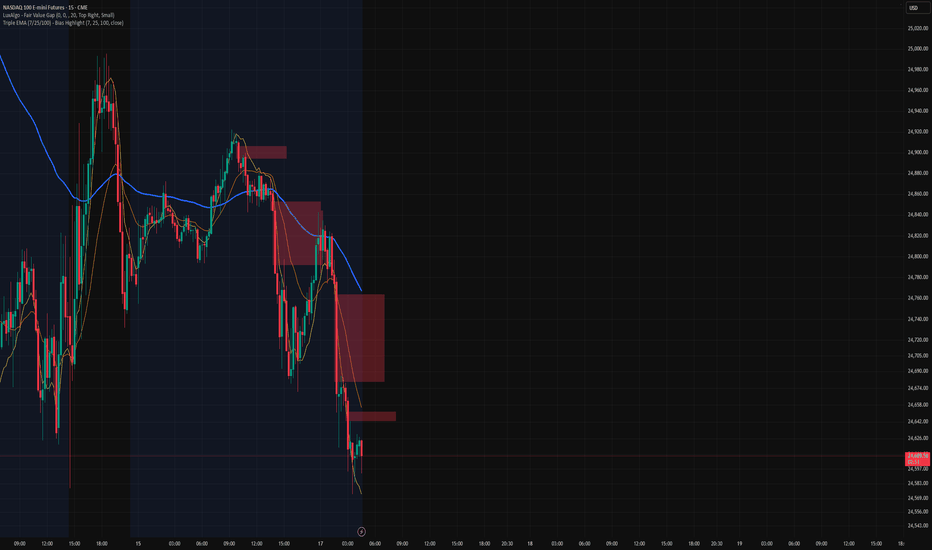
지표

지표

지표

EMA + RSI Trade Decision Table V2 This indicator is a rule-based trade decision assistant designed for intraday and swing trading.
It does not place trades automatically. Instead, it evaluates market conditions and clearly shows when a Long or Short setup is statistically favorable, using a structured score-based table.
The goal is simple:
👉 Fewer trades, higher quality, full transparency.
Core Concept
The script combines trend regime, RSI behavior, EMA pullbacks, and risk filters into a single decision framework.
Each bar is evaluated and assigned a confidence score (0–100) for:
Long
Short
Only setups that pass all required conditions and reach the minimum score threshold are marked as TRADE READY.
Key Features
1️⃣ Trend / Regime Detection
Bull Regime: EMA50 > EMA100
Bear Regime: EMA50 < EMA100
Optional confirmation using price vs EMA200
Regime is shown clearly at the top of the table
2️⃣ Regime-Based RSI Zones (Advanced)
RSI behavior changes depending on market regime.
This script accounts for that by using four separate RSI zones:
Bull Regime
Long RSI Zone: trend-continuation pullbacks
Short RSI Zone: overextended / exhaustion areas
Bear Regime
Short RSI Zone: weak pullbacks
Long RSI Zone: extreme oversold relief bounces
Neutral regime uses a configurable fallback zone.
➡️ This avoids the classic RSI mistake of using the same levels in all market conditions.
3️⃣ Pullback + Rejection Logic
Trades are only considered if price:
Pulls back into EMA50 or EMA100
Shows rejection confirmation
Bullish candle for Long
Bearish candle for Short
(optional, configurable)
This filters out random RSI signals and focuses on structured pullbacks.
4️⃣ Late Entry & Noise Filters
To avoid bad entries:
❌ Price too far from EMA50 → blocked
❌ EMA50–EMA100 too close → choppy market
❌ Cooldown after EMA50/EMA100 cross → no immediate revenge trades
All blockers are visible in the table.
5️⃣ Confidence Score (0–100)
Each setup is graded using weighted components:
RSI position
RSI confirmation
Pullback & rejection
Trend alignment
EMA200 context
Penalties for distance, cooldown, chop
Grades:
A = High-quality setup
B = Acceptable
C = Low quality
You decide the minimum score required to allow a trade.
6️⃣ Trade Decision Gate
A trade is only marked as EXECUTE (LONG/SHORT) if:
All mandatory conditions are met
Score ≥ your defined threshold
Otherwise, the system shows:
WATCH
PREPARE
NO SETUP
7️⃣ Visual Decision Table
Three display modes:
Compact – quick overview
Compact + Checks – overview + active checks
Full – complete Long & Short breakdown
Each row clearly shows:
Requirement
Current value
Pass / Fail
“To go” distance (how much is missing)
8️⃣ Alerts
Alerts trigger only on state change, not on every bar:
Long Entry
Short Entry
Optional:
Alerts only on candle close (recommended)
How to Use (Step-by-Step)
Recommended Workflow
Choose your timeframe (15m / 30m / 1H works best)
Wait for BULL or BEAR regime
Let price pull back into EMA50 / EMA100
Watch RSI move into the correct regime-based zone
Wait for EXECUTE (LONG / SHORT) status
Manage entry, stop-loss, and take-profit manually
This indicator is a decision filter, not an entry sniper.
Best Practices
Works best in trending markets
Avoid low-liquidity or sideways sessions
Combine with:
Market structure
Support / resistance
Session timing
Do not trade every signal — trade the best scores
Disclaimer
This script is an educational and analytical tool.
It does not provide financial advice and does not guarantee profitable trades.
Always manage risk properly. Ergün Özmen 지표

지표
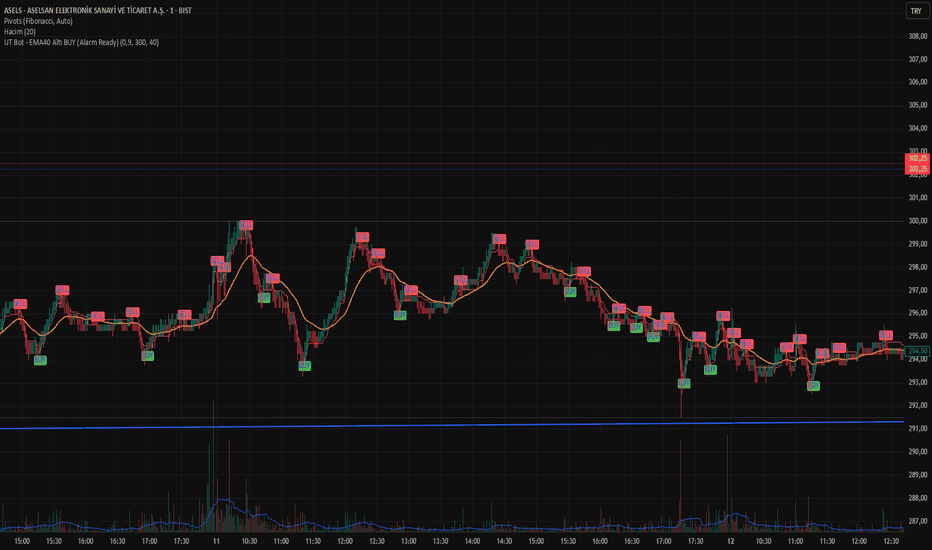
지표

지표

Nova_Stream Indicator V16.1Technical Documentation: Nova_Stream V16.1
Core Methodology
Nova_Stream is a multi-layered trend analysis framework designed for Version 6 of Pine Script. It operates by analyzing the convergence and divergence of two distinct moving average clusters against a long-term institutional baseline. Unlike standard oscillators, Nova_Stream evaluates market "velocity" through linear regression and volatility-adjusted distance metrics.
The Multi-Wave Engine
The system processes price data through 12 specific Exponential Moving Averages (EMAs), divided into two functional groups:
Momentum Cluster (Traders Group): Six blue EMAs (Periods 3 to 15) tracking immediate liquidity and short-term trend shifts.
Value Cluster (Investors Group): Six orange EMAs (Periods 50 to 100) representing the core psychological support and resistance zones of the market.
The Backbone (Institutional Filter): A 200-period EMA that acts as a global trend switch. For a signal to be valid, price action must maintain a specific relationship with this line to ensure institutional alignment.
The Intelligent Dashboard (UI Engine)
The integrated dashboard serves as a real-time data processor. It translates complex mathematical states into a readable format:
Market Status: Uses Linear Regression to determine the slope of the Backbone. If the slope is within the slopeThreshold, the market is classified as RANGE.
Squeeze Radar: Monitors the distance between the Momentum and Value clusters. A "Squeeze" alert is triggered when the distance is less than a fraction of the ATR, signaling potential volatility expansion.
Correction Risk: Measures the standard deviation of price from the Value Cluster. High deviation triggers an OVERBOUGHT/OVERSOLD warning to prevent entries at exhaustion points.
Volume Flow: A cumulative net-volume tracker that filters out low-conviction price moves.
Alert System Architecture
Nova_Stream includes a comprehensive alert suite based on alertcondition. These are designed to be used for both "Execution" and "Risk Management".
Nova/SuperNova Signals: Triggered when all technical layers (Trend, Volume, and MTF) align.
Safe Exit (SF): A specialized alert for closing positions. It triggers when the price shows exhaustion (Overbought/Oversold) and loses its momentum relative to the exitWave.
Multi-Timeframe (MTF) Verification
To increase the probability of success, the script includes a built-in MTF filter. It automatically fetches the trend state of a higher timeframe (e.g., 1-hour trend for a 10-minute chart) to ensure the user is not trading against the dominant market direction.
Disclaimer: This script is an educational and analytical tool only. It is not intended to be financial advice, and should not be used as the sole basis for any investment decision. Trading involves significant risk, and past performance is not indicative of future results. The author of this script shall not be held liable for any financial losses incurred through the use of this tool. Always perform your own due diligence and consult with a certified financial professional before trading. 지표

지표
지표

Ultimate RegimeUltimate Regime | MisinkoMaster
Ultimate Regime is an advanced market environment classification tool designed to identify whether an asset is currently operating in a trending or mean-reverting regime. Instead of focusing on entry signals, the indicator concentrates on answering a more fundamental question: what type of market are we trading right now?
By continuously evaluating market structure, volatility behavior, and directional persistence, the script provides a unified regime view that helps traders adapt strategy selection, risk management, and trade expectations to current conditions.
This makes Ultimate Regime particularly valuable for traders using multiple systems, algorithmic frameworks, or discretionary approaches that perform differently depending on market state.
Core Concept
Markets alternate between expansion phases where directional movement dominates and contraction phases where price oscillates around equilibrium. Strategies built for one condition often underperform in the other.
Ultimate Regime solves this by aggregating several environment measurements into a single regime score that expresses whether the market currently favors:
• Trend continuation strategies
• Breakout participation
• Momentum trading
or instead
• Range trading
• Mean reversion strategies
• Oscillation-based setups
The indicator therefore acts as a decision filter rather than a trade trigger.
Key Features
Unified regime classification combining multiple market characteristics
Automatic detection of trending vs mean-reverting environments
Smooth regime transitions to reduce noise and false flips
Visual histogram representing regime strength
Automatic chart candle coloring based on environment
On-chart regime change labeling for clarity
Configurable lookback and smoothing controls
Works across all timeframes and asset classes
Suitable for discretionary and systematic traders
Designed for integration into multi-indicator workflows
How It Works (Conceptual)
Instead of relying on a single measurement, Ultimate Regime evaluates several dimensions of market behavior simultaneously, such as:
• Price expansion versus contraction
• Volatility shifts
• Directional persistence
• Structural movement characteristics
These components are normalized and combined into a composite regime value. The result is then smoothed to ensure regime changes reflect genuine environment shifts rather than short-term fluctuations.
When the combined regime value turns positive, the market is considered to favor directional movement. When it turns negative, price behavior favors oscillation and mean reversion.
The internal weighting and transformation methods remain proprietary in the invite-only version.
Regime States Explained
Trending Regime
Indicates directional dominance where price tends to move persistently in one direction. Momentum and breakout systems typically perform better under these conditions.
Mean Reverting Regime
Indicates oscillatory behavior where price frequently returns toward equilibrium zones. Range strategies and reversal setups often become more effective.
Neutral Transitions
Short transition periods may occur during regime changes as the environment reorganizes before committing to a dominant state.
Visual Components
Regime Histogram
A histogram displays regime strength and direction, making it easy to gauge whether trending or reverting behavior dominates.
Colored Candles
Price candles automatically change color according to regime classification, allowing instant environment recognition directly on the chart.
Regime Change Labels
Labels appear when regime shifts occur, helping traders visually track transitions between trending and mean-reverting phases.
Reference Thresholds
Visual guide levels help users understand regime extremes and neutral zones.
Inputs Overview
Source
Selects the price data used for regime analysis.
High-Low Difference Lookback
Controls how far back structural price expansion is evaluated.
ATR Lookback
Adjusts how volatility expansion or contraction is measured.
Standard Deviation Lookback
Defines the evaluation window for statistical price dispersion.
ADX Lookback
Controls directional persistence measurement sensitivity.
Smoothing Period
Applies smoothing to regime calculations, balancing responsiveness and stability.
Higher smoothing reduces noise but delays regime changes. Lower smoothing reacts faster but may increase regime flipping.
Usage Guidelines
Use Ultimate Regime as a strategy filter rather than a direct entry signal.
Trending regime environments generally favor:
• Breakout systems
• Momentum entries
• Trend-following approaches
• Pullback continuation trades
Mean-reverting environments generally favor:
• Range trading
• Support and resistance reversals
• Oscillation strategies
• Counter-trend setups
Regime analysis works best when combined with entry and risk tools rather than used standalone.
Practical Applications
Strategy selection switching between trend and range systems
Position sizing adjustments based on environment strength
Filtering trades that conflict with prevailing market behavior
Algorithmic system optimization
Portfolio regime monitoring
Timeframe alignment analysis
Parameter Tuning Notes
Lower lookback values increase responsiveness but may produce faster regime changes.
Higher lookback values stabilize regime detection for swing or position trading.
Short smoothing periods work better for intraday trading.
Longer smoothing periods help long-term traders avoid noise.
Optimal settings vary by asset volatility and timeframe.
Best Practices
Combine regime detection with price structure and confirmation tools.
Avoid forcing trend systems in reverting environments and vice versa.
Use regime awareness to improve trade selection discipline.
Backtest strategies separately for trending and mean-reverting periods.
Summary
Ultimate Regime provides a structured and adaptive view of market conditions by classifying whether the environment favors trend continuation or mean reversion. By separating environment analysis from trade signals, traders gain clarity in strategy selection and improve consistency across changing market conditions.
The invite-only version preserves proprietary calculation methods while delivering a robust regime detection framework suitable for discretionary traders, system developers, and algorithmic strategies alike. 지표

Standard Deviation Supertrend | GForgeStandard Deviation Supertrend ~ 𝒢𝐹𝑜𝓇𝑔𝑒
A Supertrend indicator that replaces ATR with Standard Deviation for volatility measurement, combined with a selectable Moving Average anchor for noise reduction.
━━━━━━━━━━━━━━━━━━━━━━━━
What This Indicator Does
This is a trend-following overlay that plots a single trailing line on your chart. When price is above the line, the trend is bullish. When price crosses below, the trend flips bearish. Signals fire on each flip.
The core mechanic is identical to the classic Supertrend — ratcheting bands that tighten in the direction of the trend and only reset when price breaks through the opposite side.
━━━━━━━━━━━━━━━━━━━━━━━━
Why Standard Deviation Instead of ATR
ATR measures the average candle range. It treats all bars the same — a strong directional candle and a choppy gap produce equal ATR contributions.
Standard Deviation measures how far price disperses from its mean. During clean directional moves, prices cluster on one side of the mean, producing low StdDev and tighter bands. During erratic, sideways price action, prices scatter around the mean, producing high StdDev and wider bands.
The result: the trailing stop naturally tightens when the trend is clean and loosens when conditions are noisy. This is adaptive behavior that ATR-based Supertrends don't provide.
━━━━━━━━━━━━━━━━━━━━━━━━
Two Smoothing Layers
Raw Supertrend inputs can be noisy. A single wick or volatile candle can jerk the trailing band and cause a premature flip. This indicator addresses that with two optional smoothing layers:
Anchor MA — applies a Moving Average to the price source before bands are calculated. Instead of building bands around raw hl2 (which reacts to every wick), the bands are built around a smoother baseline. 11 MA types are available:
• None (hl2) — raw, classic Supertrend behavior
• SMA, EMA, WMA — standard options with varying lag
• HMA — very low lag, can overshoot on reversals
• DEMA, TEMA — reduced lag variants of EMA
• VWMA — volume-weighted, naturally anchors to high-volume levels
• RMA — Wilder's smoothing, very stable
• ALMA — Gaussian-weighted with tunable offset and sigma
• T3 — Tillson, extremely smooth with adjustable volume factor
StdDev Smoothing — applies an EMA to the raw Standard Deviation output before it scales the bands. This prevents abrupt band width changes when a volatile bar enters or exits the lookback window. Set to 1 to disable.
Together, these improve parameter robustness — small changes to settings produce smaller changes in output, meaning the indicator is less likely to break under slight parameter variation.
━━━━━━━━━━━━━━━━━━━━━━━━
Settings Overview
• Anchor Source — price input for the Supertrend. hl2 is the classic default.
• StdDev Length — lookback period for the Standard Deviation calculation.
• StdDev Multiplier — band width. Higher values require a larger move to flip direction. This serves the same purpose as a "threshold" in oscillator-based indicators.
• Anchor MA Type / Length — which Moving Average smooths the anchor, and its period.
• StdDev Smoothing — EMA period applied to the raw StdDev. 1 = no smoothing.
• ALMA Offset / Sigma — only active when ALMA is selected.
• T3 Volume Factor — only active when T3 is selected.
• Current settings work best on BTC 1D
━━━━━━━━━━━━━━━━━━━━━━━━
Visual Elements
• Glow trail — the Supertrend line pulses with a layered glow that changes color on trend direction.
• Trend fill — gradient fill between price and the trailing line.
• Inactive band — shown as crosses, marking where the opposite flip point sits.
• Anchor MA line — subtle reference line showing the smoothed anchor (hidden when set to None).
• Bar coloring — candles colored by current trend direction.
• Signal diamonds — dual-layer markers (halo + core) on trend flips.
All visual elements can be toggled on or off individually. 13 color themes are included.
━━━━━━━━━━━━━━━━━━━━━━━━
⚠️ Disclaimer
This indicator is a technical analysis tool, not financial advice. It does not guarantee profitable results. Past performance on any asset or timeframe does not indicate future results. No indicator can predict market direction with certainty.
Always use proper risk management. Do not rely on any single indicator for trading decisions. Test thoroughly on your chosen instruments and timeframes before applying to live markets. You are solely responsible for your own trading decisions and outcomes.
━━━━━━━━━━━━━━━━━━━━━━━━
Developed by 𝒢𝐹𝑜𝓇𝑔𝑒 지표

지표

전략

Buy Signal EMA& RSI [CocoChoco]█ OVERVIEW
This indicator is a momentum breakout tool designed for trend-following traders.
It produces buy signals (long only).
It is based on the "50-200 EMA & RSI25 crossover indicator" by rahulbalaji4574, which has been upgraded to Pine Script v6. Most importantly, I added filters to reduce false signals and improve overall timing.
The core logic ensures you only enter a trade when a long-term trend is confirmed, momentum is surging but not exhausted, and there is significant market participation (volume).
█ KEY IMPROVEMENTS & LOGIC
This version introduces several "Smart Filters" to the original base logic:
Momentum Sweet Spot: Unlike the original which only required RSI > 50, this version requires the RSI to be between 55 and 80 and actively rising. This avoids "choppy" entries and overextended "blow-off tops."
Trend Strength (ADX): An integrated ADX filter ensures the market is in a strong trend (ADX > 20) before a signal is generated.
Risk Management (ATR Trailing Stop): A dynamic trailing stop-loss based on 1.5x ATR is plotted automatically to help you manage risk and lock in profits.
Real-time Dashboard: A non-intrusive table in the bottom-right corner displays live RSI and ADX values for quick reference.
█ HOW TO USE
Look for the Signal: A large green triangle appears below a bar when all trend, momentum, and volume conditions align.
Manage the Trade: Use the plotted red line as your dynamic trailing stop-loss. If the price closes below this line, the trade is considered exited, and the stop will reset.
Confirm with the Dashboard: Check the bottom-right corner to see if the market is gaining strength (ADX) or nearing exhaustion (RSI).
█ ADJUSTING SETTINGS
You can fully customize the indicator by clicking the Settings (gear icon) next to the indicator name on your chart.
Inputs Tab: Adjust the RSI thresholds, EMA lengths, or the ATR multiplier to fit your specific asset and timeframe.
Style Tab: Change the colors of the 50/200 EMA, the trailing stop-loss line, and the signal triangles to match your chart's theme.
지표

전략