지표

전략
지표

지표

Multi-Factor Return Attribution / Fundamental AnalysisHere's the updated post with ORCL woven in:
Multi-Factor Return Attribution (MFRA)
Every stock return is a mix of forces. Part of the move comes from the broad market lifting or dragging everything with it. Part comes from capital rotating into or out of the sector. Part comes from flows specific to the sub-industry. And whatever's left — the piece none of those explain — is the stock's own fundamental or idiosyncratic signal.
MFRA decomposes equity returns into exactly these four layers: Broad Market, Sector, Sub-Sector, and Idiosyncratic, using a rolling orthogonalized regression framework that runs directly on your chart.
The default configuration ships with **ORCL** (Oracle) as the stock, **SPY** as the market proxy, **XLK** as the sector ETF, and **IGV** (software sub-sector) as the sub-industry ETF — but every symbol is configurable to any equity/ETF combination.
How It Works
The indicator takes four price feeds as input. Daily returns are computed for each, then transformed into orthogonal factors using a Gram-Schmidt-style subtraction chain — the sector factor becomes XLK return minus SPY return, the sub-sector factor becomes IGV return minus XLK return. This ensures each layer captures only incremental information, with no double-counting between levels.
A rolling OLS regression (configurable window, default 21 days) solves a full 4×4 normal equation system on every bar, estimating an intercept (alpha) and three slope coefficients (betas) against the orthogonalized factors. These betas represent the stock's current sensitivity to each layer of the return hierarchy. The residual — total return minus the sum of all factor contributions — isolates the idiosyncratic component: moves driven by earnings, guidance, analyst revisions, or anything else unique to the name.
The decomposition is exact. On every bar, the four attributed components sum precisely to the stock's total return. Nothing is lost, nothing is fabricated.
Reading It: ORCL as an Example
Oracle sits at an interesting intersection — it's a mega-cap tech name with exposure to cloud infrastructure, enterprise software, and database, which means its returns get pulled by broad market risk (SPY), tech sector rotation (XLK), and software-specific flows (IGV) simultaneously. MFRA separates all of that.
When ORCL rallies on a day the entire market is up, the stacked histogram shows a large cyan (Broad Market) bar — most of the move was just beta. But when Oracle moves on an AI infrastructure deal, a cloud revenue beat, or a Larry Ellison keynote and neither SPY nor XLK nor IGV moved proportionally, the magenta (Idiosyncratic) component dominates. That's the stock's own story, isolated from everything systematic.
If tech is rotating into software names specifically — IGV outperforming XLK which is outperforming SPY — you'll see the green (Sub-Sector) layer stacking up, telling you Oracle is riding a sub-industry wave, not generating alpha on its own.
The snapshot table in the top right gives you the exact numbers: how many percentage points of ORCL's recent return came from each source, the current betas, R², and daily alpha in basis points.
What Each Component Tells You
- Broad Market (cyan) — How much of the stock's move is just beta to the index. When this dominates, the stock is being carried by macro sentiment, not its own story.
- Sector Flows (orange) — Capital rotating into or out of the sector beyond what the broad market explains. Large sector contributions during flat market days reveal pure sector rotation trades.
- Sub-Sector Flows (green) — Thematic or sub-industry-specific moves beyond sector-level flow. For ORCL, this captures software/cloud momentum (IGV) that's distinct from broader tech (XLK).
- Fundamental / Idiosyncratic (magenta) — The residual. This is the stock's own signal — the return component that none of the systematic factors explain. Persistent idiosyncratic contribution suggests a name-specific catalyst is in play. Sudden spikes often align with earnings, news, or positioning shifts.
Four Chart Views
*Rolling Decomposition* — Stacked histogram showing the N-day rolling sum of each component's contribution (in percentage points), with positive and negative values stacked independently from the zero line. A white line traces total return for reference.
*Cumulative Attribution* — Same stacking logic, but cumulated from the start of the visible history. Shows how much of ORCL's total performance over the period came from each source — useful for answering "was this a beta trade or an alpha trade?"
*Rolling Betas* — Time series of the three regression coefficients. Tracks how ORCL's factor sensitivities evolve. A market beta rising above 1.0 means the name is becoming more aggressive than SPY; a sector beta collapsing toward zero means Oracle is decoupling from XLK.
*R-Squared* — The model's explanatory power over time. High R² means ORCL is moving in lockstep with its systematic factors. Low R² means idiosyncratic forces dominate — exactly when single-stock analysis matters most.
Practical Use Cases
Pre-earnings, check whether ORCL's recent run is broad-market-driven or idiosyncratic — the answer changes how you size and hedge the position. During sector rotations, isolate whether Oracle is participating because of tech/software flows or its own fundamentals. After a large move, decompose it immediately: was it SPY, XLK, IGV, or Oracle itself? That distinction determines whether the move is likely to mean-revert or persist.
Configuration
All four symbols are configurable — swap ORCL for any stock, change the sector/sub-sector ETFs to match. OLS window controls regression lookback (default 21 days). Rolling decomposition window controls the summation period for the histogram view (default 5 days). Snapshot table can be toggled on or off.
Methodology Note
The orthogonalization is a simplified Gram-Schmidt procedure applied to return differences rather than a full iterative projection. This is deliberate — it produces clean, interpretable factor layers (market → sector excess → sub-sector excess) without the numerical overhead of a full QR decomposition, and the resulting attribution remains exact. The regression is solved via direct 4×4 matrix inversion using cofactor expansion, with no external library dependencies. 지표

지표
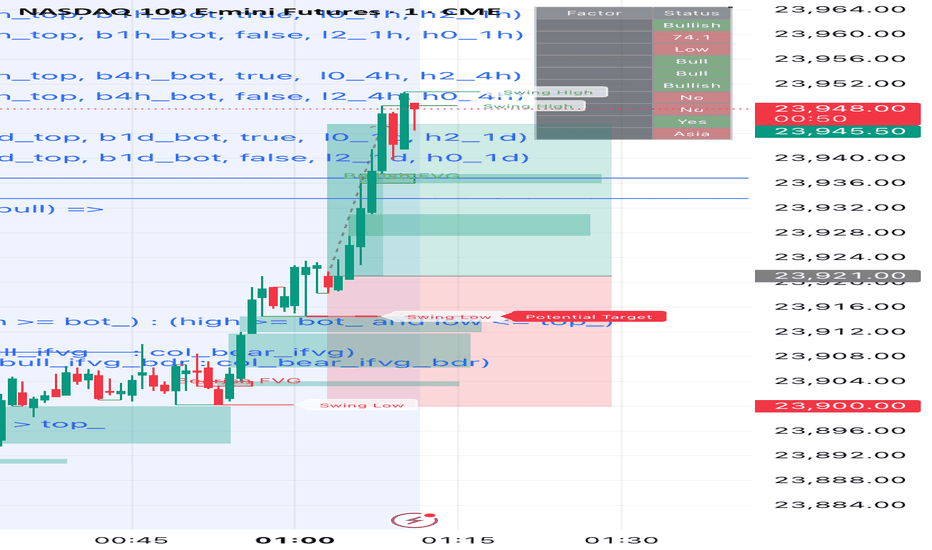
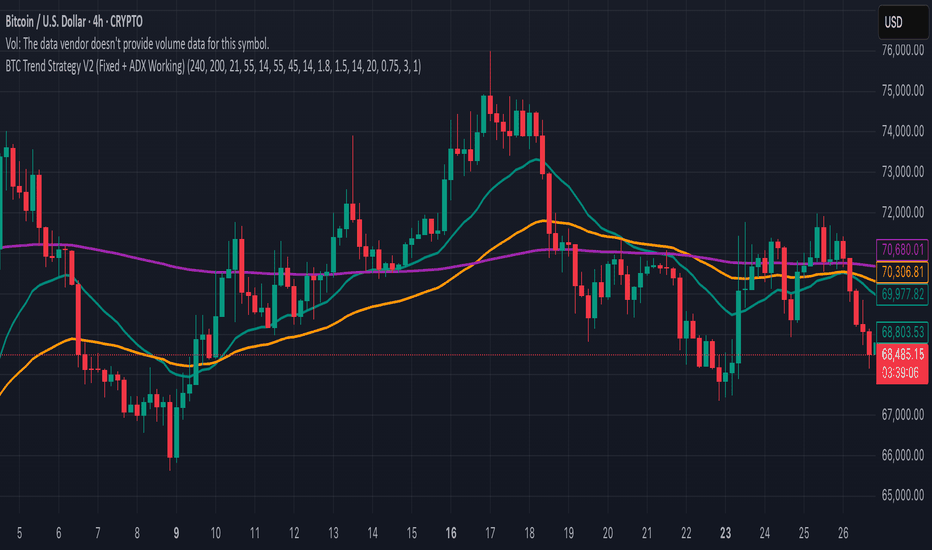
[Anwar] : BTC Trend Strategy V2 (Fixed + ADX Working)📊 Strategy Description
This strategy is a trend-following, pullback-based trading system designed for Bitcoin. It combines multiple indicators—EMA (trend), ADX (trend strength), ATR (volatility), and RSI (momentum)—to identify high-probability trade setups. Trades are taken only when the broader trend aligns across timeframes, and entries occur on controlled pullbacks rather than chasing price. Risk is managed using ATR-based stop losses and trailing exits, allowing the strategy to adapt dynamically to market volatility.
🚀 Why This Works
The strategy works because it focuses on trading with the market, not against it:
Trend alignment (HTF + EMA) ensures trades follow the dominant market direction
ADX filter removes weak or sideways conditions, avoiding low-quality trades
Pullback entries improve timing and reduce buying/selling at extremes
Volatility filter (ATR) avoids dead markets and enhances movement capture
Trailing stops allow profits to run during strong Bitcoin trends
Together, these elements create a system that reduces noise, improves trade quality, and captures larger moves, which is essential in a volatile market like Bitcoin. 전략
지표

지표

지표

지표
지표
Multi-Indicator DashboardTrend Dashboard Description
Trend Dashboard is a multi-indicator market analysis tool designed to combine several widely used technical signals into one clean on-chart panel. Instead of loading separate indicators for momentum, trend, volatility, and volume confirmation, this script brings them together into a compact dashboard that helps traders evaluate overall market conditions at a glance.
The goal of the indicator is to reduce chart clutter while still preserving the most useful information from a broader technical workflow. It allows traders to monitor multiple dimensions of price action in one place, making it easier to confirm setups, avoid conflicting signals, and build a faster read on trend quality.
The dashboard currently includes the following components:
MACD
Displays the MACD line and signal line, along with a bullish or bearish reading based on whether the MACD line is above or below the signal line. This helps identify momentum direction and possible trend continuation or weakening momentum.
RSI
Displays the current RSI value and classifies it as Bullish, Bearish, Overbought, or Oversold. Overbought and oversold levels are user-configurable, with common defaults of 70 and 30. This helps traders quickly identify momentum strength as well as potential exhaustion zones.
EMA Trend
Uses a fast EMA and slow EMA structure, along with current price position, to classify trend conditions more clearly than a simple crossover. The dashboard labels the trend as:
Strong Uptrend
Weak Uptrend
Weak Downtrend
Strong Downtrend
This gives traders a more nuanced understanding of whether price is aligned with trend structure or temporarily pulling back against it.
Stochastic
Displays smoothed %K and %D values and classifies the condition as Bullish, Bearish, Overbought, or Oversold. Overbought and oversold thresholds are configurable, with common defaults of 80 and 20. This helps highlight short-term momentum shifts and possible reversal zones.
ATR
Displays the current Average True Range and compares it against its recent average to determine whether volatility is relatively high or low. This gives context around market expansion and contraction, which can be useful for trade timing, stop placement, and breakout evaluation.
OBV
Displays On-Balance Volume alongside its moving average and classifies the current state as Accumulation or Distribution. This adds a volume-confirmation layer to the dashboard and helps traders assess whether buying or selling pressure is supporting the current market move.
Why Use This Indicator
Trend Dashboard is useful for traders who want a broader market read without stacking multiple panes and overlays across the chart. It is especially helpful for:
quickly checking alignment between momentum and trend
spotting overbought and oversold conditions
confirming whether volatility is expanding or contracting
seeing whether volume is supporting price action
reducing the need to manage several separate indicators
By combining these tools into one structured panel, the script can act as a pre-trade checklist or a general market condition monitor.
Customization
The script includes adjustable inputs for all major calculations, including:
MACD fast, slow, and signal lengths
RSI length, bullish threshold, overbought level, and oversold level
EMA fast and slow lengths
Stochastic length, smoothing values, overbought level, and oversold level
ATR length and ATR comparison lookback
OBV moving average length
dashboard table position
This allows the indicator to be adapted for different assets, timeframes, and trading styles.
Best Use Cases
This dashboard can be useful for:
trend traders looking for alignment across multiple signals
swing traders wanting a quick technical summary
intraday traders monitoring momentum, volatility, and volume confirmation
traders who want a more organized chart layout with fewer separate indicators
Notes
This script is intended as a decision-support tool, not a standalone trading system. Like all indicators, it works best when interpreted in market context and combined with price structure, support and resistance, and risk management.
If you want, I can also turn this into:
a polished TradingView public-library description
a shorter “About” version
a feature list with bullet formatting for publication
recommended tags/keywords 지표

지표

Larry Williams Valuation Index [tradeviZion]Stop guessing whether an asset is "cheap" or "expensive." Based on the legendary methodology developed by Larry Williams in 1990 (the WillVal Index), this upgraded indicator measures the true intrinsic valuation of an asset by comparing it against key macroeconomic correlations.
While price tells you what the market is paying right now, Valuation tells you what the asset is actually worth. This isn't just a standard WVI script. We have engineered it into a comprehensive macro-dashboard that evaluates the asset against three universal benchmarks (like the Dollar, Gold, and Treasuries) PLUS a dynamic, auto-detecting Sector ETF.
🌟 Exclusive Features
1. Auto-Sector Relative Strength (The Game Changer)
By default, the script compares your current asset against 3 primary symbols (e.g., DXY, GC1!, ZB1!).
The 4th Asset: The script features a built-in "Sector Brain." It automatically reads the sector of the stock you are viewing (e.g., Technology, Financials, Healthcare) and pulls the data for the corresponding Sector ETF (XLK, XLF, XLV, etc.). This tells you instantly if Apple is undervalued compared to the broader Tech sector!
2. Macro-Locked Calculation (1D)
Valuation is a macro concept, not a 5-minute scalping tool. To protect you from intraday noise, the core mathematical engine is strictly locked to the Daily (1D) Timeframe. You can trade on the 1-minute or 1-hour chart, and the indicator will silently calculate the true daily valuation in the background.
3. Adaptive vs. Fixed Thresholds
Manual Levels: Use the classic Larry Williams fixed thresholds (e.g., Overvalued > 85, Undervalued < 15).
Auto Levels: Markets change. Turn on Auto Levels to let the script dynamically calculate the overbought/oversold thresholds based on recent price extremes, smoothed by a custom multiplier.
4. Multi-Security Consensus Alerts
Reduce false signals. The built-in alert system allows you to require a consensus. For example, you can set the alerts to trigger a "Buy" signal ONLY if at least 3 out of the 4 tracked securities are showing an "Undervalued" reading simultaneously.
5. Clean Visual Dashboard
A sleek, customizable on-chart table displays the exact valuation score (0-100 scale) and the current status (Over, Under, or Normal) for all four correlated assets. The indicator lines change color dynamically when entering extreme valuation zones.
⚙️ How the Math Works
The WillVal methodology doesn't just look at price. It takes the ratio of the current asset against a correlated security, applies a dual Exponential Moving Average (EMA) momentum oscillator to identify trends, and then normalizes the result on a 0-100 scale using a historical lookback period (default is 156 bars, representing roughly 3 years of data).
💡 How to Trade It
Undervalued (Green Zone): When the index drops below the lower threshold (e.g., 15), the asset is historically cheap compared to its correlations. Look for bullish setups or accumulation zones.
Overvalued (Red Zone): When the index rises above the upper threshold (e.g., 85), the asset is historically expensive. This is a warning sign to tighten stop losses, take profits, or look for bearish distribution.
Note: Valuation indicates extreme conditions, but extreme conditions can persist. Always pair valuation readings with price action confirmation (like Order Blocks, VWAP, or trendline breaks) before executing a trade. 지표

지표

Sessions + Prev + PDH/PDL + Killzones SuiteDescription
This indicator is designed to provide time-based and price-based market context by combining session ranges with commonly referenced prior levels into a single, unified framework.
The purpose of the script is contextual analysis, not signal generation.
What the script does
The script tracks and plots the following elements directly on the price chart:
• High and Low ranges for multiple trading sessions (Asia, London, New York morning, and New York afternoon)
• High and Low levels from the previous occurrence of each session
• Prior Day High (PDH) and Prior Day Low (PDL)
• Optional session “killzone” boxes that visually mark active session time windows
All calculations are performed using time-based session boundaries and price extrema (high/low) within those windows.
Why these components are combined
Sessions, previous session levels, and prior day levels are frequently analyzed together by discretionary traders because they represent:
• Where liquidity formed earlier in the day or previous day
• Where price previously paused, expanded, or reversed
• Natural reference points for intraday structure and range analysis
Instead of plotting these elements using multiple separate scripts, this indicator integrates them into one consistent framework so that all levels are calculated using the same timezone, session logic, and display rules.
This avoids mismatched session times, duplicate levels, or conflicting calculations that can occur when multiple scripts are used simultaneously.
How the script works (high-level)
• Each session is defined using user-selectable session times and timezone
• During a session, the script tracks the highest and lowest traded price
• When a session ends, its final high and low are stored as the “previous session” levels
• PDH and PDL are calculated using the completed trading day
• Lines and labels are anchored to the bars where levels are formed, rather than extending indefinitely
• Optional display filters allow users to show only the current trading day to reduce chart clutter
No forward-looking logic, prediction, alerts, or trade execution logic is included.
How to use it
This script is intended to be used as a visual reference tool to help traders:
• Identify session boundaries and intraday ranges
• Observe how price reacts near prior session highs and lows
• Assess where price is trading relative to PDH and PDL
• Maintain consistent session timing across different timezones
The script does not provide trade entries, exits, alerts, or performance claims.
Important notes
• This indicator does not generate buy or sell signals
• It does not predict future price movement
• It is not a trading strategy
• All decisions remain the responsibility of the user
Disclaimer
This script is provided for educational and informational purposes only.
It does not constitute financial advice. Trading involves risk, and users should apply appropriate risk management and personal judgment when using any technical tool. 지표

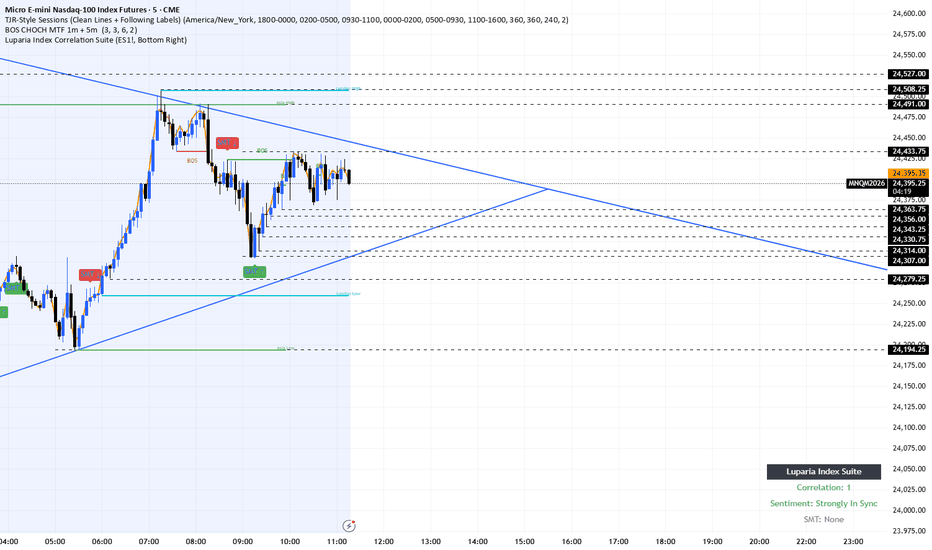
NQ Swing Command Intraday NQ Swing Command – Intraday (15m/30m/1h)
A structured intraday trading system built for the Nasdaq-100 Index (NQ), designed to capture clean swing moves using multi-timeframe confluence. This script aligns 15m execution with 30m confirmation and 1H directional bias, giving traders a clear framework for timing entries within the broader market structure.
The strategy focuses on identifying trend continuation and reversal zones, combining price action, momentum, and key levels to deliver high-probability setups. Whether you're trading pullbacks, breakouts, or intraday swings, this system helps filter noise and keep you trading in sync with market flow.
Built for consistency and discipline, NQ Swing Command is ideal for traders looking to:
*Follow structured, rule-based setups
*Improve entry timing across multiple timeframes
*Capture intraday swings with confidence
*Stay aligned with overall market direction
A clean, no-fluff approach to mastering intraday movement on NQ. 지표

지표

Moon Boys BTC Production Cost Daily137
═════════════════════════════════════════════════════════════
Moon Boys BTC PRODUCTION COST DAILY
═════════════════════════════════════════════════════════════
Track Bitcoin's real-time production cost using comprehensive electricity consumption data and mining economics to identify macro support/resistance zones.
═══ OVERVIEW ═══
This indicator calculates Bitcoin's actual cost of production by combining Cambridge Bitcoin Electricity Consumption Index (CBECI) data with electricity pricing models across different mining eras. It reveals where miners are profitable or underwater, providing crucial macro-level support zones that have historically acted as psychological and economic floors.
Perfect for:
• Identifying long-term accumulation zones
• Understanding miner profitability and capitulation risk
• Spotting macro support levels during bear markets
• Gauging healthy vs. overheated price levels
• Planning dollar-cost averaging strategies
═══ KEY FEATURES ═══
📊 COMPREHENSIVE HISTORICAL DATA
└─ 378 data points spanning 2011-2026
└─ Complete CBECI electricity consumption dataset
└─ Verified accuracy: all dates and values cross-checked
└─ Updates every ~14 days with new CBECI releases
⚡ ELECTRICITY COST MODELING
└─ Pre-June 2019: $0.05/kWh (Early mining era)
└─ Pre-April 2021: $0.04/kWh (China dominance period)
└─ Post-May 2021: $0.05/kWh (China exodus, Western migration)
└─ Post-April 2024: $0.05/kWh (Post-4th halving era)
└─ Fully customizable for scenario analysis
🎯 DUAL COST CURVES
└─ Red line: Pure electricity cost per BTC
└─ Purple line: Total production cost (electricity + operations)
└─ Green line: Miner price (spot + transaction fee revenue)
└─ Pink fill: Zones where miners are losing money
📈 AUTOMATIC HALVING ADJUSTMENTS
└─ Integrates all Bitcoin halvings (2012, 2016, 2020, 2024)
└─ Block reward automatically adjusts: 50 → 25 → 12.5 → 6.25 → 3.125
└─ Accurate per-day BTC production calculations
💰 PROFIT MARGIN TRACKING
└─ Annual profit margin labels (optional)
└─ Shows miner profitability percentage
└─ Appears on chart at electricity cost level
└─ Calculated using 365-day moving average
═══ HOW TO READ IT ═══
┌─────────────────────────────────────────────────────────┐
│ INDICATOR │ MEANING │
├─────────────────────────────────────────────────────────┤
│ 🟢 Green Line │ Miner Price (BTC price + fee revenue)│
│ (above purple) │ → Miners profitable, healthy market │
├─────────────────────────────────────────────────────────┤
│ 🟢 Green Line │ Price below production cost │
│ (below purple) │ → Miner capitulation zone │
│ │ → Strong historical buy signal │
├─────────────────────────────────────────────────────────┤
│ 🔴 Red Line │ Pure electricity cost per BTC │
│ │ → Absolute minimum mining cost │
├─────────────────────────────────────────────────────────┤
│ 🟣 Purple Line │ Total production cost │
│ │ → Break-even for miners (60% elec) │
├─────────────────────────────────────────────────────────┤
│ 🌸 Pink Fill │ Below-cost territory │
│ │ → Miners selling at a loss │
│ │ → Historical accumulation zone │
└─────────────────────────────────────────────────────────┘
═══ TRADING APPLICATIONS ═══
🐻 BEAR MARKET BOTTOMS
→ Price touching or breaking below production cost = high probability bottom
→ Extended periods below cost = miner capitulation
→ Historical bottoms: Nov 2011, Jan 2015, Dec 2018, Nov 2022
→ Strongest buy signal in macro Bitcoin investing
📈 BULL MARKET HEALTH CHECKS
→ Distance above production cost = market heat level
→ 100-200% above cost = healthy bull market
→ 500%+ above cost = euphoric/bubble territory
→ Use as take-profit reference points
💎 ACCUMULATION STRATEGY
→ DCA when price approaches production cost
→ Increase buy size when price drops below cost
→ Maximum allocation when 10-20% below cost
→ Layer entry as margin shows negative percentages
⚖️ SUPPORT/RESISTANCE ZONES
→ Production cost acts as macro support in downtrends
→ Often becomes resistance after prolonged bear markets
→ Price reclaiming cost = bullish structural shift
→ Failed reclaims = continued weakness
🔄 HALVING CYCLE ANALYSIS
→ Cost doubles after each halving (supply cut)
→ Price typically consolidates near new cost basis
→ Historic pattern: break above cost = new bull cycle
→ Track 6-12 months post-halving for trend confirmation
═══ SETTINGS GUIDE ═══
⚡ ELECTRICITY COST ASSUMPTIONS (USD/kWh)
├─ Pre-June 2019 (0.05): Early mining era, hobby miners
├─ Pre-China Exodus 2021 (0.04): Cheap Chinese hydropower
├─ Post-May 2021 (0.05): Western migration, higher costs
└─ Post-April 2024 (0.05): Current era post-4th halving
💡 Adjust these for "what if" scenarios or local costs
💰 ELECTRICITY PERCENTAGE (Default: 60%)
└─ Electricity as % of total mining costs
└─ Remaining 40% = hardware, labor, rent, maintenance
└─ Lower % = higher total cost (more conservative)
└─ Typical range: 50-70%
🎨 VISUAL TOGGLES
├─ Plot BTC Miner Price: Show/hide green line
│ └─ Includes transaction fee revenue per BTC
├─ Plot Production Cost Curves: Show/hide red & purple lines
└─ Plot Annual Profit Margin Labels: Show/hide margin %
└─ Appears annually (Jan 1st) and on last bar
═══ HOW IT WORKS ═══
1. ELECTRICITY CONSUMPTION DATA
• Cambridge Bitcoin Electricity Consumption Index (CBECI)
• Actual network-wide energy usage in TWh (terawatt-hours)
• Updated bi-weekly with real hash rate data
• 378 historical data points (Aug 2011 - Jan 2026)
2. COST CALCULATION FORMULA
Electricity Cost per BTC =
(TWh per year / 365.25 days) ×
(10^9 to convert to kWh) /
(BTC mined per day) ×
(Electricity price per kWh)
Total Cost per BTC =
Electricity Cost / (Electricity % of total costs)
3. BTC MINED PER DAY
Blocks per day (144) × Block reward
• 2009-2012: 50 BTC/block = 7,200 BTC/day
• 2012-2016: 25 BTC/block = 3,600 BTC/day
• 2016-2020: 12.5 BTC/block = 1,800 BTC/day
• 2020-2024: 6.25 BTC/block = 900 BTC/day
• 2024+: 3.125 BTC/block = 450 BTC/day
4. MINER PRICE METRIC
Spot close price + (Transaction fees per day / BTC mined per day)
• Currently simplified with fees = 0
• Shows true revenue per BTC for miners
5. PROFIT MARGIN CALCULATION
((Miner Price / Total Cost) - 1) × 100
• Smoothed with 365-day SMA
• Shows sustainable annual profitability
═══ BEST PRACTICES ═══
✅ DO:
• Use on DAILY timeframe for accuracy (designed for daily data)
• Combine with on-chain metrics (SOPR, MVRV, Puell Multiple)
• Layer with traditional TA for entry/exit timing
• Understand this is AVERAGE global cost (varies by miner)
• Use as macro filter, not short-term trading signal
• Check profit margins during capitulation events
❌ DON'T:
• Use as sole indicator for short-term trades
• Ignore that efficient miners have much lower costs
• Forget that cost is constantly rising (hash rate + difficulty)
• Assume price can't go below cost (it can temporarily)
• Trade based only on cost - liquidity events can wick lower
• Expect instant reversals at cost levels
═══ HISTORICAL PERFORMANCE ═══
Major Bitcoin bottoms near/below production cost:
📅 November 2011
Price: ~$2 | Cost: ~$5
→ 60% below cost, -95% drawdown
→ Bottom signal ✓
📅 January 2015
Price: ~$150 | Cost: ~$180
→ 17% below cost, -85% drawdown
→ Bottom signal ✓
📅 December 2018
Price: ~$3,200 | Cost: ~$3,500
→ 9% below cost, -84% drawdown
→ Bottom signal ✓
📅 November 2022
Price: ~$15,500 | Cost: ~$17,000
→ 9% below cost, -77% drawdown
→ Bottom signal ✓
Pattern: When price trades below production cost, accumulation zone.
═══ TECHNICAL NOTES ═══
• Built with Pine Script v5
• Data source: Cambridge Centre for Alternative Finance (CBECI) Updated Quaterly by Request
• All dates/values verified against official CSV dataset
• Electricity price adjusts based on major mining regime shifts
• Uses series variables for proper historical calculation
• Forward-fills data between CBECI update periods
• Accounts for all 4 halvings in BTC history
═══ DATA PERIODS EXPLAINED ═══
🏭 PRE-JUNE 2019 ($0.05/kWh)
Early mining era, distributed hobby miners, average global cost
🇨🇳 JUNE 2019 - APRIL 2021 ($0.04/kWh)
China dominance period, cheap hydropower in Sichuan/Yunnan
🌍 MAY 2021 - APRIL 2024 ($0.05/kWh)
China ban, Western migration, renewable energy transition
🔮 POST-APRIL 2024 ($0.05/kWh)
4th halving, institutional mining, current era
═══ UNDERSTANDING MINING ECONOMICS ═══
⚡ ELECTRICITY = 60% OF COST (Default)
└─ Largest variable expense for miners
└─ Directly tied to hash rate and difficulty
🔧 OTHER COSTS = 40%
├─ ASIC hardware (depreciation)
├─ Facility rent and cooling
├─ Labor and maintenance
├─ Internet and infrastructure
└─ Insurance and legal
💰 REVENUE SOURCES
├─ Block subsidy (newly minted BTC)
└─ Transaction fees (variable, usually 2-10% of revenue)
📉 MINER BEHAVIOR
• Profitable: Accumulate BTC, expand operations
• Break-even: Hold BTC, maintain operations
• Unprofitable: Forced selling, potential capitulation
═══ ADVANCED USE CASES ═══
🔬 SCENARIO ANALYSIS
→ Adjust electricity costs to model different regions
→ US miners: $0.05-0.07/kWh
→ Nordic miners: $0.02-0.04/kWh
→ Middle East: $0.01-0.03/kWh
📊 COMBINE WITH ON-CHAIN DATA
→ Miner Net Position Change (selling pressure)
→ Hash Ribbons (miner capitulation indicator)
→ Difficulty Ribbon (hash rate compression)
→ Puell Multiple (miner revenue extremes)
🎯 MULTI-TIMEFRAME CONFLUENCE
→ Weekly chart: macro trend and cost support
→ Daily chart: precise entry/exit near cost
→ 4H chart: short-term reactions at cost levels
🌐 CORRELATION TRADING
→ Miner stocks (MARA, RIOT, CLSK) vs BTC cost
→ When BTC < cost, miner stocks typically -30-50%
→ Energy prices (oil, nat gas) affect mining costs
═══ LIMITATIONS & CONSIDERATIONS ═══
⚠️ AVERAGE COST, NOT ACTUAL
• Large miners with PPAs have costs as low as $0.02-0.03/kWh
• Inefficient miners may have costs 2-3x the average
• This shows network-wide average for reference
⚠️ ELECTRICITY PRICE ASSUMPTIONS
• Static periods vs. dynamic energy markets
• Renewable energy % growing = lower average cost over time
• Geographic distribution matters (Texas vs. Kazakhstan)
⚠️ DOESN'T INCLUDE
• ASIC efficiency improvements (more hash/watt)
• Stranded energy and flare gas mining
• Government subsidies or penalties
• Seasonal variations (wet/dry seasons)
⚠️ LAGGING INDICATOR
• CBECI data updates every ~14 days
• Historical data, not forward-looking
• Cost always rises, but at variable rate
═══ DISCLAIMER ═══
This indicator visualizes Bitcoin's estimated global average production cost based on publicly available electricity consumption data and modeled pricing assumptions. It does NOT:
• Guarantee future price movements or bottoms
• Account for individual miner profitability variations
• Include all operational costs (simplified to electricity %)
• Predict miner capitulation or selling pressure
• Constitute financial advice or buy/sell signals
Production cost is A REFERENCE POINT, not a hard floor. Price can and has traded below cost during extreme capitulation events. Market liquidity, macro conditions, and sentiment often override cost-basis logic in the short term.
Always conduct your own research and use proper risk management.
📚 EDUCATIONAL USE ONLY | NOT FINANCIAL ADVICE
═══ RESOURCES ═══
Cambridge Bitcoin Electricity Consumption Index (CBECI)
→ ccaf.io/cbnsi/cbeci
Bitcoin Mining Economics
→ insights.braiins.com/en/
Block Reward Halving Schedule
→ bitcoinblockhalf.com/
Difficulty & Hash Rate Charts
→ blockchain.com/charts/difficulty
Understanding ASIC Mining
→ academy.binance.com/en/articles/what-is-an-asic-miner
Mining Profitability Calculator
→ coinwarz.com/mining/bitcoin/calculator
On-Chain Miner Metrics
→ cryptoquant.com/
Energy & Mining Data
→ hashrateindex.com/
═══════════════════════════════════════════════════════════
Built for the Bitcoin community 🚀
Because understanding the cost of production is fundamental analysis 💎
═══════════════════════════════════════════════════════════ 지표

지표

지표

Market Impact Calendar📌 Monthly economic-impact calendar with daily scoring, trading-session weighting, DST schedules, and a synthetic market bulletin.
▌WHY THIS INDICATOR IS USEFUL
Market Impact Calendar was designed for a simple purpose: not just to display economic releases, but to help estimate their potential weight on a trading day.
Instead of a simple news list, the indicator provides a more structured reading:
- a monthly calendar directly on the chart,
- a daily impact score,
- weighting based on your own trading sessions,
- integration of special US market days,
- daylight saving time (DST) schedule information,
- and a bulletin mode to summarize the selected day quickly.
The goal is not to predict the market, but to provide a visual decision-support tool helping traders identify whether a day looks calm, moderate, or sensitive.
▌CREDITS & TECHNICAL BASE
This indicator uses the public Pine libraries “forex_factory_decoding” and “forex_factory_utility” from the original open-source work by toodegrees, based on Forex Factory data handling.
The main script, calendar logic, scoring system, interface, bulletin logic, trading-session weighting, special US day handling, and DST integration were developed in this version by E2PZ Continuum.
▌WHAT THIS INDICATOR DOES
The indicator processes economic releases through the imported libraries, then reorganizes them into a market-impact-oriented structure:
- classification of releases by time segment,
- grouping by day,
- filtering by impact level,
- weighting based on the related currency,
- weighting based on your trading hours,
- optional bonuses for major event types,
- final synthesis into a daily score and visual calendar display.
Each calendar day is therefore simplified into an operational reading:
- green = generally light day,
- orange = moderately sensitive day,
- red = potentially heavier or riskier day.
▌WHAT MAKES THIS VERSION ORIGINAL
This indicator is not a simple repackaging of raw economic data.
Its added value comes from:
- a full monthly calendar view directly displayed on the chart,
- a trading-oriented daily impact score,
- custom weighting through up to three trading-session levels,
- integration of US holidays, special days, and partial closes,
- DST information displayed in tooltips,
- manual navigation by day / month / year,
- a “Bulletin” mode turning the selected day into a readable editorial summary,
- bilingual English / French interface support,
- and a user-oriented reading logic designed to help decision-making rather than simply listing releases.
▌HOW TO USE IT
1. Choose whether to display the calendar, the bulletin, or both.
2. Select your timezone.
3. Configure your primary, secondary, and tertiary trading sessions.
4. Select which news impact levels should be included.
5. Navigate through the month or manually select a specific day.
6. Use Bulletin mode if you want a more narrative summary of the selected day.
Quick reading:
- a colored cell gives a visual estimate of the day’s sensitivity,
- the cell tooltip details time windows, related currencies, and major events,
- the information bar or bulletin summarizes the selected day.
▌MAIN SETTINGS
CALENDAR / BULLETIN
Displays the monthly calendar, the editorial bulletin, or both at the same time.
TIMEZONE
Converts displayed times into the selected timezone.
TRADING HOURS
Lets you define up to three personal trading windows.
Releases occurring inside these windows do not receive the same weight in the daily score.
NEWS FILTER
Selects which impact levels are used in the calculation and display.
SELECTION
Lets you manually browse a specific day, month, or year.
LANGUAGE
Switches between English and French display.
ADDITIONAL MARKETS (DST)
Adds optional markets to the schedule information shown during clock changes.
▌HOW THE SCORE SHOULD BE INTERPRETED
The daily score is a synthetic estimate.
It is not an absolute truth about future volatility.
It combines multiple elements:
- release importance,
- related currency,
- release timing,
- proximity to your trading sessions,
- clustering of multiple releases on the same day,
- and the context of special US market days.
This means that a red day does not guarantee strong volatility, and a green day does not guarantee a quiet market.
▌WARNINGS & LIMITATIONS
This indicator depends on an external source related to economic releases.
Like any third-party source, it may occasionally be delayed, incomplete, or partially updated.
The displayed score remains an internal estimate.
It helps rank days, but it does not replace personal analysis or manual verification of important releases.
Some future dates may remain neutral until the source has published the corresponding weekly data.
This indicator is designed as a preparation and decision-support tool, not as an automatic entry or exit signal.
▌USE CASES
This indicator can be useful to:
- avoid trading blind on sensitive macro days,
- quickly identify high-density economic days,
- adjust vigilance according to your trading session,
- prepare your week or your session in advance,
- filter days that look calmer or more sensitive.
▌SUMMARY
Market Impact Calendar aims to transform a raw flow of economic releases into a structured, visual, and operational reading for traders.
The goal is not just to see the news.
The goal is to better understand when a day deserves more attention — and why. 지표