 Short
Short
 Short
Short
 Short
Short
 Short
Short
 Short
Short
 Short
Short
 Short
Short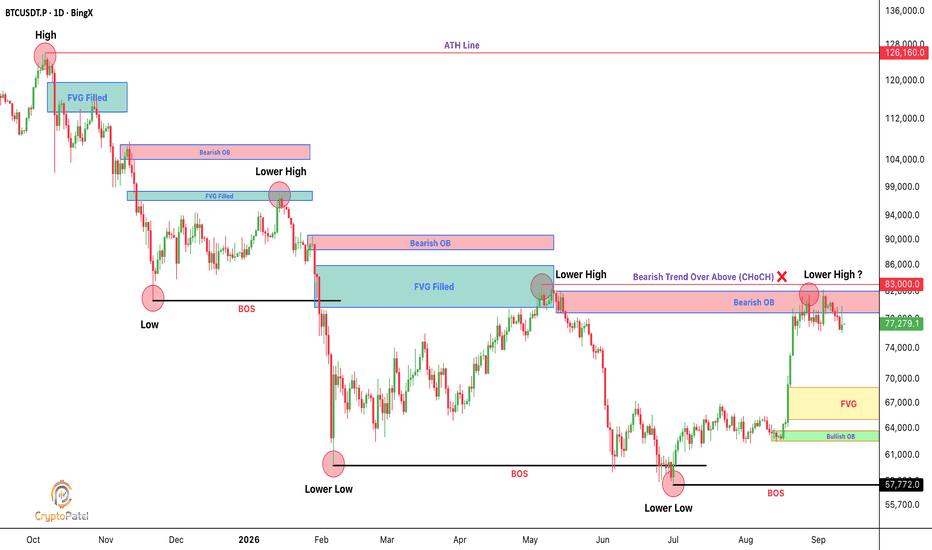
 Short
Short
BTCUSD - On the possible collapse and the utility of Public ChatIll be quick with BTC, it had 2 different scenarios but since the move happening right now, bearish is probably the one that won
What could invalidate the bearish view is, besides and before an higher high (so above 82.8), a fast pump to 78.6+ or 80+ with a strong momentum, basically the total opposite of today
But with what I monitored the last 2-3 weeks, to me the game is already set, no need to check on low timeframe what could happen in short term. This structure is not a bull flag, it is controlled distribution that will result in a Bart move
(BTW whatever happens with BTC, shorting XRP is even safer)
A probable Lower low (sub 58) is coming and probably a lot of ppl are not prepared for this
Next week will decide if im super right or total wrong :) Will keep this post updated
Im publishing this idea now but as you can see I was already talking about this last 2/3 weeks (in public chat and also with my last XRP post), making this idea just a follow through of something I had in mind. Public chat helps me getting those ideas, and sublimate them. It gives me confidence. This community, I will call it the Community of the Public Chats, can review your post. Most of the engagement I get come from sharing those ideas on the Crypto chat.
There are very nice calls there and also a lot of very bad one but I would have probably lost everything without this chat. I think it started the same way for a lot of people, first you just invest and then you too scared to loose it all, and you want to earn more and faster, so you try to understand where could be the best place to leave and enter. I’ve lost a lot sometimes but I’ve never been fully liquidated since im active in Public Chats.
Chats has to be modded of course and sometimes its just a very cringe circus. I’ll probably never meet someone from TV, cause I’m total opposite of this capitalistic degeneracy but I’m now way more efficient than ever and only because of Public Chat.
Only posting ideas doesn’t allow this kind of intimacy and reflexions you can get with other people.
A few years ago I would have fomo the 82 like a crazy bull I can be. And I would definitely not been able to make call like I do now.
At some point someone gifted me a premium sub and I decided to keep it.
That is money for you.
If I have a question regarding TV I prefer to ask it directly to the chat than doing a ticket support.
Saying chat is outdated is pretty funny and ironic when most of your links are dead, most of your videos dont work anymore with the actual TradingView and your chat assistance is useless.
And this is just a glimpse.
I’m not shocked about the news im just a bit sad/melancolic and I think this is not a smart decision. It was pretty pretty obvious and some people warned us the last few years (they were probably very good traders or insiders). Won’t change a lot for me but there is always something to learn.
Thank you for your time,
Cheers and this is not a financial advice
Short 
LAPTOP: $401B FDV to $352M in 48H | Liquidity Trap BreakdownLAPTOP: $401B FDV to $352M in 48 Hours | Liquidity Trap Breakdown
Chart setup:
KuCoin LAPTOP/USDT (it carries the most volume), 1H timeframe, Log scale on. Draw horizontal lines or boxes at $401.12 (ATH), $37.26 (open), a $3.70 to $4.47 zone, $1.00, a $0.69 to $0.80 supply box, and $0.3378 (ATL), with a label for each.
Short (bearish bias only; the description warns against shorting a thin book)
$LAPTOP just delivered one of the most extreme launch collapses in meme coin history.
$401B FDV on paper → $352M FDV in 48 hours. That's -99.91%.
This idea breaks down why it happened, where price stands structurally, and the levels that matter from here.
1. THE LAUNCH: A VALUATION WITHOUT LIQUIDITY
• Launched Sept 9, 2026 on Base
• Issued by Phoenix Veritas Foundation, fronted by Hunter Biden
• 1B total supply, 350M circulating
• Opened near $37.26 and printed an ATH of $401.12
• The pool behind that print held under $50K
• Lost ~99% within the first hour, flushing to ~$3.70
FDV is price × total supply. It is not money invested. A few trades in a thin pool can print any valuation you want. $401B on paper, $50K in the pool.
2. CURRENT MARKET DATA
• Price: $0.3528
• Market cap: $123.51M (-41.68% in 24h)
• FDV: $352.88M
• 24h volume: $16.99M (-63.54%)
• Holders: 31.54K
• 24h range: $0.3378 to $0.6925
• ATL: $0.3378 (printed today)
3. TECHNICAL STRUCTURE
Tip: switch to Log scale. On a linear chart, everything after the first hour looks like a flat line, which hides the real structure.
Market structure: bearish. Price keeps printing fresh all-time lows and has not reclaimed any prior support. With only ~48 hours of history, there is no higher-timeframe structure and no historical demand below current price.
Key levels:
🔴 $3.70 to $4.47: first-hour flush low and heavy launch-day distribution zone
🔴 $1.00: psychological level, far above current price
🔴 $0.69 to $0.80: supply zone. This is broken former support, capped by today's 24h high
⚪ $0.3528: current price
🟢 $0.3378: ATL and the only reference support
⚫ Below $0.3378: price discovery, with only psychological levels at $0.30 and $0.25
Liquidity view: sell-side liquidity rests below the $0.3378 ATL. In a book this thin, a sweep of that low is common before any meaningful relief bounce.
4. SCENARIOS
Bearish (primary): If price is accepted below $0.3378, it enters price discovery toward the $0.30 and $0.25 psychological levels.
Relief (invalidates the bearish bias): Price reclaims and holds above $0.80 with rising volume, opening a test of $1.00. Right now volume is down 63% in 24h, so there's no sign of this yet.
Execution warning: Kraken shows only $4,901 of buy orders within 2% below price. A ~$5K market sell can move that market 2%. Expect violent wicks in both directions. Stops will get hunted, and shorting a book this thin carries real squeeze risk.
5. LIQUIDITY AND SUPPLY RISK
• Total liquidity is ~$2.06M, only 1.67% of market cap
• KuCoin alone carries 43.79% of all volume
• ~23M tokens (2.3% of supply) went to market makers at launch, with some delivered days before trading opened
• One market maker wallet sold ~466K tokens for ~$2.08M at an average of $4.47
• Founder unlocks start around March 2027: 12.5M tokens per month for 24 months
• At today's price, one month of unlocks (~$4.4M) is about 2x the entire current liquidity
• 10% of supply is reserved for a future airdrop at the foundation's discretion
6. TOKENOMICS
• Founders: 30% (6-month lock, then 24 months vesting)
• Prediction pool: 30% (burned or sent to charity based on 30 real-world events)
• Day-one airdrop: 10%
• Future airdrop: 10%
• Liquidity: 10%
• Foundation treasury: 5%
• Charity: 5%
The official docs describe LAPTOP as having no utility, no ownership rights, no voting and no yield. Price runs on attention alone, and the attention is fading.
7. THE FAIR SIDE
✅ Tokenomics were published before launch
✅ Founder tokens are locked in Coinbase Custody (per team)
✅ No presale, no VC round, no influencer allocations (per team)
✅ Liquidity has grown from under $50K to ~$2M
✅ Market maker allocations are standard practice, and MM selling isn't automatically dumping
✅ The team says nobody on their side sold and blames sniper bots and thin launch liquidity
Still, bots sniping thin pools is a known risk on every launch. A sub-$50K pool for a token with this much attention was a planning failure, not bad luck.
8. VERDICT
• Concept virality: ✅
• Tokenomics transparency: ✅
• Launch execution: ❌
• Liquidity planning: ❌
• Utility: ❌ (zero, by design)
• Structure: ❌ bearish, at ATL
• Risk level: EXTREME 🔴
LESSONS
• Launch FDV is a number, not money. Check liquidity and order book depth first.
• Never chase the first candle of any celebrity or political coin.
• Watch who receives tokens before you can buy.
• Verify the contract address. Copycat LAPTOP tokens exist on other chains. The official one is on Base, starting 0xB095 and ending b6ec29.
• Never hold too much, book profit, and never fall in love with any coin.
$401B on paper. A $5K sell moves the price. The chart did the math.
Educational Only. Not Financial Advice. ALWAYS DYOR.  Short
Short
Gold Today Outlook |Key Level MARKET STRUCTURE
Gold is trading around $4,345–$4,355 after bouncing from ~$4,301. The short-term recovery remains corrective, with the weekly structure still bearish below $4,400–$4,440.
KEY LEVELS
Support: $4,300 → $4,282
Resistance: $4,361 → $4,400–$4,443
Sell Zone: $4,390–$4,443
Buy Zone: $4,282–$4,305
A break below $4,315–$4,300 could open further downside. A confirmed reclaim above $4,443 would weaken the bearish setup.
DXY & YIELDS
DXY is holding around 99.05, while the US 10Y remains near 4.95%. Elevated yields continue to create downside pressure on gold.
MACRO & FED
US CPI is the key catalyst today.
Hot CPI → stronger hike expectations → bearish for gold.
Soft CPI → lower rate expectations → bullish recovery.
The market is currently pricing around 70% odds of a 25bp hike on Sep 16.
GEOPOLITICAL RISK
US-Iran tensions and oil near $100–$108 Brent continue to support safe-haven demand, but higher oil-driven inflation is increasing Fed-hike pressure.
TRADE BIAS
Bearish: 62% | Bullish: 38%
Confidence: Medium
Gold remains bearish-leaning while below $4,400–$4,443.
Next major catalyst: US CPI — 12:30 UTC
Then: FOMC — 16 September
Not financial advice. Manage risk carefully.


