GM — Bearish Deep Harmonic CrabGM is sitting at an interesting level where a Bearish Deep Harmonic Crab is forming on the weekly chart. Price has pushed higher into the reversal area, but there are a few things on this chart that make me question how much strength is left in the move.
Trade Setup
Entry: $94.00
TP1: $68.50
TP2: $55.00
TP3: $39.00
TP4: $31.00
The blue trendline is the key confirmation for this setup. I don't want to short GM simply because it reaches the harmonic area. The bigger confirmation would come from
Bearish Gartley
TJX — Bullish Deep Harmonic PatternTJX is now trading into a Potential Reversal Zone created by a Bullish Deep Harmonic pattern. After the recent selloff, this area could provide a good opportunity for a bounce.
I’m not looking to jump in blindly at the PRZ. There are two levels I want to see break before getting more confident in the setup.
The Two Confirmation Levels
Yellow Trend Line:
This is the first important level. TJX has been trending lower along this line, so a break above it would be a good sign that the selling pre
/CL: Bearish Deep Gartley and Bearish Shooting Star Confirmed/CL seems to be furthering it's RSI Bearish Divergence as the price-action prints a Hanging Man followed by a Bearish Shooting Star, confirming an .886 entry for a newly developed Bearish Deep Gartley. This can serve as a good secondary entry against Oil, Market Volatility, and the DXY which may likely lead to a bounce in SPX, BTC, ETH, and perhaps Silver as detailed here:
I will be careful with gold and silver and SPX as those aren't exactly fixed assets not even Gold and Silver. The producti
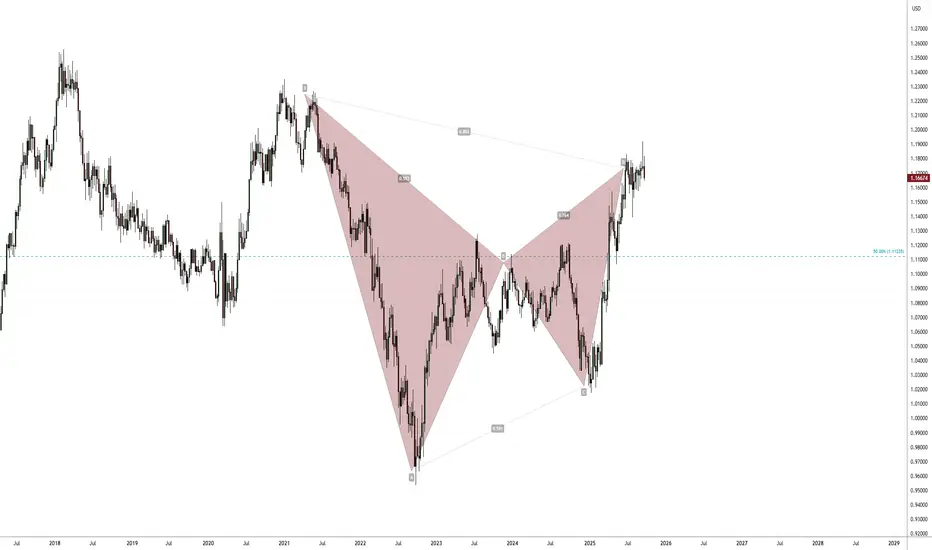
The Gartley at play? EUR/USD making a move...I have been building short positions since end of June/early July based on my original trade idea (which is still open)
....However, I noticed a potential harmonic pattern on the weekly about 3 weeks ago and this strengthened my conviction to keep and add additional shorts when we consolidated around the 1.1800+ price zone.
Although I am a chart pattern trader, I'm not a traditional harmonic trader but certain price action stands out to me and this looks like one playing out.
If this does qu
Two reasons to sell FTSE Right NOWWe are seeing some reasons to sell FTSE right now.
1) The daily trend is down.
2) H4 is pointing down, but the price is above the MA
3) There are two patterns to sell at the current level
4) 8165 is the last weeks high that will be a good resistance
Hoping for a test of last week's lows.
BTC Bearish GarleySummary of Confluences
Trade Setup Long Trade (Buy at C)
Key Confluences
✅ Fibonacci 0.618 - 0.633 Retracement (XA Leg)
✅ Weekly FVG Support
✅ Market Structure Pivot & Liquidity Grab
Short Trade (Sell at D)
✅ Bearish Gartley Completion (1.27 - 1.3 Fib Extension of BC)
✅ Anchored VWAP from ATH (Resistance)
✅ Bearish Order Block & Supply Zone
1. Long Trade Setup (From C to D – Bullish Move within the Gartley)
🔹 Trade Type: Counter-trend long (buy from C to D).
📌 Entry Criteria:
Buy
XRP - Bearish Gartley Pattern (Long & Short Positions)Confirmation:
Market Structure: The chart highlights a first weekly lower high and first weekly lower low, reinforcing a bearish trend.
Daily Fair Value Gap (FVG): Could serve as an additional target for the price.
Risk-to-Reward Ratio (RRR): The trade appears to have a favourable RRR, with an optimal entry around D.
1. Long Position (Counter-Trend Trade from C to D)
Trade Setup:
Entry: At point C, around the 0.882 Fibonacci retracement level.
Stop Loss: Below point A, ensuring protec
Shorting the S&P at 6000We previously picked the turning point of the S&P at the all time high.
We now expect this to continue with the downtrend as it approaches the strong 6000 resistance.
1) There is pattern
2) H4 and D1 are down
3) M15 is overbought, awaiting divergence
We target the low of 5915 which will give a 1:2.5 R:R
USDJPY with a 2.95 Profit Factor on the 1-Hourly ChartI’m keeping a close eye on USDJPY right now, and here’s why:
- High Profit Factor : Target 1 offers a whopping 2.95 Profit Factor, which is quite attractive.
- Timing : Even though NFP is coming up tomorrow, this trade is on the 1-hourly chart. It’s possible that price action could reach my first target or meet the criteria that allows me to shift my stop to entry, thus achieving a risk-free trade, before the big event.
Key Points to Remember:
- Volatility Alert : NFP can cause sudden ma
Market Scenario and Potential Buying OpportunitiesAnalysis of Key Support Levels and Candlestick Pattern Confirmation
The financial markets are often characterised by their volatility and the constant ebb and flow of prices. In this intricate dance, key support levels play a pivotal role in determining the direction of market movements. This aims to provide an in-depth analysis of the current market scenario, focusing on two significant support levels, $2,378.36 and $2,327.67, and the potential buying opportunities that arise should the marke
BEARISH PRESSURE ON BTC to 56,282.5 priceGood afternoon traders,
Trust you are doing great.
Please find below my outlook on this cryptocurrency, BTCUSD.
Type: Emerging Bullish Gartley
Completion Point (D):
Projected at approximately 56,282.5
Consider short positions as the pattern approaches this level.
Potential Reversal Zone (PRZ):
Range: 56,282.50 to 56,036.69
I expect to close short trades within this zone, anticipating a bullish reversal.
Target Levels:
These are my potential targets
T1: 57,487
T2: 56,935
T3: 56,282.50
These
TSLA four-hour chart shows a potential Gartley harmonic.NASDAQ:TSLA is forming a potential bearish Gartley on the four-hour chart, which would result in bullish price action on the C to D leg, as long as point C on the chart holds. Point C on the chart also corresponds to the daily 200 SMA, and is right above the psychological $200 level, which adds confluence to the long entry at $202.50.
AUDUSD M15, Intraday TradeI just shorted AUDCAD, Bearish 5-0 Pattern on the 1-hourly chart, and now AUDUSD on this Bearish Gartley Pattern.
It seems like the Australian dollar may have a bearish movement for the next couple of hours.
If you have been following, you should know I don't usually trade on the M15 chart, but this one has an upsize trade component.
What is an upsize trade?
An upsize trade is a trading setup that allows me to stretch my final target to the next pattern completion. It's a Trade Management ski
GBPUSD Sideways Consolidation and Potential Breakout MovesGBPUSD is currently in a sideways consolidation on the 1-hourly chart, presenting a potential for an expansion move or breakout in the coming week. Should the market break out to the upside, there are two potential shorting opportunities to consider.
Analysis:
- Sideways Consolidation: GBPUSD is in a range-bound phase on the 1-hourly chart.
- Potential Breakout: Watch for an expansion move.
Shorting Opportunities:
Traditional Resistance Level:
- Level: 1.2662
Strategy: Look for Magic Candle Co
Technical Analysis of GBPAUD: Bearish Gartley PatternHello traders,
Happy new week to you all.
Allow me to quickly do a detailed analysis of a pattern I identified on the GBPAUD currency pair, called bearish Gartley. I believe in the concerted might of Elliott wave and Harmonic patterns.
The Bearish Gartley pattern is a harmonic pattern that signals a potential reversal in price from bullish to bearish. This pattern consists of four price movements and five points: X, A, B, C, and D. In my GBPAUD analysis today, I noticed the following points:
Comprehensive Analysis of the Gartley Harmonic PatternThe Gartley Harmonic Pattern, a cornerstone of harmonic trading, was first introduced by H.M. Gartley in his 1935 book "Profits in the Stock Market." This pattern leverages Fibonacci retracement levels and geometric price formations to identify potential market reversals, providing traders with a strategic edge.
__________________________The Bullish Gartley Pattern___________________
Structure:
X-A Leg: The initial upward movement.
A-B Leg: A retracement of approximately 61.8% of the
EURUSD Analysis: Support & Resistance TradingKey Levels (1-hourly chart):
- Resistance: 1.0669
- Support: 1.0630
Additional Setup (4-hourly chart): Bullish Deep Crab & ABCD Patterns at 1.0522
Analysis:
- Approach: Identifies potential shorting and buying opportunities based on support & resistance levels
- Key Levels: Highlights resistance at 1.0669 and support at 1.0630 on the 1-hourly chart
- Alternative Setup: Considers a more favorable buying opportunity at the convergence of Bullish Deep Crab & ABCD patterns at 1.0522
A Han Seng Index Trade Early Monday morning Hello everyone,
The markets are slightly ruffled lately and there is an opportunity to short HS50 on Monday.
Trend:
W1: Up
D1: Down
H4: Down
Moving Average:
Below the Daily MA
H4 pointing downwards
Pattern:
Gartley on M15
Strong resistance at 16450.
Target is 16000
Double top on H1 and lots of divergence
Stop loss of 40 pips and a target of 120.
EURUSD Analysis: Shorting Opportunities Await- Trade Bias: Bearish
- Key Factors: Interest rate differentials favor USD over EUR
- Trade Plan: Looking for shorting opportunities
Analysis:
- Importance: Emphasizes interest rate expectations influencing currency movements
Trade Plan:
- Shorting Opportunity: Waiting for shorting setups
- Potential Entry: Bullish Deep Crab Pattern completion at 1.0520
Insights:
EURUSD remains bearish due to interest rate expectations. Shorting opportunities are favored until there's a clear
SOXL: Logscale Bearish Gartley at Trendline ResistanceSOXL has reached the Logscale 0.886 of this potential Logscale Bearish Deep Gartley which aligns with the upper trendline of the channel it has been trading within. If it plays out, I think we could see SOXL come down to the lower trendline and perhaps even lower. This May be sparked by a selloff in NVDA and AVGO.