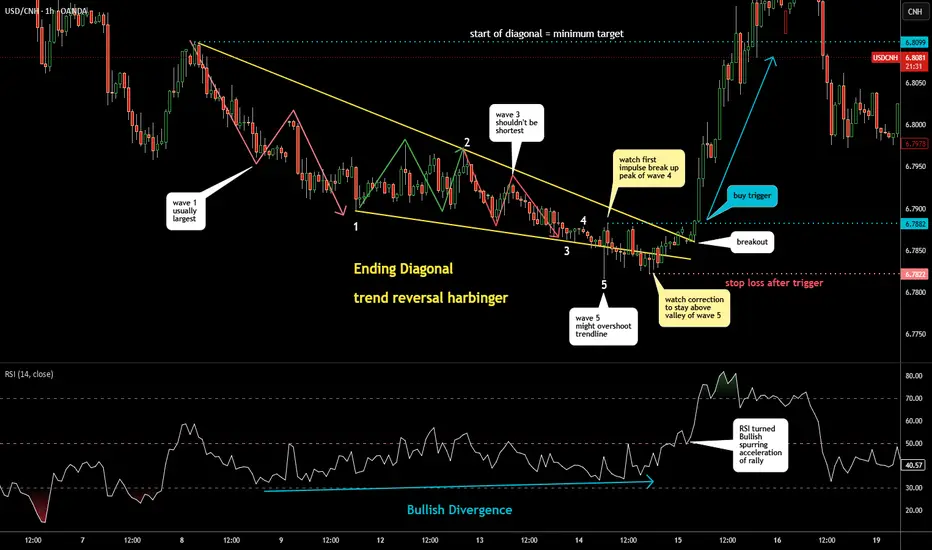
How to trade Ending Diagonal: Visualisationthis is my most favorite EW pattern
it is called Ending Diagonal
it appears at the very end before trend reversal
it consists of 5 waves down (white labels) but each of waves
are not regular 5-wave sequences but 3-wave ABC structures
zigzags of red and green colours show it
wave 1 is usually the largest - it is in the chart
wave 3 should not be the shortest - and it is not in the chart
wave 5 is the smallest and sometimes overshoots the trendline support like we see
in the chart
How to trade
Ending Diagonal
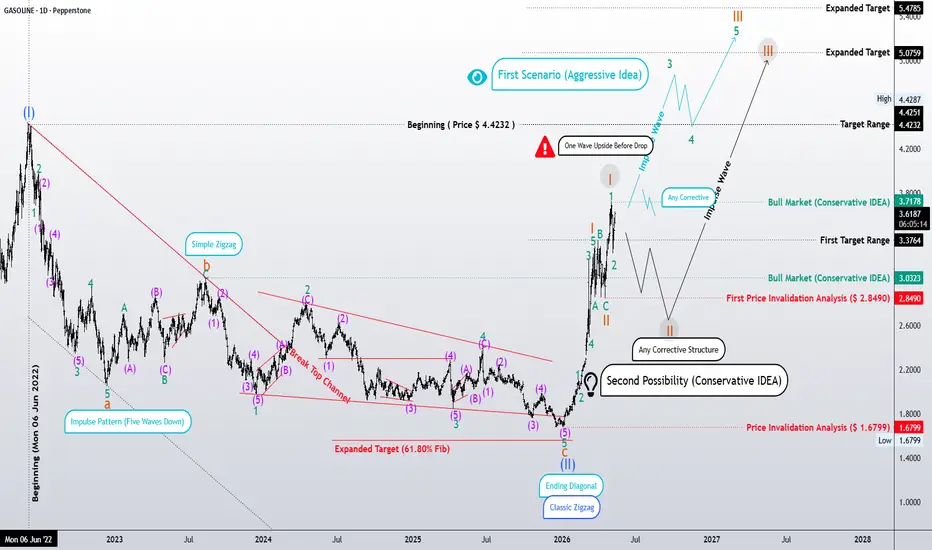
GASOLINE Daily Elliott Wave UpdateGASOLINE topped out at 4.4232 on Mon 06 Jun 2022 and then started dropping.
The decline looks like a classic three-wave corrective zigzag, and wave © formed an ending diagonal.
The structure finished around the 1.6799 invalidation level — so, based on the data from the chart, both scenarios you’re watching are now invalidated.
Pay close attention: wave © broke out of the corrective channel.
In patterns where wave (A) is sharp (impulsive-like), wave © often ends up building an ending diagonal
ETH 1H: Ending Diagonal + SFP + Bear Div Short 3.71RETH/USDT 1-hour short. Bybit perpetual. Trade closed.
Ending diagonal compressed into a swing failure pattern at 2,400. Bearish divergence printing on the oscillator as price made the final push into the high. Three signals announcing the same thing simultaneously. CHoCH confirmed the structural hand-off and the short triggered at 2,400.85.
Stop at 2,430.62. TP hit at 2,306.63.
3.71R delivered.
The divergence was the third confirmation layer. Price printing a higher high while momentum print
Tesla: Bullish Structure Still Intact After 30% PullbackTesla (TSLA) has experienced a sharp pullback of nearly 30% from recent highs, yet the internal structure of the decline does not currently appear impulsive. Instead, price action continues to resemble a corrective phase rather than the start of a sustained bearish trend.
The updated wave analysis points toward a potential seven-swing corrective structure, which is typical of complex consolidations within larger uptrends. This retracement is approaching the 50% to 61.8% Fibonacci zone measured
XAUUSD 4H — Ending Diagonal Update: TP1 & TP2 Done, TP3 CloseFollow-up to the ending diagonal breakdown published four days ago.
The original thesis: rising wedge rejection at the 0.118 Fibonacci level, breakdown through wedge support, three structural targets mapped from the distribution.
The update:
TP1 at $4,725 — reached and now acting as resistance confirmed.
TP2 at $4,690 — reached. Structural support level did not hold.
Current price: $4,635. Below both targets, above TP3.
TP3 at $4,575 remains the macro retracement target. With TP2 now broken,
XAUUSD 4H — Ending Diagonal BreakdownPrice completed a rising wedge / ending diagonal structure
off the April lows and rejected cleanly at the 0.118 Fibonacci level.
The breakdown through wedge support confirmed distribution.
Three targets mapped from structural logic:
TP1: $4,725 — first demand zone, now acting as resistance
TP2: $4,690 — structural support and range low
TP3: $4,575 — macro retracement target if TP2 fails to hold
Current price: $4,709 — holding between TP1 and TP2.
Invalidation: reclaim and close above $4,855
XAUUSD 4H — Ending Diagonal at $4,880. RSI & OBV DivergenceGold has been telling the same story as BTC and ETH this week. Just on a different instrument.
Price pushed into the $4,880 liquidity level, printed an ending diagonal at the highs, and rejected. Three confluences were already visible before the reversal.
RSI bearish divergence. Price made a higher high into $4,880. RSI made a lower high. The momentum behind the move was not there. That divergence was the first warning.
OI declining on the final push. When price is reaching for new highs and
ETH Trade Alert - Bearish ImpulseCRYPTOCAP:ETH Trade Alert - Bearish Impulse
BITSTAMP:ETHUSD Summary:
BBG:ETHEREUM ( BINANCE:ETHUSDT ) Bearish Impulse pending.
ETH Sell Positions in focus.
Technical Analysis - BBG:ETHEREUM Signal
Chart Structure:
- Flat Correction
- Wave (4) Completion
- Bearish Divergence
- Ending Diagonal
BTC Prediction:
- Bearish Impulse
- Intermediate Wave (5)
BBG:ETHEREUM ( BINANCE:ETHUSDT ) Trade Levels
- Ticker: ETH/USD
- Direction: SHORT
- Market Entry @ $2350
- Strategic Entry 1 @ $2
Arbitrum finishing wave C of Expanding Flat for wave 4 pullback ARB wave 4 pullback almost finished in this EW scenario. wave 5 Ending Diagonal to finish out the C wave of the wave 4 expanding flat. If invalidation levels hit, it means it is expanding structure now which is rare / never preferred. Easy stop/invalidation levels to trade this both ways
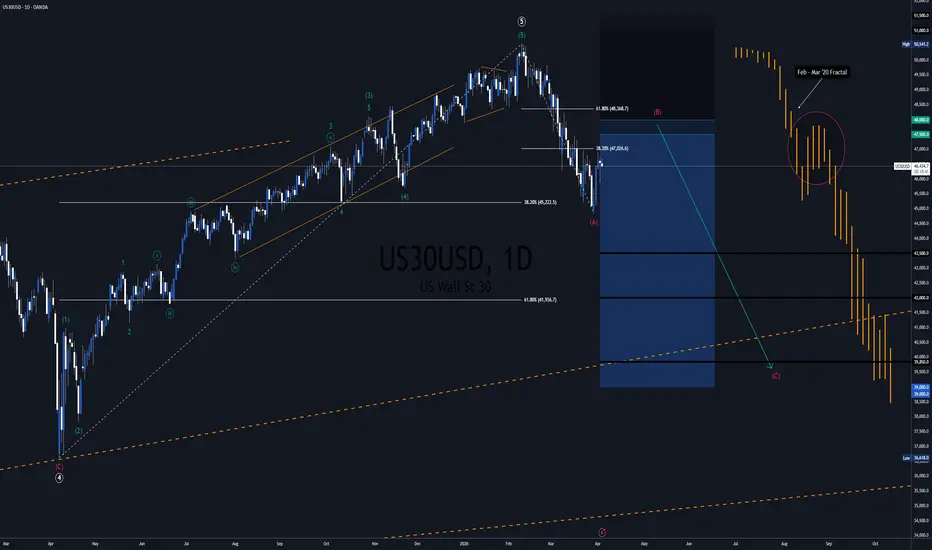
US30 Trade Signal - Bearish ImpulseCAPITALCOM:US30 #TradeSignal - #Bearish Impulse
Summary: OANDA:US30USD #Trade #Signal
- TVC:DJI #Bearish Impulse started.
- #DowJones Sell Positions in focus.
#TechnicalAnalysis: CAPITALCOM:US30 Signal
Chart Structure:
- Primary 5 Top
- #EndingDiagonal
- #Bearish #Divergence
- $USD30USD #Bearish #Fractal
#DowJones Prediction:
- #BearishImpulse
- #ElliottWavce Intermediate (C) Wave
CAPITALCOM:US30 Trade Levels
- Ticker: OANDA:US30USD
- Direction: #SHORT
- Market Entry @ $4
Nasdaq Trade Signal - Bearish ImpulseIG:NASDAQ #TradeSignal - #Bearish Impulse
Summary: PEPPERSTONE:NAS100 #Trade Signal
- OANDA:NAS100USD #BearishImpulse started.
NASDAQ:NDX Sell Positions in focus.
#TechnicalAnalysis: PEPPERSTONE:NAS100 #Signal
Chart Structure:
- Primary 3 Top
- #Endingiagonal
- #Bearish Divergence
- NASDAQ:NDX Bearish #Fractal
#NAS100 Prediction:
- #BearishImpulse
- #ElliottWavce Intermediate (C) Wave
#Nasdaq Trade Levels
- Ticker: PEPPERSTONE:NAS100
- Direction: #SHORT
- Market Entry
SPX Trade Signal - Bearish ImpulseSP:SPX #TradeSignal - #Bearish Impulse
Summary: FOREXCOM:SPX500 #Trade Signal
- #SPX #Bearish Impulse started.
- SP:SPX Sell Positions in focus.
#TechnicalAnalysis: FOREXCOM:SPX500 Signal
Chart Structure:
- Primary 3 Top
- #Endingiagonal
- #Bearish Divergence
- SP:SPX Bearish #Fractal
#SNP500 Prediction:
- #BearishImpulse
- #ElliottWavce Intermediate (C) Wave
FOREXCOM:SPX500 #Trade Levels
- Ticker: SP:SPX
- Direction: #SHORT
- Market Entry @ $6565
- Strategic Entry @ $6
DXY Trade Signal - Bullish ImpulseTVC:DXY #Trade Signal - #Bullish Impulse
Summary: TVC:DXY #TradeSignal
- #DXY Bullish Impulse started.
- #DollarIndex Buy Positions in focus.
Tech. Analysis: TVC:DXY #Signal
Chart Structure:
- #ElliottWave: A-B-C #Correction
- #EndingDiagonal Completion
- #Bullish #Divergence
- #DollarIndex #Bullish #Fractal
TVC:DXY Prediction:
- #BullishImpulse
- Intermediate (C) Wave
TVC:DXY Trade Levels
- Ticker: TVC:DXY
- Direction: #LONG
- Market Entry @ 100
- Strategic Entry @ 99.8
-
Bitcoin at $70k: Tech selloff, AI fears & the $55k riskBitcoin has dropped to the critical $70,000 psychological support, revisiting this level for the first time since November 2024. Following a massive sell-off in global tech stocks driven by fears over inflated AI valuations, risk sentiment has soured, dragging BTC down as the dollar strengthens.
In this video, we analyse the technical damage and explore two Elliott Wave scenarios that suggest a bounce is imminent—but the long-term implications differ significantly.
Key topics covered :
The t
ZEC's Last Correction Before Moon Mission?We’re Watching
Yello Paradisers! Are you ready for the last piece of the puzzle before #ZEC makes its next massive move? We've been carefully tracking this setup, and it's reaching a critical inflection point—ignore it at your own risk.
💎#ZECUSDT is currently forming an ending diagonal pattern within the C wave of an ABC correction. This structure typically appears at the end of a larger corrective phase and often signals a major reversal or the beginning of a strong new trend. As it stands, wave 4 of this d
Gold Ending Diagonal: Is the "Blow-Off" Top In? (4888 4965 Zone)The Ending Diagonal structure that has been unfolding since the July lows (3267). The recent spike to 4888 in Wave 5 displays classic "blow-off" behavior—vertical price action often seen right before a trend exhausts itself.
1. The Technical Setup (The "When") While the diagonal is technically valid right here, we are watching two scenarios to time the reversal:
The "One Last Push" (Extension): If Wave 5 isn't finished, its possible to reach a final extension cluster between 4935 – 4965 (where
Bank Of America Is Eyeing All-Time Highs From 2006Bank of America is one of the largest banks in the world, serving millions of consumers, businesses, and institutions. It has a broad mix of operations — consumer banking, wealth management, corporate banking, and global markets — which helps keep its earnings stable. The bank has been heavily investing in digital services and technology, aiming to improve efficiency and customer experience. Its size and global reach make it a key player in the U.S. and global financial system.
Bank of America
Bitcoin below 200‑day: Buy the dip or more downside?Bitcoin slid with US risk assets, and a clean break below its 200‑day average puts the 100K support in play right now.
October’s Challenger report showed the biggest monthly job cuts in over two decades, souring sentiment and knocking cryptos alongside equities as traders reassessed near‑term Fed risks.
Weak risk tone plus key technical breaks drove a second wave of selling after the early‑October crypto drawdown, keeping focus on whether 100K holds for Bitcoin.
Key drivers:
Macro shock:
DXY Is Still Bearish; Final Leg Of The Wedge Pattern?DXY Is Still Bearish, but it can be trading in final leg of ending diagonal a.k.a. wedge pattern from technical and Elliott wave perspective.
US Dollar Index – DXY made only a three-wave rise from the lows, which indicates for a correction within downtrend. So recovery can basically still be a fourth wave rally, just a bit deeper one that can still belong to an ending diagonal a.k.a. wedge pattern. Final wave “v” of 5 can be still missing, so be aware of a continuation lower within a new three
Bitcoin Reaches PRZ with Bearish Signals — Is a Drop Imminent?Bitcoin ( BINANCE:BTCUSDT ) has reached the Potential Reversal Zone(PRZ) as I expected in yesterday's post .
Bitcoin is trading in the Heavy Resistance zone($110,720-$105,820) , Potential Reversal Zone(PRZ) , and near the Resistance lines .
In terms of Elliott Wave theory , it seems that Bitcoin has managed to complete the main wave 5 with the help of the Ending Diagonal . The structure of wave 5 can be different.
Also, we can see the Regular Divergence(RD-) between Consecut
EURUSD Gearing Up for Next Leg Up – DXY Weakens After PPI MissToday, key U.S. economic indexes were released, providing fresh insights into inflationary pressures and the state of the labor market:
Core PPI m/m:
Actual: 0.1% | Forecast: 0.3% | Previous: -0.4%
Lower than expected – suggests weaker underlying producer inflation.
PPI m/m:
Actual: 0.1% | Forecast: 0.2% | Previous: -0.5%
Slight miss – overall inflation at the producer level remains soft.
Unemployment Claims:
Actual: 248K | Forecast: 242K | Previous: 247K
Slightly higher
Gold Hits PRZ with RD-! Time for Bears to Take Over?Gold ( OANDA:XAUUSD ) attacked the Resistance zone ($3,445-$3,406) once again, forming an Ending Diagonal at the top of the structure.
Although price reached the Potential Reversal Zone (PRZ) , the presence of Regular Divergence (RD-) between the last two peaks could indicate the weakening of bullish momentum .
In terms of Elliott Wave theory , we can clearly count a completed 5-wave structure , with an Ending Diagonal pattern . This supports the idea of a major correction starti
Gold Rejected at Resistance, Targets $3,305 & Below Gold ( OANDA:XAUUSD ) rose to $3,400, as I expected in my previous idea .
Gold is trading near the Resistance zone($3,387-$3,357) and has failed to break the resistance zone validly .
In terms of Elliott Wave theory , it seems that Gold has managed to complete the microwave 5 of the main wave C with the help of Expanding Ending Diagonal . It was a corrective Zigzag(ABC/5-3-5) structure .
Also, we can see the Regular Divergence(RD-) between Consecutive Peaks.
I expect Gold