Short
Short
 Short
Short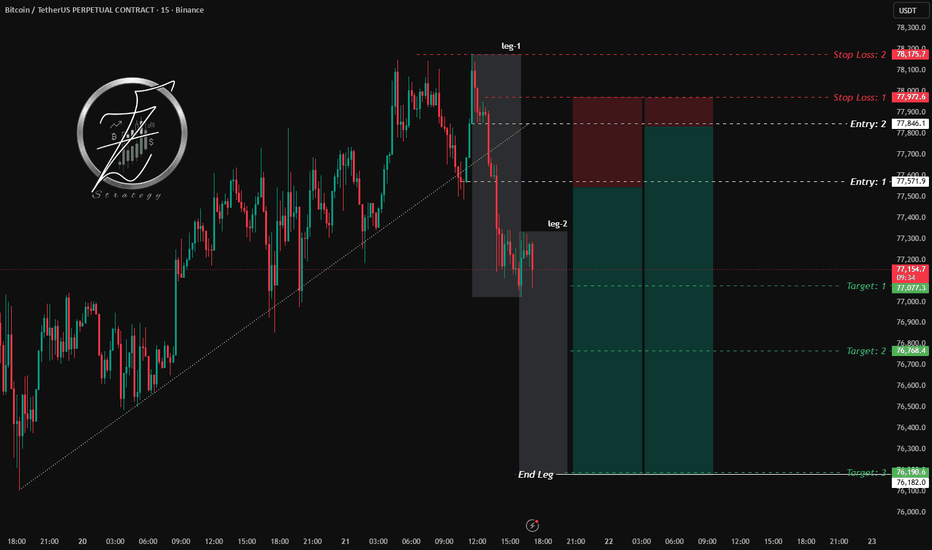
MESM May 22: 7500 first, 7540 next if support holdsMESM analysis for Friday, May 22
MESM is still trading inside a consolidation range around 7478, and for me today the key idea is whether bulls can continue defending support or whether the market starts rotating lower.
On the 4H chart, the main support level I’m watching is 7467. If I want to stay bullish, then I do not want to see a 4H candle close below 7467. If that level fails, then I think price could continue lower toward 7437 first, and then possibly into the 7400 area.
On the upside, the first level I’m watching is the overnight high at 7500. Above that, the bigger upside target is the previous all-time high at 7540.
On the 1H chart, the structure remains aligned with the 4H view, and the key intraday support is 7447. If a 1H candle closes below 7447, then I think the downside path becomes more likely.
On the 15M chart, the structure still supports the same levels, so 7447 remains one of the main intraday levels for me today.
Key levels
7500 = overnight high / first upside target
7540 = previous all-time high / second upside target
7467 = key 4H support
7447 = key 1H support
7437 = first downside target
7400 = second downside target
So for today, my plan is:
Stay constructive while price holds 7467 and 7447
Watch 7500 first on the upside
If bulls stay strong, watch 7540 next
If support fails, watch for downside into 7437 and possibly 7400
Not financial advice. No confirmation, no trade. CME_MINI:MESM2026  Long
Long
 Long
Long
Long 
 Long
Long
BTCUSDT: Bearish Drop to 63000?As the previous analysis worked exactly as predicted, BINANCE:BTCUSDT is eyeing a bearish reversal on the 4-hour chart , with price testing a downward trendline after recent highs, converging with a potential entry zone near resistance that could trigger downside momentum if sellers defend amid volatility. This setup suggests a pullback opportunity post-rally, targeting lower support levels with more than 1:4.5 risk-reward .🔥
Entry between 70000–71000 (entry from current price with proper risk management is recommended). Target at 63000 . Set a stop loss at a 4-hour close above 71500 , yielding a risk-reward ratio of more than 1:4.5 . Monitor for confirmation via a bearish candle close below entry with rising volume, leveraging Bitcoin's volatility near resistance.🌟
📝 Trade Setup
🎯 Entry (Short):
70,000 – 71,000
(Entry from current price is valid with proper risk & position sizing.)
🎯 Target:
• 63,000
❌ Stop Loss:
• 4H close above 71,500
⚖️ Risk-to-Reward:
• > 1:4.5
💡 Your view?
Is Bitcoin about to rotate back toward 63K after trendline rejection, or will bulls break resistance and squeeze shorts above 71.5K? 👇 Short 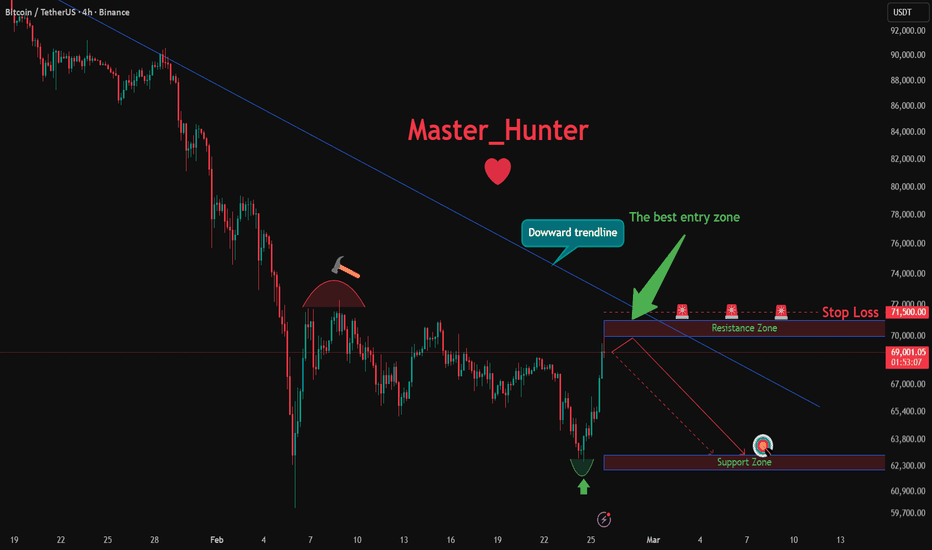
Short 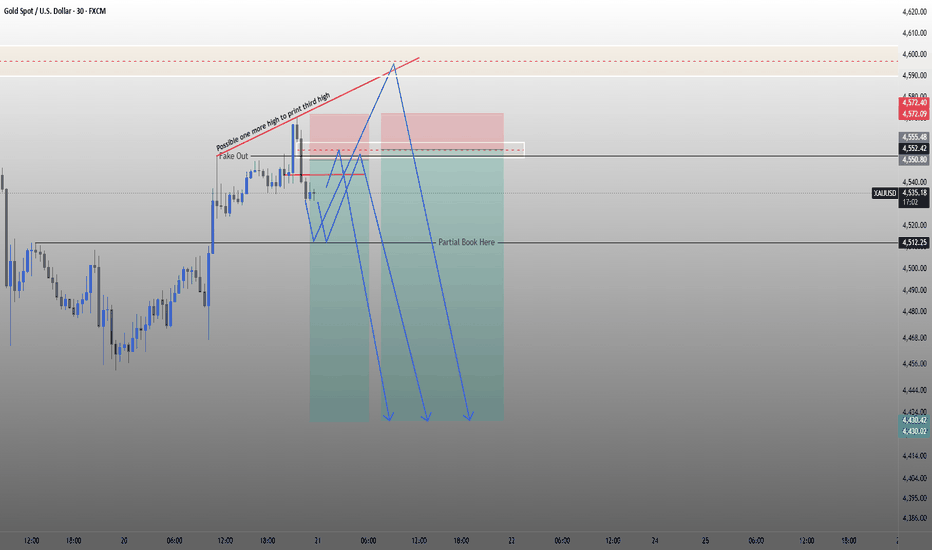
MESM May 21: Break 7470 for 7540, lose 7407 for 7377MESM analysis for Thursday, May 21
MESM is trading around 7426 and still sitting inside the overhead supply zone from yesterday. Because of that, today looks like a decision area between breakout continuation and renewed selling pressure.
On the 4H chart, the key bullish level for me is 7470. If we get a 4H candle close above 7470, then I think price could continue higher toward the previous high at 7540.
On the downside, if the current 4H candle closes below 7426, then I think sellers may start taking control again, and in that case I’ll be watching for continuation lower toward 7376.
On the 1H chart, the downside trigger I’m watching is 7407. If price starts closing below that level, then I think the move lower could extend toward the higher-time-frame support around 7377.
On the 15M chart, the structure is still aligned with the higher time frames, so for me the important range today is 7407 to 7470. Once price breaks either side, then the next move becomes more actionable.
Key levels
7470 = bullish breakout level
7540 = upside target
7426 = 4H support / weakness trigger
7407 = downside trigger
7377 / 7376 = downside target
So for today, my plan is:
Above 7470 = watch for bullish continuation toward 7540
Below 7407 = watch for downside continuation toward 7377
Stay patient while price remains inside the range
Not financial advice. No confirmation, no trade. CME_MINI:MESM2026 Long 
Short 
ServiceNow(NOW) could be entering a MASSIVE reaccumulation phaseLooking at the 2W chart of ServiceNow NYSE:NOW , I currently see what appears to be the late stage of a complex W-X-Y corrective structure.
From an Elliott Wave perspective, the correction looks mature, although I still believe price could briefly move deeper toward the ~$50 zone before a larger reversal fully confirms.
What really caught my attention, however, is the strong impulsive move from the $80 → $100 region.
To me, that is important.
Because impulsive reactions like this, especially after prolonged corrective structures, often become the first early signal that market character may slowly be changing.
At the same time, several indicators across higher timeframes are beginning to show large bullish divergences — particularly momentum-based indicators such as RSI and MACD.
Historically, these kinds of divergences often appear during late-stage corrective phases and near important long-term bottoms.
What makes this setup interesting is the combination of:
* a mature W-X-Y structure,
* improving momentum,
* bullish divergences,
* and the emergence of impulsive price behavior.
If this scenario continues developing constructively, I believe NYSE:NOW could fully recover the broader decline and eventually build the structure needed for a new ATH cycle.
Long-term, I would not underestimate the possibility of a move toward the $300 region over the coming years. 📈
 Long
Long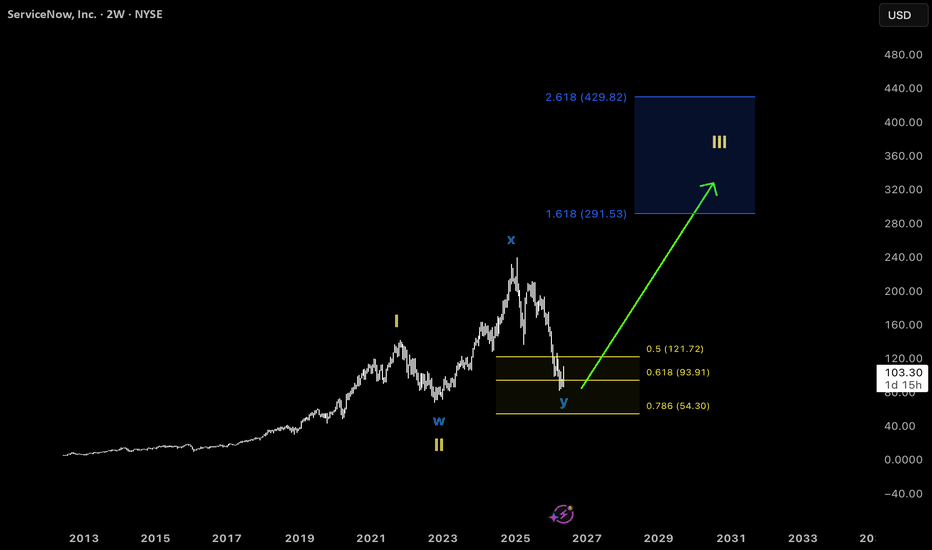
Short 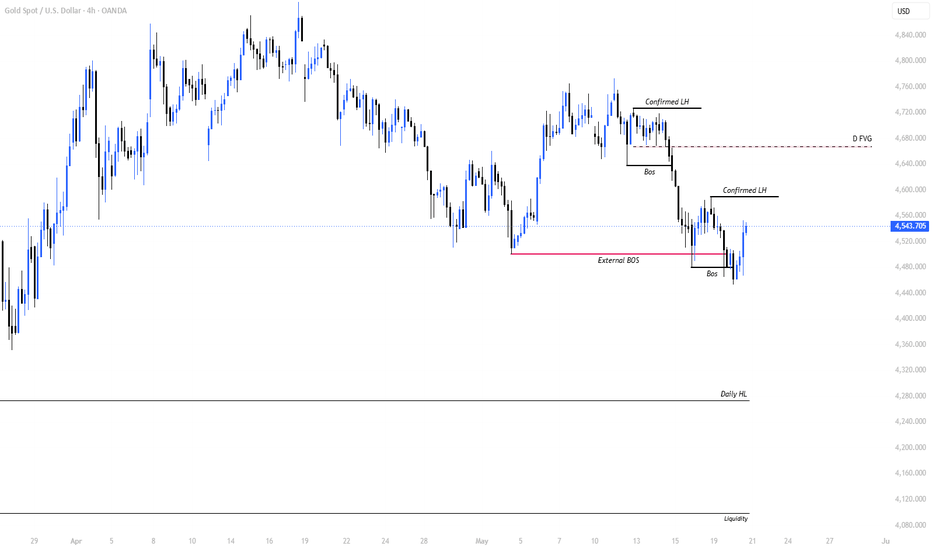
FOMC Repair Into Supply — The Retest Decides
Gold is trying to repair after the FOMC window, but this is not a clean “buy anything” chart. The move is constructive, the dollar and U.S. yields are softer, and futures are trading above spot — but the higher-timeframe structure still demands proof. The key question for the next session is simple: does gold accept above the first resistance shelf, or was the rally only a repair into supply?
My base read is that XAUUSD is in a decision pocket, not a confirmed trend continuation pocket.
Spot reference: 4546.32
Main value magnet: 4540.25
First bull permission: 4552.42
Breakout confirmation: 4564.31
Bear damage begins: 4529.87
Line in the sand: 4508.76
════════════════════════════════════════════════════════════
1) THE CORE MAP
════════════════════════════════════════════════════════════
Gold is repairing from lower value, but the repair is now approaching the zone where late buyers can get trapped if acceptance is missing.
The bullish side needs more than a wick above resistance. It needs:
- acceptance above 4552.42
- a clean reclaim and hold above 4564.31
- a retest that does not collapse back under value
- DXY and U.S. yields staying soft during the retest
Without that, the move remains a reaction into supply, not a clean continuation leg.
The bearish side does not fully regain control unless gold loses the repair shelves:
- first weakness below 4538.17 / 4529.87
- deeper damage below 4522.65
- full campaign failure below 4508.76
That means both sides have a clear job:
Bulls must prove acceptance above the gate.
Bears must prove failure below the repair shelf.
Everything between those zones is tactical, not emotional.
════════════════════════════════════════════════════════════
2) MARKET STRUCTURE READ
════════════════════════════════════════════════════════════
Higher timeframe:
Gold is recovering from lower accumulation, but the broader structure is not fully repaired. The recovery is strong enough to respect, but not clean enough to chase blindly.
4H / 1H:
The market is still carrying absorption and mixed structure. That usually means rallies can continue, but only if each higher shelf is accepted and defended.
15M execution frame:
This is where the truth should appear. A 15m acceptance above 4552.42, followed by a successful retest, improves the bullish case. A failed acceptance back below 4538.17 weakens it quickly.
Current tactical read:
Repair is alive, but permission is conditional.
════════════════════════════════════════════════════════════
3) KEY LEVELS
════════════════════════════════════════════════════════════
BULLISH GATE
4552.42 = first permission shelf
4564.31 = breakout confirmation shelf
4575.96 = next upside magnet / TPq zone
4585.53 = stronger confirmation / TP2 zone
4608.01 = upper expansion target
4617.70 = stretch target if momentum stays clean
VALUE / MAGNET
4540.25 = main intraday magnet
4546.32 = spot reference
PULLBACK SHELVES
4542.09 = first defended continuation shelf
4538.17 = POC-side reload / support test
4529.87 = repair downgrade shelf
4522.65 = last controlled pullback before deeper reset
BEARISH DAMAGE MAP
4508.76 = line in the sand
4502.43 = first deeper reset shelf
4496.54 = downside continuation shelf
4487.54 / 4485.12 = lower reaction shelf
4455.70 / 4438.85 = deeper structural memory
════════════════════════════════════════════════════════════
4) BULLISH SCENARIO
════════════════════════════════════════════════════════════
The clean bullish version is not a vertical chase.
The better bullish case is:
1. Gold holds above 4538.17 / 4542.09.
2. Price accepts above 4552.42.
3. Buyers reclaim 4564.31.
4. Retest holds without losing value.
5. DXY and U.S. yields do not rebound aggressively.
If that sequence holds, upside can rotate toward:
- 4575.96
- 4585.53
- 4608.01
- 4617.70
The important point is that the retest matters more than the first push.
A spike is not enough. Acceptance is the trade filter.
════════════════════════════════════════════════════════════
5) BEARISH SCENARIO
════════════════════════════════════════════════════════════
The bearish case starts if gold cannot defend the repair.
Warning signs:
- price fails above 4552.42 / 4564.31
- price returns under 4540.25
- 4538.17 fails as support
- 4529.87 breaks and accepts lower
If that happens, the repair can turn into a bull trap unwind.
The downside map then opens toward:
- 4522.65
- 4508.76
- 4502.43
- 4496.54
- 4487.54 / 4485.12
Below 4508.76, the conversation changes from “healthy pullback” to “repair failure”.
════════════════════════════════════════════════════════════
6) MACRO TIMING RISK
════════════════════════════════════════════════════════════
The next data stack can decide whether the repair survives.
Main timing windows to watch in Cairo time:
15:30 Cairo — U.S. Housing / Jobless Claims / Philadelphia Fed cluster
16:45 Cairo — S&P Global U.S. Flash PMI
20:00 Cairo — U.S. 10Y TIPS auction
23:30 Cairo — Fed Balance Sheet
The reaction path matters more than the headline alone.
For gold:
- weaker labor / softer activity can support gold if yields and DXY stay lower
- stronger activity / lower claims can pressure gold if US02Y and DXY rebound
- mixed data can create a two-way trap
The first spike is emotion.
The second acceptance is truth.
════════════════════════════════════════════════════════════
7) EXECUTION PLAN — EDUCATIONAL ONLY
════════════════════════════════════════════════════════════
LONG CONTINUATION IDEA
Trigger:
Acceptance above 4552.42, then reclaim / retest above 4564.31.
Primary zone:
4552.42–4564.31 retest hold.
Risk map:
SL1: below 4538.17 / 4529.87 depending on timeframe
SL2: below 4522.65 if using wider structure
Invalidation: loss of 4508.76
Targets:
TPq: 4575.96
TP2: 4585.53
TP3: 4608.01 / 4617.70
SHORT FAILURE IDEA
Trigger:
Failed acceptance above 4552.42 / 4564.31, then close back below 4540.25 and 4538.17.
Primary zone:
Failed reclaim or failed retest under 4540.25 / 4538.17.
Risk map:
SL1: above 4552.42
SL2: above 4564.31 / 4575.96 if using wider structure
Invalidation: reclaim above 4585.53
Targets:
TPq: 4529.87
TP2: 4522.65 / 4508.76
TP3: 4502.43 / 4496.54
════════════════════════════════════════════════════════════
8) FINAL VERDICT
════════════════════════════════════════════════════════════
Gold is repairing, but it is not yet a clean trend-chase environment.
The bullish structure improves only if price accepts above 4552.42 and confirms above 4564.31. Until then, upside is a repair into supply and must be managed carefully.
The bearish structure improves if gold fails the upper gate and loses 4538.17 / 4529.87. Below 4508.76, the repair thesis is invalidated and a deeper reset becomes active.
Best posture:
- do not chase the first candle
- trade the retest
- respect the 4540.25 value magnet
- treat 4552.42 / 4564.31 as the bullish gate
- treat 4529.87 / 4508.76 as the bearish damage path
- reduce aggression around macro-data windows
This is an acceptance map.
Not a prediction.
Not a signal.
A structured decision framework.
Educational analysis only. Not financial advice. Manage risk carefully.  Long
Long
Long 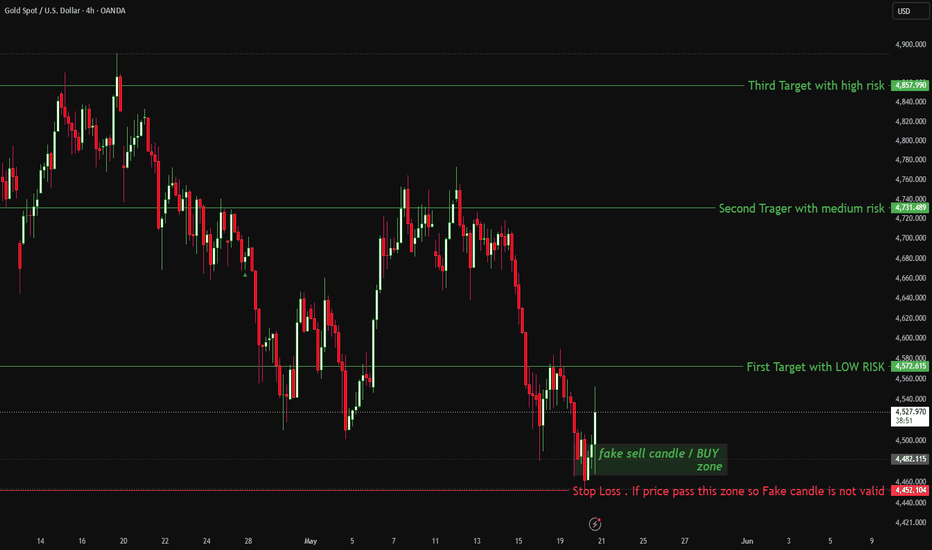
Monthly/Weekly Institutional Level Map.Weekly Companion With Previous-Month References:
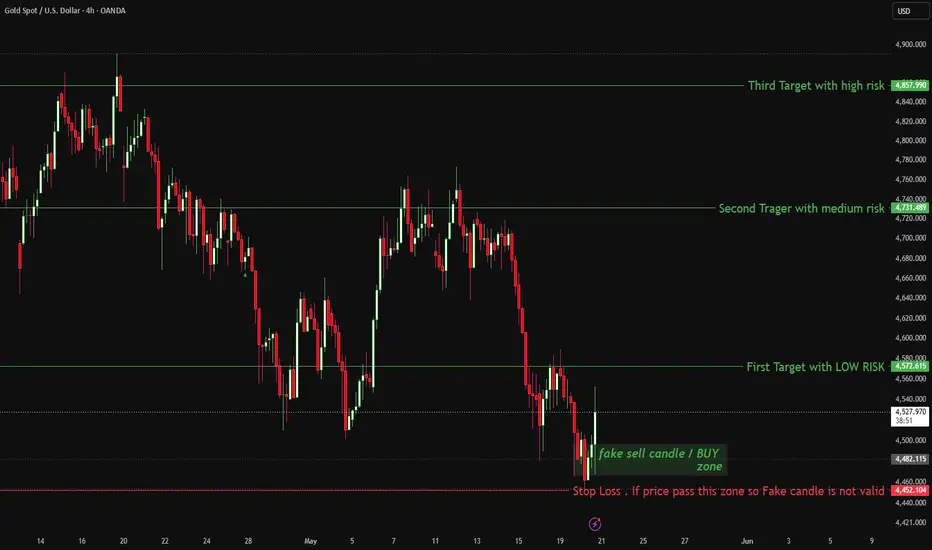
Both the Monthly and Weekly charts continue to maintain a short-term bearish bias unless price successfully reclaims the key control levels. The first bullish invalidation level stands at 4,545, followed by the stronger reclaim zone around 4,629–4,660. On the bearish side, a weak close below 4,453 would confirm continuation pressure and open the path toward the next liquidity targets near 4,400 and 4,350–4,300
XAUUSD still looks bullish if we look at the bigger monthly trend, but right now short-term price action is clearly showing weakness. The monthly candle is sitting below its open and keeps rejecting the 4,770 area, while price slowly moving closer toward the lower side of the range. Weekly structure also not looking very healthy for bulls, because upside continuation failed and price is accepting below important liquidity levels.
At this stage, the market feels more like distribution after a very stretched rally. Sellers are still in control unless buyers can quickly reclaim the current sell-side pressure. And honestly, market does not even need a huge crash to stay bearish here. Even a simple bounce into the 4,510–4,545 zone, if rejected again, can become another lower-high setup before continuation lower.
For now, the first proper sign of strength would be a strong weekly reclaim above the monthly open. That’s the area where smart money would start showing real accumulation again instead of just temporary reactions. Short 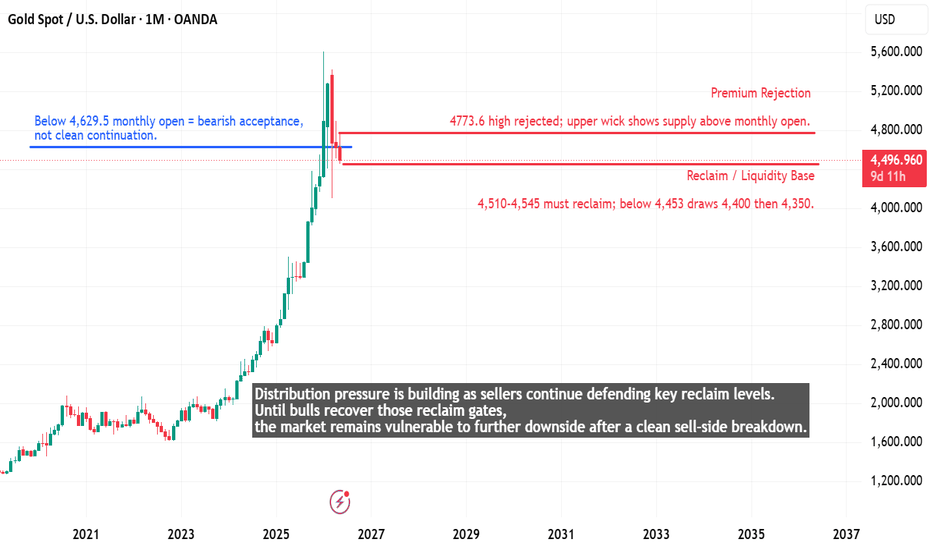
Long