Long
Long
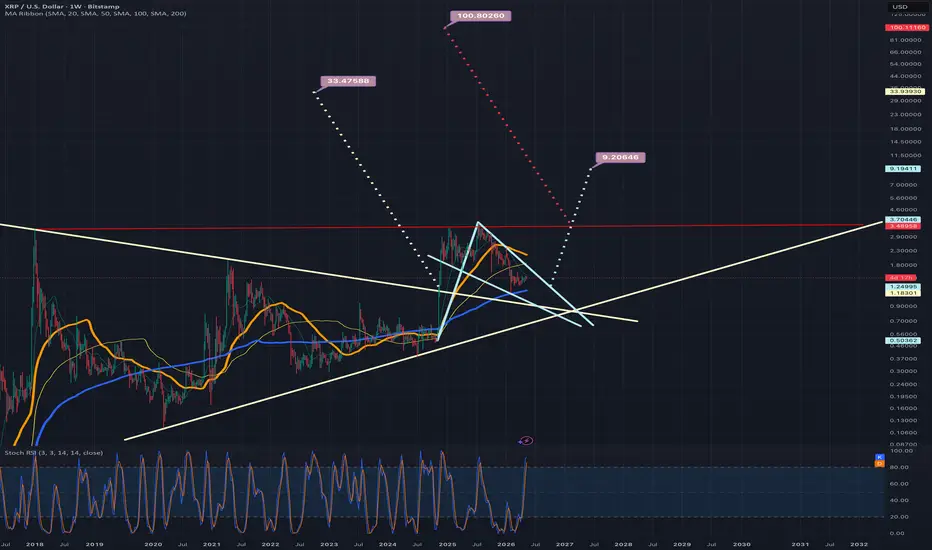
XRP PREPARING FOR A VOLCANIC MOVE!Hey traders! I’m back with a fresh analysis of XRP/USDT , where I’ve identified a massive symmetrical triangle pattern that is reaching its terminal point.
As you can see on the daily chart, this pattern has been coiling for months following the major correction. The "quiet" volume on the OBV and standard indicators is the ultimate tell—the market is holding its breath before a violent expansion. While the selling pressure has looked heavy on the dips, triangles are famous for trapping over-eager traders. We don't guess; we react.
My Trade Execution Plan
To avoid getting caught in a "fakeout," I am using a dual-stop strategy to catch the momentum the moment the dam breaks. Here is exactly how I’m setting up my orders:
🚀 BULLISH SCENARIO (Long):
BUY STOP: 1.50
Take Profit: 1.85
Rationale: A break above 1.50 clears the descending resistance and confirms a shift in market structure.
📉 BEARISH SCENARIO (Short):
SELL STOP: 1.30
Take Profit: 1.05
Rationale: If we lose the 1.30 support, the "measured move" suggests a fast slide back toward the $1.00 psychological level.
Symmetrical Triangle Theory: Why This Works
For those following along at home, here is the technical breakdown:
1. The Squeeze: Volume must decrease as price gets pinched toward the apex. We are seeing that perfectly here.
2. The Breakout: For a move to be "real," we need to see a massive spike in volume at the breakout point.
3. The Target: We calculate the "measured move" by taking the height of the triangle’s mouth and projecting it from the breakout price.
Master the Charts
If you want to understand the math behind these patterns, John Murphy’s "Technical Analysis of the Financial Markets" is the gold standard. It’s how the pros identify these setups before they happen.
What’s on your watchlist? I’m looking for my next setup—drop a coin in the comments and I might feature it in tomorrow’s update!
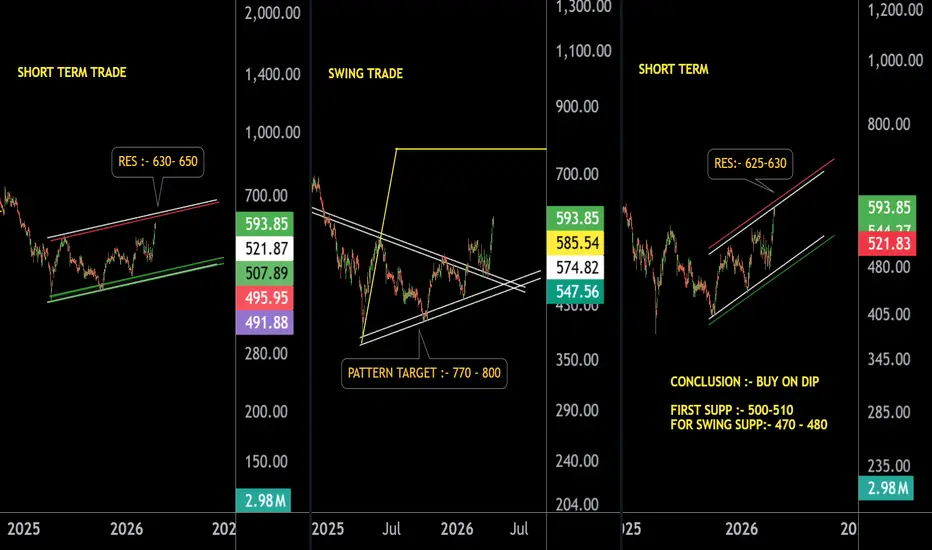
Don't forget to follow, like, and comment to stay ahead of the next big move! SONACOMS . Multi-Timeframe Breakout Setup | Big Move Incoming . This stock is currently showing a strong multi-timeframe setup, combining short-term momentum with a broader swing opportunity.
On the short-term chart, price is moving in a rising structure and approaching a key resistance zone of 630–650. The trend is gradually shifting bullish, with higher lows forming — indicating accumulation. A breakout above this resistance can trigger fresh momentum.
Looking at the swing chart, the stock has already completed a corrective phase and is now attempting a breakout from a contraction pattern. If this breakout sustains, the pattern target comes around 770–800, making it a strong positional opportunity.
On the alternate short-term structure, price is again respecting an upward channel. The immediate resistance lies near 625–630, while the trend remains intact as long as higher lows are maintained.
Key Strategy:
Bias remains bullish
Best approach: Buy on dips
Immediate support: 500–510
Strong swing support: 470–480.
Conclusion:
As long as the stock holds its support zones, dips can be considered buying opportunities, with a potential upside move toward higher targets in the coming sessions .  Long
Long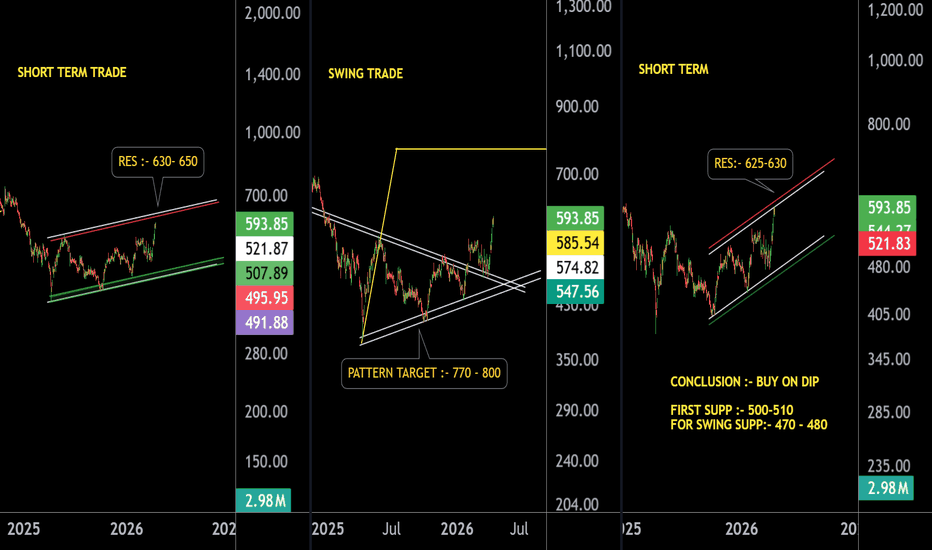
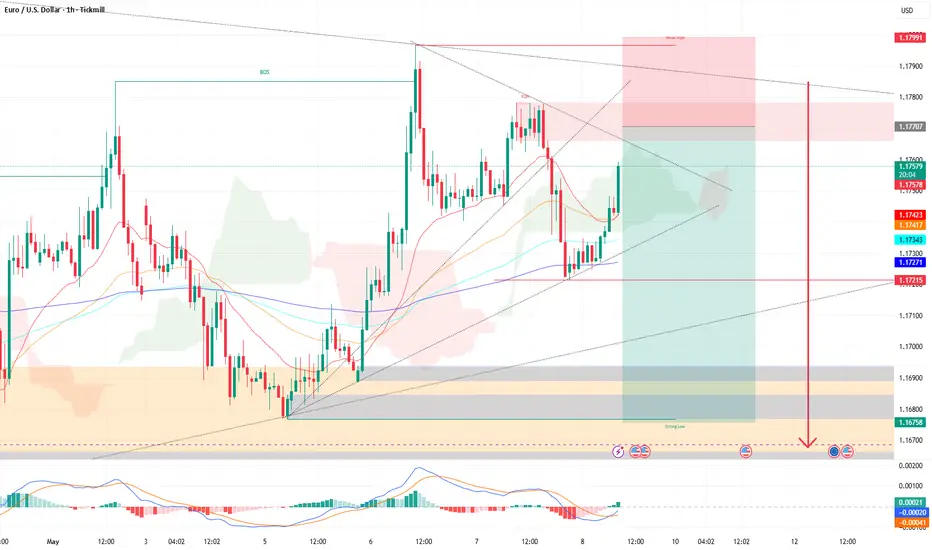
$EURUSD - $1.18 as a decisive levelHi guys! 👋
🔔 EURUSD is at 1.1690 and the market is stuck. It bounced hard off the March lows at 1.1407, gained over 200 pips in a week when the ceasefire headlines hit, and now it's sitting right under the one level that matters — 1.1820.
🔔 Break it and hold it, this goes to 1.2000 and potentially 1.2500. Can't break it, and 1.1200–1.1180 becomes the next stop.
🔔 What followed in early 2025 was a strong impulsive move — clean, fast, technically valid — that broke price above the mid-range of the triangle and ran all the way to 1.2000. That impulse matters.
🔔 The problem is the ascending broadening wedge sitting on top of it. Higher highs, higher lows, but the boundaries are expanding not tightening.
🔔 The MA50 crossed below the MA200. That's a Death Cross, it's confirmed, and it's sitting right where price is trading now. You're basically trading inside the moving average cluster, which means every candle from here is a fight between the bulls trying to reclaim it and the bears defending it.
🔔 The 50% level is where the market tends to find genuine buyers after a corrective move, and the bounce off it has been real. The question is whether that bounce has enough behind it to take out 1.1820 or whether it fades into the moving average cluster and rolls over.
Bias : Retest $1.182 and go down to $1.11
Invalidation : If closes above $1.182, which will lead to another jump to $1.20
✊ Good luck with your trades! ✊
• If you like the idea, hit the 🚀 button
• Please ✍️ your thoughts in the Comments section
• And follow me for more updates.
BITCOIN - Market stagnation. Bearish trend BINANCE:BTCUSDT.P is stagnating, forming a symmetrical triangle within a global flat pattern that has formed as part of a global downtrend. There is still no fundamental support for the crypto market.
Bitcoin has attempted to act as a hedge in the current tense geopolitical and economic situation, but all attempts at growth are being aggressively sold off.
A trend line is forming, and the market is not allowing the price to reach intermediate key areas of interest, which indicates the presence of bearish pressure. Bitcoin is in a global downtrend. Focus on the current range of 69,185 - 71,100. The market may test 70100 - 71000 before falling within the main figure (to 67K).
Resistance levels: 7010, 71000, 72000
Support levels: 69180, 66270
The reaction to the 69200 support is weakening, and the bulls may not be able to withstand market pressure. A close below 69185 could trigger distribution within the main bearish trend. Before that, a short squeeze of 70100 - 71060 is possible. However, the structure will be broken if Bitcoin manages to break through 72K and consolidate above this zone.
Best regards, R. Linda!  Short
Short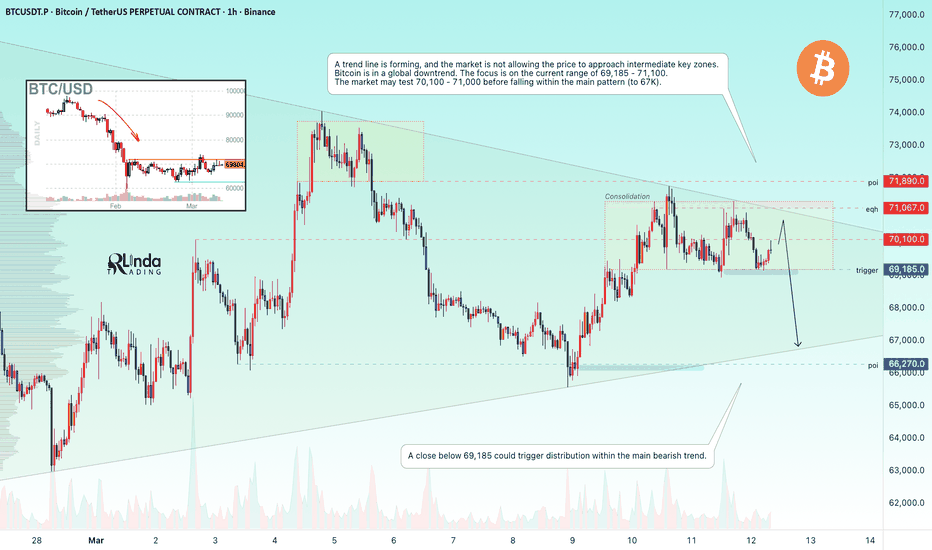
Bitcoin Just Reclaimed $68,000 — Breakout Confirmation Next?After the military tensions in the Middle East began, Bitcoin ( BINANCE:BTCUSDT ) initially moved lower. However, as the situation stabilized, the market regained confidence — and BTC started to recover.
Now, Bitcoin has successfully broken the key $68,000 trading level and is currently attempting to break the upper lines of a symmetrical triangle.
From an Elliott Wave perspective, it appears that BTC is completing microwave C of the main wave Y.
In addition, Bitcoin maintains a strong correlation with the SPX500 index( FX:SPX500 ). Since SPX500 has been pumping strongly in recent hours, this increases the probability of further upside for BTC.
I expect Bitcoin to break the upper lines of the symmetrical triangle and potentially move toward at least $70,881.
Will BTC successfully confirm the breakout and continue higher?
First Target: $70,881
Second Target: $72,273
Third Target: Cumulative Short Liquidation Leverage($74,560-$72,440)
Stop Loss(SL): $66,956
Points may shift as the market evolves
Cumulative Long Liquidation Leverage: $68,480-$67,760
Cumulative Long Liquidation Leverage: $64,440-$63,750
💡 Please respect each other's opinions and express agreement or disagreement politely.
📌Bitcoin Analysis (BTCUSDT), 4-hour time frame.
🛑 Always set a Stop Loss(SL) for every position you open.
✅ This is just my idea; I’d love to see your thoughts too!
🔥 If you find it helpful, please BOOST this post and share it with your friends. Long 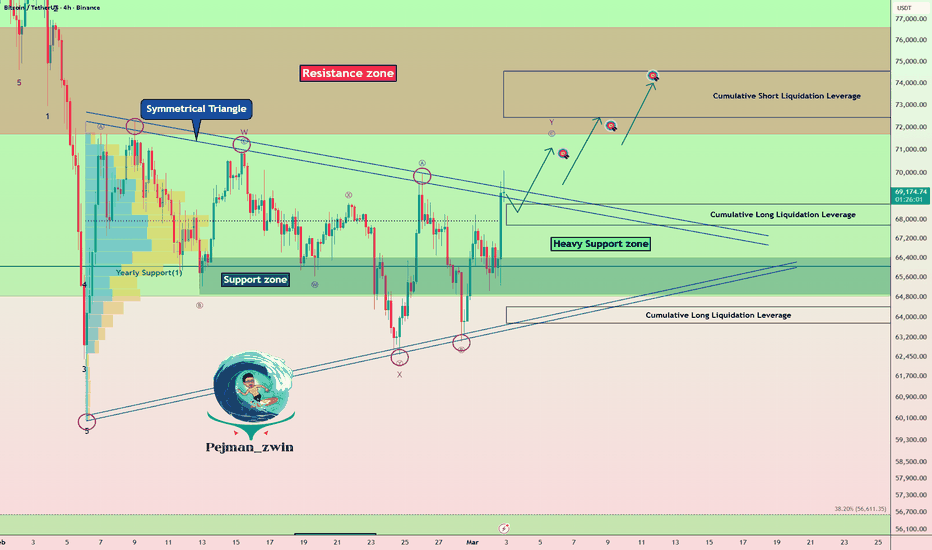
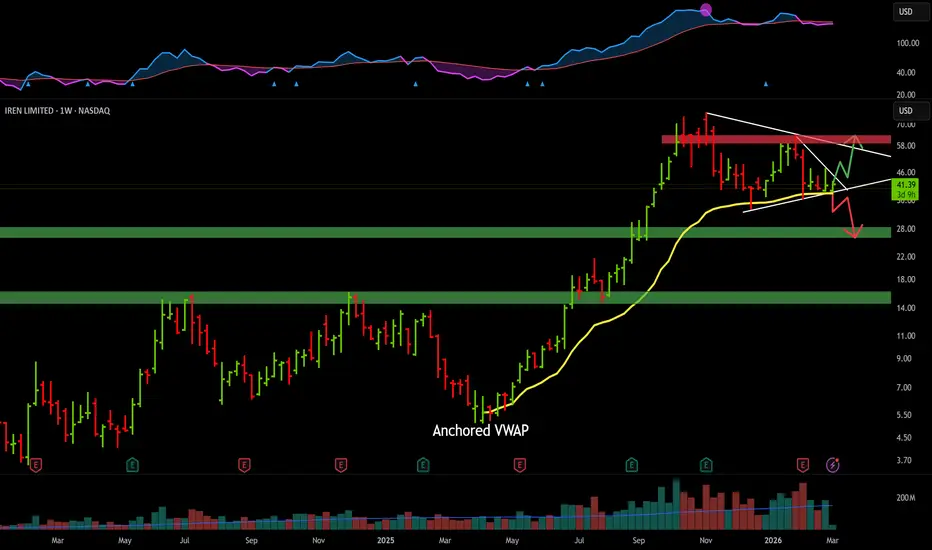
IREN: Compression at a Critical Inflection — Resolution Near!(A) THE TECHNICAL SETUP
Iris Energy (IREN) has spent the last several months compressing into a descending triangle inside a larger Symmetrical Triangle on the weekly timeframe. Momentum has stalled, volatility has contracted, and price is now pressing into the apex of the smaller structure.
• The Last Line of Defense: Price is resting directly on the ascending support trendline. This level also aligns with the Anchored VWAP from the April 2025 low (yellow line), making it a technically significant pivot.
• The Compression: Volatility contraction suggests a decisive directional expansion is approaching. The structure currently leans toward a test of lower bounds unless buyers reclaim control.
• The Approach: We are not front-running. The chart is mapping exhaustion. We are defining failure points and letting price confirm.
----------
(B) FUNDAMENTAL HEADWINDS (Context Matters)
The AI infrastructure narrative that fueled the prior impulse is maturing. Markets are beginning to differentiate between theme and economics.
1️⃣ Narrative vs. Margins:
The pivot from Bitcoin mining to AI cloud was rewarded aggressively. However, this transition is capital-intensive. As AI enthusiasm normalizes, investors are scrutinizing margin durability and return on invested capital.
2️⃣ CapEx Burden:
Scaling gigawatts of data center capacity requires sustained capital deployment. If compute demand growth moderates, high fixed costs compress operating leverage. In capital-heavy models, execution precision matters.
3️⃣ High-Beta Rotation Risk:
We are observing selective rotation out of narrative-driven, high-beta technology into stronger cash-flow profiles. In tightening liquidity environments, speculative multiples compress first.
This does not mean collapse. It means expectations are being repriced.
----------
(C) KEY LEVELS (Scenario Mapping)
📉 --> Base Case: Breakdown Scenario (Structure Currently Favors)
A weekly close below the ascending trendline and the April 2025 AVWAP (~$37–38) signals structural failure.
• Downside Target: $27–28 demand zone (green box).
• Why $28 Matters: Prior IPO high and former breakout base. It represents the last meaningful institutional accumulation shelf.
Loss of $38 opens air toward the prior demand shelf.
📈 --> Alternative Case: Upside Resolution (Lower Probability, Must Track)
A weekly close above descending resistance (~$48) invalidates the bearish lean.
• Break above $48 resets consolidation.
• Reclaims momentum and opens room toward $60–62 (next major resistance zone).
• Signals continuation of the primary uptrend.
Structure decides. Not opinion.
----------
(D) OPTIONS POSITIONING (Defined Risk)
Consider Bear Call Credit Spreads above descending resistance.
• Thesis: Upside is capped beneath resistance.
• Even if price chops sideways, time decay works in your favor.
• If breakdown materializes, premium is retained with strictly defined risk parameters.
This is structure-driven positioning — not directional guessing.
----------
(E) BOTTOM LINE
IREN is compressing at a critical inflection point.
Support: $37–38 | Resistance: ~$48
Below support, the path opens toward $28.
Above resistance, the trend resumes higher.
This is not prediction. This is scenario management. Let price confirm.
Jay Vohra: Chartered Accountant (CA) | Ex-UK Commodity Desk | Equity & Options Strategist — Aligning macro, fundamentals & technical precision to capture high-conviction asymmetric setups. Risk defined before capital deployed.
Disclaimer: Educational purposes only.
 Short
Short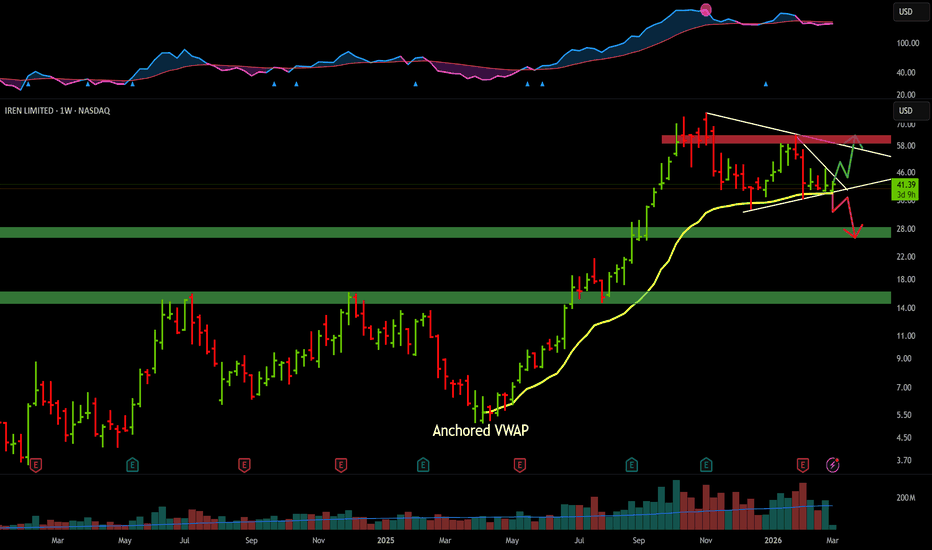
 Long
Long
Bitcoin Just Pulled a “Fake Breakdown” | Watch What Happens NextAs I expected in the previous idea , Bitcoin( BINANCE:BTCUSDT ) hit my first target; however, with the start of the new week, it began to decline again. Now, the question is: Can Bitcoin break the heavy support zone ($78,260-$64,850 or not? Stay with me.
Bitcoin is currently moving near the lower and critical levels of the heavy support zone ($78,260-$64,850. If it breaks the previous price bottom($64,290) on the 4-hour timeframe, it might start a stronger decline. But in my view, that won't happen.
Bitcoin seems to have broken the lower line of the symmetrical triangle, but since it couldn’t continue, it appears to have been a fake break.
From an Elliott Wave theory perspective, Bitcoin still hasn’t completed its upward corrective waves. With the new week, it seems wave X is complete, and we can expect the main upward wave Y.
We can confirm this by analyzing USDT.D%( CRYPTOCAP:USDT.D ). In my view, USDT.D% might decline, as its main wave four isn’t finished, which could help Bitcoin’s upward movement.
I expect Bitcoin to rise in the coming hours and at least fill the upper CME Gap($67,925-$67,760). The second target could be the upper lines of the symmetrical triangle and the Cumulative Short Liquidation Leverage($70,000-$68,750).
First Target: $68,011
Second Target: $68,696
Third Target: $69,731
Stop Loss(SL): $64,367(Worst)
Points may shift as the market evolves
Cumulative Long Liquidation Leverage: $64,270-$63,820
Cumulative Long Liquidation Leverage: $60,000-$58,000
CME Gap: $84,560-$79,660
CME Gap: $54,545-$52,980
Note: Since my short-term analysis on the S&P 500 ( FX:SPX500 ) is bullish, the S&P’s rise, given its high correlation with Bitcoin, could also support Bitcoin’s rise.
What’s your outlook for Bitcoin in the coming hours?
💡 Please respect each other's opinions and express agreement or disagreement politely.
📌Bitcoin Analysis (BTCUSDT), 4-hour time frame.
🛑 Always set a Stop Loss(SL) for every position you open.
✅ This is just my idea; I’d love to see your thoughts too!
🔥 If you find it helpful, please BOOST this post and share it with your friends. Long 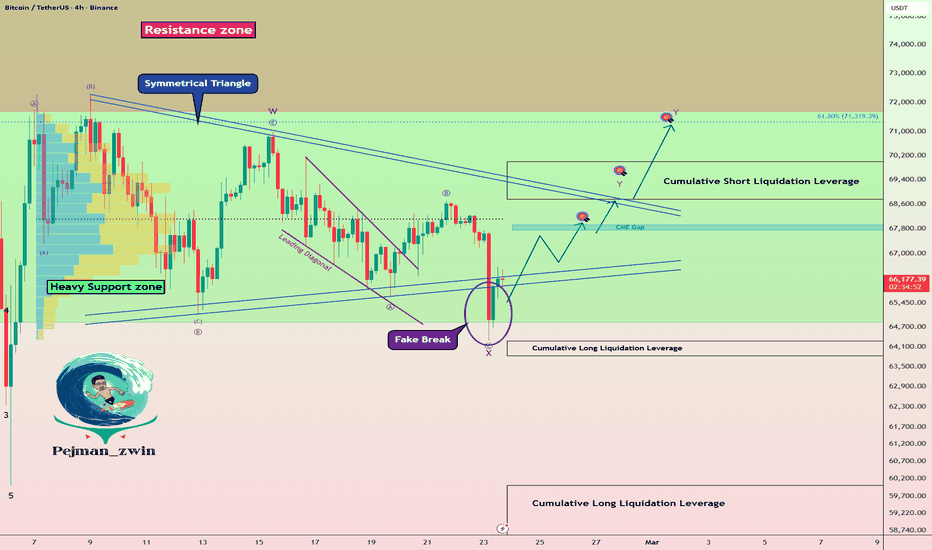
Bitcoin Near a “Do-or-Die” Zone — Here’s What I’m WatchingThis analysis is on the 4-hour timeframe, in line with the idea I shared with you a few days ago . Since Bitcoin ( BINANCE:BTCUSDT )'s moves in the past few days have been rather range-bound and without significant momentum, I’m sharing another update with you based on Bitcoin’s current conditions.
Bitcoin is still moving near the lower area of a heavy support zone ($78,260-$64,850) and close to a Cumulative Long Liquidation Leverage($65,590-$65,200).
From a classical technical analysis standpoint, Bitcoin’s movements in the past two weeks have shown two moves in a descending channel. Now, in these recent three days, Bitcoin has formed a descending channel. Additionally, there’s a chance of a symmetrical triangle forming. Since a symmetrical triangle is a continuation pattern and the higher timeframes are bearish, if this pattern completes and Bitcoin moves downward, the heavy support zone might break with the triangle’s help. Of course, that’s just one scenario.
From an Elliott Wave theory perspective, Bitcoin still has a chance for an upward wave as long as it doesn’t drop below $65,000. We could expect a wave C of a Zigzag Correction(ABC/5-3-5) to be on the way.
Also, looking at USDT.D%( CRYPTOCAP:USDT.D ) we can see a classical rising wedge pattern. If the lower lines of this pattern break, we could expect a drop in USDT.D%, which could help boost prices in the crypto market, including Bitcoin.
I expect, based on the above, that after breaking the descending channel, Bitcoin could rise at least to the Cumulative Short Liquidation Leverage($68,890-$68,440). If momentum picks up, it might even reach the upper lines of the symmetrical triangle.
What’s your outlook for Bitcoin in the coming hours?
Note: Beyond the technicals, rising Middle East tensions—especially at weekends—could increase, affecting Bitcoin. Also, if the S&P 500( TVC:SPX ) experiences a sudden drop, due to its correlation with Bitcoin, it could trigger a Bitcoin decline as well.
First Target: $68,267
Second Target: Upper lines of symmetrical triangle
Third Target: Cumulative Short Liquidation Leverage($71,830-$70,500)
Stop Loss(SL): $64,859
Points may shift as the market evolves
Cumulative Long Liquidation Leverage: $60,000-$58,000
CME Gap: $84,560-$79,660
CME Gap: $54,545-$52,980
💡 Please respect each other's opinions and express agreement or disagreement politely.
📌Bitcoin Analysis (BTCUSDT), 4-hour time frame.
🛑 Always set a Stop Loss(SL) for every position you open.
✅ This is just my idea; I’d love to see your thoughts too!
🔥 If you find it helpful, please BOOST this post and share it with your friends. Long 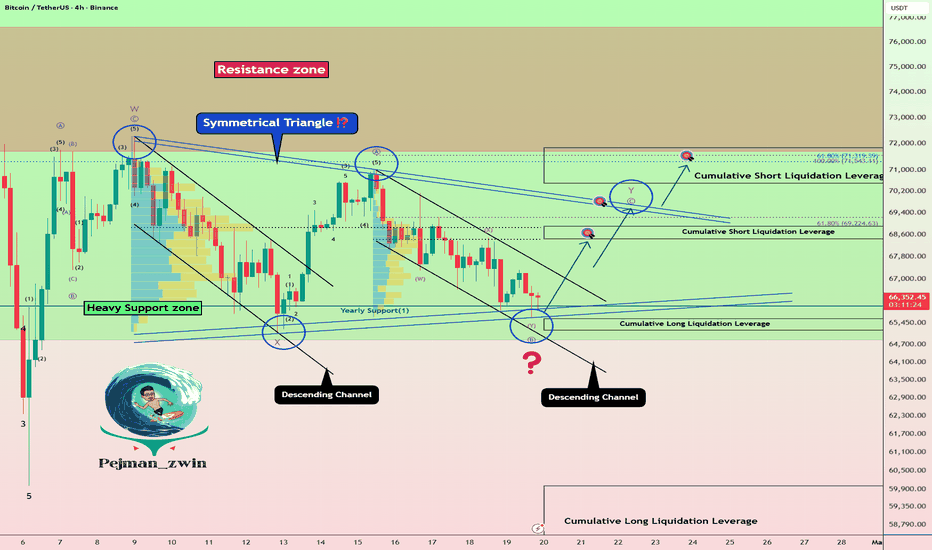
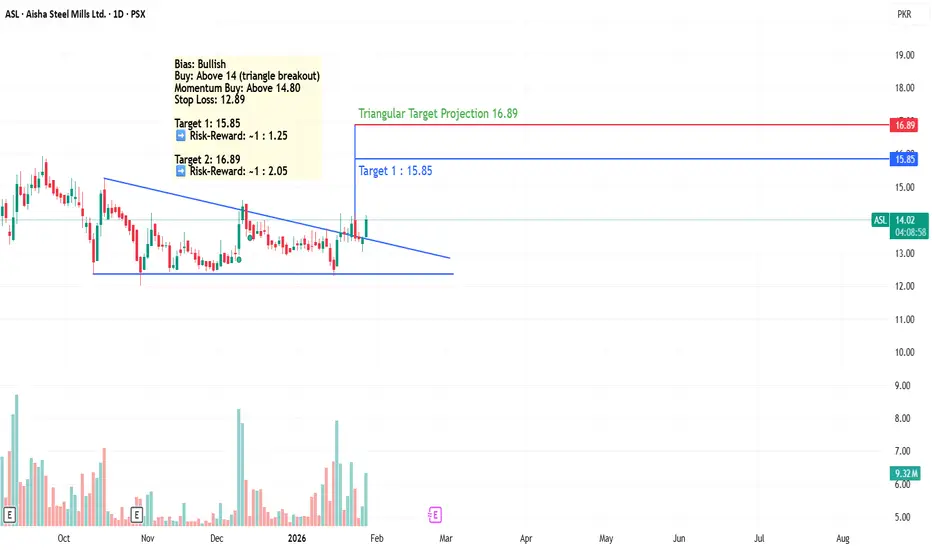
Blue Star Ltd. – Breakout Structure with Seasonal TailwindBlue Star has registered a decisive breakout from a symmetrical triangle formation, signalling a potential expansion phase following prolonged consolidation. Post-breakout, the stock is currently trading within a narrow range just below a key swing resistance, indicating controlled price action ahead of a possible momentum move.
A decisive close above the immediate swing high would confirm continuation and could trigger an accelerated upside move, supported by the structural breakout pattern.
From a thematic perspective, the stock also stands to benefit from a seasonal demand tailwind, with the approaching summer period historically supportive for air-conditioning and cooling solution companies.
For trading purposes, ₹1900 may be considered as a protective stop-loss, maintaining a favourable risk profile. Upside objectives are placed at ₹2260, followed by ₹2450 and ₹2520 based on prior swing projections and measured move potential.
In case price achieves initial targets with sustained momentum, a trailing stop approach is preferred over premature profit booking, allowing participation in any extended breakout move.  Long
Long
 Long
Long
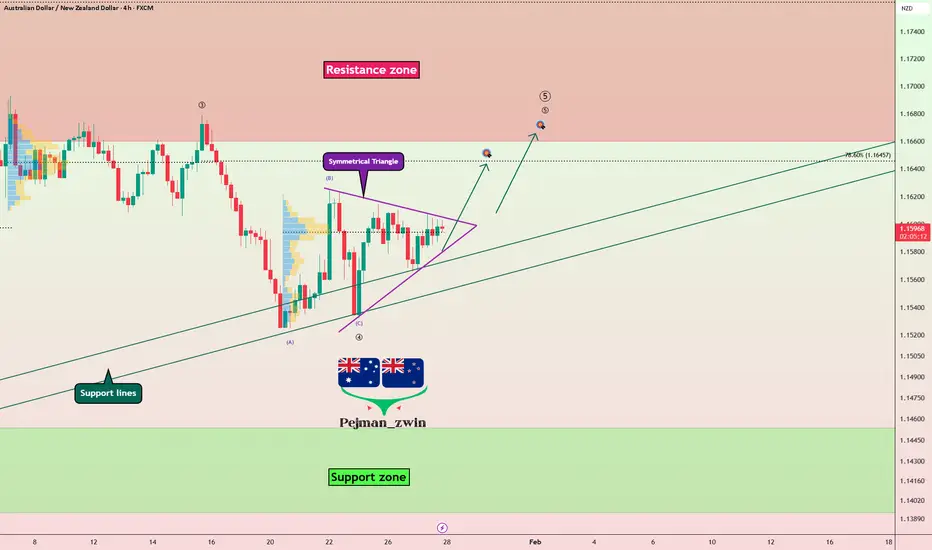
AUDNZD Setup: Symmetrical Triangle + Bullish FundamentalsToday, I want to share a long idea on AUDNZD ( OANDA:AUDNZD ) with you.
Let’s walk through the fundamental and technical picture step by step.
From a fundamental perspective, AUDNZD maintains a mild bullish bias.
Australia’s monetary policy remains slightly more restrictive compared to New Zealand’s.
Persistent inflation pressures keep the RBA cautious about rate cuts, while recent inflation data in New Zealand has largely been priced in and has not provided a fresh advantage for the NZD.
Additionally, Australia continues to benefit from relatively stronger growth support driven by the commodity sector, which adds to AUD resilience.
Overall, the fundamental balance currently favors AUD over NZD, making a long AUDNZD position reasonable — though, as always, not without risk.
AUDNZD is currently trading near key support lines.
From a classic technical analysis perspective, the pair is consolidating inside a symmetrical triangle, signaling compression and a potential expansion phase ahead.
From an Elliott Wave perspective, AUDNZD appears to have completed the main wave 4, suggesting the market may be preparing for the next impulsive move.
If price breaks above the upper line of the symmetrical triangle, I expect AUDNZD to push at least toward the 1.16370 NZD as an initial upside target.
First Target: 1.16370 NZD
Second Target: 1.1668 NZD
Stop Loss(SL): 1.1547 NZD
Points may shift as the market evolves
Do you think AUDNZD can resume its upward trend?
💡 Please respect each other's opinions and express agreement or disagreement politely.
📌Australian Dollar/New Zealand Dollar Analysis (AUDNZD), 4-hour time frame.
🛑 Always set a Stop Loss(SL) for every position you open.
✅ This is just my idea; I’d love to see your thoughts too!
🔥 If you find it helpful, please BOOST this post and share it with your friends.  Long
Long
AUDCAD is Breaking Triangle — Bullish Breakout Ahead of CPI?Today, I want to share a long trading opportunity on the AUDCAD pair ( FX:AUDCAD ), so stay tuned!
Currently, AUDCAD has successfully broken through its resistance line and is now situated within a heavy resistance zone(0.9585 CAD-0.9247 CAD).
From a classic technical analysis perspective, if we look at the AUDCAD chart on the 4-hour timeframe, we can see a symmetrical triangle pattern, which suggests a continuation of the recent bullish trend of AUDCAD.
From an Elliott Wave perspective, it appears that AUDCAD has completed microwave 4 of the main wave 5, and we can expect the start of microwave 5 of the main wave 5. The breakout above the upper line of the symmetrical triangle could confirm the end of the microwave 4.
Additionally, today’s Canadian CPI data could act as a key catalyst for AUDCAD.
Based on recent macro trends, I expect inflation pressures in Canada to remain soft.
If CPI comes at or below expectations, it should weaken CAD and support a bullish continuation on AUDCAD.
As long as the structure holds, I remain biased to the long side.
As a result, I expect that after breaking the upper line of the symmetrical triangle, AUDCAD could rise at least to 0.9357 CAD.
First Target: 0.9357 CAD
Second Target: 0.9397 CAD
Stop Loss(SL): 0.9241 CAD
💡 Please respect each other's opinions and express agreement or disagreement politely.
📌Australian Dollar/Canadian Dollar Analysis (AUDCAD), 4-hour time frame.
🛑 Always set a Stop Loss(SL) for every position you open.
✅ This is just my idea; I’d love to see your thoughts too!
🔥 If you find it helpful, please BOOST this post and share it with your friends.