 LongLong
PTTGC Buy on dip
Uptrend in long-term
Correction in short-term
Signal bullish divergence + price action
Buy@32.25
SL@30.5
TP: No TP just ride the trend
 Long
Long
OSP: Is a New Uptrend Starting From 13.5–14.6 ?**OSP: Long-Term Accumulation Zone Showing Potential Reversal**
OSP is currently trading within a major support area between **13.5–14.6 THB**, a zone that has repeatedly attracted buying interest and prevented further downside.
After a prolonged downtrend, price action has started to stabilize above support, suggesting that selling pressure may be weakening. The recent consolidation around this demand zone could be an early sign of accumulation before a larger recovery phase.
**Trading Plan**
🔹 Buy Zone: 13.5–14.6 THB
**Upside Targets**
🎯 TP1: 16.4 THB
🎯 TP2: 18.3 THB
🎯 TP3: 19.9 THB
🎯 TP4: 21.4 THB
🎯 TP5: 23.0 THB
🎯 TP6: 24.6 THB
As long as price remains above the 13.5 THB support level, the medium-to-long-term outlook remains constructive. A sustained recovery could provide attractive risk-to-reward opportunities for position traders and investors.
*This analysis is based on technical price action and key support-resistance structures. Always apply proper risk management before making investment decisions.*
🔥Trading futures, forex, CFDs and stocks carries a risk of loss.
Please consider carefully whether such trading is suitable for you.
>>GooD Luck 😊
❤️ Like and subscribe to never miss a new idea!
 Long
Long
DELTA Analysis: Earning Call Q11. Overview Analysis
1.1 Excerpts & Key Messages from Provided DocumentsQ1'26 Press Announcement: DELTA reported a record Q1 2026 revenue of 61.38 billion THB, up 43.6% YoY, driven primarily by immense demand for datacenter and AI server power solutions. Despite geopolitical tensions and inflation, robust order backlogs for AI infrastructure are sustaining their hyper-growth trajectory. Management remains cautiously optimistic, citing Thailand's aggressive push to become a global semiconductor hub. Notes to Financial Statements: Operations are being heavily streamlined, evidenced by the acquisition of Eltek Power to consolidate green energy assets, alongside the liquidation of non-core subsidiaries in India and Hungary. The company maintains heavy related-party transaction volumes, notably paying significant royalty and engineering fees to its parent company, Delta Taiwan. Auditor's Report: The auditor issued an unqualified, standard review conclusion, indicating the financial statements are fairly presented with no adverse accounting irregularities found.
1.2 Financial Statements Analysis (Q1 2026)
2.1 Statement of Financial Position (Balance Sheet)MetricValue (THB) / RatioAnalysis & Alerts
2.1.1 Cash vs. DebtCash: 19.05BDebt: 0.87BDebt is 4.5% of Cash. 🚨 Red Flag! Debt < Cash (Alert triggered as requested).
2.1.2 Revenue vs. ARRev: 61.38BAR: 56.95BAR is 92.7% of Revenue. (Normal for B2B electronics; no alert needed).
2.1.3 Profit vs. InventoryProfit: 9.08BInv: 42.69BInventory is 470% of Net Profit. 🚨 Red Flag! Inventory > Profit.
2.1.4 Cash vs. LiabilitiesCash: 19.05BLiab: 62.56BLiabilities are 328% of Cash. 🚨 Red Flag! Liabilities > Cash.
2.1.5 Goodwill vs. AssetsGW: 0.21BAssets: 121.43BGoodwill is 0.17% of Total Assets (Well below the 50% alert threshold).2.1.6 Intangibles vs. AssetsIntg: 0.09BAssets: 121.43BIntangibles are 0.08% of Total Assets (Well below the 50% alert threshold).2.1.7 Preferred Stock: The company has zero preferred stock outstanding.
2.1.8 Retained Earnings: Yes, highly positive. Unappropriated retained earnings sit at 109.93 billion THB, up 8.9% QoQ and growing robustly YoY.
2.1.9 Treasury Stock: There is no treasury stock and no current share buyback program authorized.
2.1.10 Deferred Revenue: DELTA carries roughly 2.36 billion THB in unearned/deferred revenue, primarily consisting of advance receipts from unrelated parties and construction guarantees. These will be recognized as earned revenue upon the successful delivery of capital goods or fulfillment of service contracts.
2.2 Statement of Comprehensive Income (Income Statement)MetricQ1 2026 (THB)QoQ GrowthYoY Growth
2.2.1 Revenue61.38 Billion+6.2%+43.6%
2.2.2 COGS41.92 Billion+1.6%+31.7%
2.2.3 Gross Profit19.46 Billion+18.0%+78.1%
2.2.4 Operating Expense7.86 Billion+3.0%+98.8%
2.2.5 Operating Income9.69 Billion+21.1%+70.0%
2.2.6 Interest Expense8.58 MillionN/A-53.5%
2.2.7 EBITDA Margin19.4%+2.0%+2.4%
2.2.8 EBIT Margin15.8%+2.0%+2.5%
2.2.9 Net Profit Margin14.8%+2.4%+2.0%
2.2.10 EPS0.73 THB+25.0%+65.0%
2.3 Statement of Cash Flows
2.3.1 Net Income: 9.08 billion THB (YoY +65.4%, QoQ +26.4%).
2.3.2 OCF vs. Net Income: Operating Cash Flow (3.01B) vs. Net Income (9.08B). 🚨 Red Flag! OCF < Net Income. This divergence is driven by heavy working capital build-ups (inventory and AR) required to service massive AI orders.
2.3.3 FCF vs. Net Income: Free Cash Flow (-1.28B) vs. Net Income (9.08B). 🚨 Red Flag! FCF < Net Income. The company is burning cash organically due to massive capacity expansions.
2.3.4 CAPEX vs. Net Income: Capital Expenditure (4.30B) vs. Net Income (9.08B). Capex is 47.3% of NI. 🚨 Red Flag! CAPEX > 25% of Net Income.
2.3.5 Debt vs. Net Income: Debt (0.87B) vs. Net Income (9.08B). Debt is safely covered, representing only 9.6% of quarterly net income.
2.3.6 Stock Issuance: No new stock was issued.
(Note: 2.3.7 to 2.3.10 metrics for margins and EPS are identical to the Income Statement metrics provided in section 2.2).Business Model & MoatRevenue Streams: Power Electronics (AI servers, Datacenters) ~71%, Industrial Automation ~16%, Infrastructure ~11%, Mobility (EV) ~2%.
Competitive Advantage (Moat): DELTA’s core moat is Scale & Technological Integration. By acting as the primary Southeast Asian manufacturing hub for its parent company, it benefits from shared R&D, IP, and global supply chain leverage.Moat Vulnerability: This moat could erode if US-China trade tensions ease significantly (removing the "China Plus One" premium Thailand enjoys) or if the parent company decides to shift manufacturing allocations to other regional hubs like Vietnam or India.Industry Trends: Explosive demand for Generative AI is forcing hyperscalers (cloud providers) to upgrade power and cooling systems, directly benefiting DELTA's high-margin server power supply units.
Key Scenarios & Outlook (12–24 Months)Bull Case: AI infrastructure build-out accelerates; DELTA successfully scales liquid cooling solutions, expanding Net Margins toward 17%.Base Case: Growth moderates to a historical ~15-20% CAGR as datacenter demand normalizes; margins stabilize around current 14% levels.Bear Case: A global semiconductor glut or delays in next-gen AI chip rollouts cause hyperscalers to slash CAPEX, leading to inventory write-downs and severe multiple compression.
2. Deep Financial Breakdown (5-Year History)Financial Health Analysis:DELTA is financially formidable but running hot. Revenue and Net Income have skyrocketed in a near-perfect linear uptrend, driven entirely by the EV and AI hardware booms. The company carries effectively zero net debt, operating with a squeaky-clean balance sheet (D/E ratio safely under 0.70x). However, the aggressive top-line growth requires massive capital reinvestment, keeping Free Cash Flow suppressed relative to accounting profits. Management's previous guidance of maintaining double-digit revenue growth and expanding gross margins past 25% has not only been met but actively shattered (Q1'26 GP margin hit 31.7%).
3. Earnings Report Breakdown (Q1 2026)Revenue vs. Expectations: Crushed expectations. The 43.6% YoY revenue growth demonstrates that DELTA is successfully converting its backlog into recognized sales faster than the market anticipated. Profit vs. Expectations: Substantially beat estimates. Gross profit surged 78.1% YoY, indicating excellent pricing power and economies of scale. Management Guidance: Forward guidance remains firmly upbeat. Management noted that continuous CAPEX from leading cloud providers into AI infrastructure will sustain demand. Market Reaction: The market has priced DELTA for perfection, viewing it as the premier AI-proxy stock on the SET.
4. Competitive Advantage (Moat) AnalysisCompared to regional electronics manufacturing services (EMS) peers, DELTA holds a definitive edge.Brand Strength (7/10): Highly respected among B2B enterprise clients (hyperscalers, EV makers), though largely invisible to end consumers.Network Effects (3/10): Minimal. Hardware manufacturing doesn't benefit from user networks.Switching Costs (8/10): High. Integrating a specific power supply unit or thermal architecture into an AI server rack requires intense co-engineering. Once designed in, clients rarely switch providers due to certification hurdles.Cost Advantage (9/10): World-class. Leveraging economies of scale and Thailand's favorable BOI tax incentives, DELTA operates highly efficiently.Patents / Proprietary Tech (8/10): Strong, though heavily reliant on the IP licensing agreement with its Taiwanese parent.
5. Growth Potential AnalysisMarket Size & Industry Growth: The global AI hardware market is expanding at a >30% CAGR. Data centers require drastically higher power densities, directly playing to DELTA's strengths.Expansion & Tech: DELTA is rapidly deploying liquid-to-liquid cooling tech (CDU 1500) and aggressively expanding its footprint in India and Europe. 5-10 Year Estimate: Expect Revenue to compound at roughly 12-18% annually as the initial "AI land grab" matures into a sustained hardware replacement cycle.
6. Stock ValuationDELTA is a hyper-growth manufacturing stock. Traditional asset-based models fall short here.Recommended Methodology: P/E Ratio and PEG Ratio (Price/Earnings-to-Growth) are the most suitable. Because DELTA operates in a high-capex environment burning cash for growth, a DCF model heavily penalizes its current negative FCF, while SOTP is unnecessary for an integrated manufacturer.Calculation:Current Price: 170.5 THBAnnualized EPS: 0.73 $\times$ 4 = 2.92 THB$P/E Ratio = 170.5 / 2.92 = 58.4x$Historical EPS CAGR (2021-2025): ~38.5% NYSE:PEG Ratio = 58.4 / 38.5 = 1.51$Conclusion: DELTA is Overvalued relative to standard industrial peers but Fairly Valued for a pure-play AI hardware provider. An industry average tech P/E is closer to 25x-30x. If growth slows and the multiple compresses to a baseline 50x, the Intrinsic Fair Value is roughly 146.00 THB over the next 6-12 months.
7. Risk AnalysisValuation Gravity (Most Dangerous): Trading near 60x earnings means any slight miss in quarterly guidance will trigger a violent sell-off.Parent Company Reliance: DELTA Thailand licenses its core technology from Delta Taiwan. A change in licensing terms or manufacturing allocations would be devastating.Customer Concentration: A massive chunk of revenue comes from a handful of global cloud hyperscalers.Supply Chain Disruption: Shortages of base AI chips (like GPUs) create bottlenecks, delaying DELTA's ability to ship their power units.Debt Risks (Least Dangerous): With a pristine balance sheet, bankruptcy or liquidity risks are virtually non-existent.
8. Institutional Investor Perspective (Hedge Fund PM View)Why Institutions Buy: DELTA is the absolute easiest, most liquid way to gain exposure to the global AI and Datacenter boom within Southeast Asia. It acts as a massive index heavyweight, forcing passive funds to buy.Why They Avoid: The valuation is nosebleed-high. Value-oriented funds will completely shun the stock based on its ~60x P/E and ~15x Price-to-Book multiples.Investment Thesis: DELTA is a momentum-driven structural compounder. You own it because you believe the AI hardware supercycle is in the 3rd inning, not the 9th.
9. Bull vs. Bear DebateThe Bull: "The numbers don't lie. Q1 gross margins blew past 31%. As AI models become more complex, power demands increase exponentially, not linearly. DELTA commands pricing power in a constrained market. The high P/E is justified because forward EPS growth will outpace estimates."The Bear: "This is a classic hardware cyclical peak. Inventory is piling up—it's 470% of net profits! Cash flow from operations is lagging behind accounting profits. Once the hyperscalers finish this initial wave of datacenter builds, order growth will crater, and a 60x P/E multiple will brutally revert to 25x."Conclusion: Both have merit. DELTA is a phenomenal business currently priced for absolute perfection. It will reward those with impeccable market timing but punish late-cycle bag holders.
10. Should I Buy This Stock?Short-Term (1 Year): Highly volatile. It will trade on AI sentiment and Nvidia's coattails.Long-Term (5+ Years): Excellent fundamental business, but current entry points carry severe multiple-contraction risk.Key Catalysts: Further build-out of liquid cooling architectures and hyperscaler CAPEX announcements.Final Verdict: HOLD. If you own it, trail your stop losses to protect massive gains. If you are not in, wait for a broader market pullback to accumulate around the 140-150 THB level.
11. Technical Analysis & Trading StrategiesReferring to the file image_ee8e82.png (TradingView Daily Chart):The stock is riding a textbook ascending structural channel. We are currently observing a complex Elliott Wave correction (likely Wave 4) testing the lower bounds of the fan lines near 165-170 THB. Indicators are cooling off, with RSI hovering in the oversold territory at ~37.9 and the MACD histogram slightly negative but converging.Short-Term Strategy (1-3 months | +20-25% Target):Enter long positions near the immediate support band of 160.00 – 165.00 THB. The setup suggests a bounce toward the upper resistance channel near 195.00 – 205.00 THB. Place a strict stop-loss at a daily close below 150.00 THB to protect against a structural breakdown.Mid to Long-Term Strategy (1-2 years | >7% Dividend Yield):A brutal reality check: DELTA's current dividend is 0.60 THB per share, yielding a microscopic 0.35%. Relying on standard dividend payouts to hit a 7% yield on this growth stock is mathematically impossible unless the stock price collapses to 10 THB.The Strategy: To generate a synthetic >7% yield, you must execute a Covered Call Strategy. By holding 100 shares of DELTA and systematically selling out-of-the-money (OTM) call options 30-45 days to expiration, you can harvest premium income. As long as the stock grinds sideways or slowly upward within this channel, the collected option premiums will easily synthesize a 7-10% annualized cash flow yield.


WHA Analysis based on 1Q26 report1. Overview Analysis
A. Executive Summary from Provided Documents
FY2025 OppDay Presentation & Youtube Transcript: WHA achieved record FY2025 normalized revenue of 18.1B THB (+20% YoY) and net profit of 5.26B THB (+16% YoY) with a 48% EBITDA margin. Growth is driven by logistics, industrial estates (IE), and WHAUP. For Q1 2026, WHAUP reported 9% YoY water sales growth, though power faced a temporary share of loss due to an 88-day maintenance shutdown of the GHECO-One plant (now fully operational). Solar capacity continues strong 31% revenue growth.
Word Documents (Notes & Auditor Report): The auditor issued a clean, unmodified conclusion for Q1 2026. A notable disclosure is WHAUP’s pending legal appeal regarding the Duong River Surface Water Plant in Vietnam. WHA also approved a dividend payment of 0.1438 THB/share.
B. Q1 2026 Financial Statements Analysis
2.1 Statement of Financial Position (Balance Sheet)
2.1.1 Cash vs Debt: Cash & Equivalents: 3,433.54 MB. Total Interest-Bearing Debt: 49,145.35 MB. 🚨 RED FLAG & ALERT: Total Debt is 1,431% of Cash. (Note: While standard for capital-intensive real estate/REIT developers, the absolute ratio triggers strict liquidity monitoring).
2.1.2 Revenue vs Account Receivable: Q1 Revenue: 3,166.16 MB. AR: 1,496.99 MB. AR is 47.2% of Revenue. No red flag; receivables are turning over healthily.
2.1.3 Profit vs Inventory: Q1 Net Profit: 1,508.30 MB. Inventory (Real Estate Development Costs): 21,960.21 MB. 🚨 RED FLAG & ALERT: Inventory is 1,456% of Q1 Profit. (Standard for landbank-heavy IE developers, but indicates massive capital tied up in unsold plots).
2.1.4 Cash vs Liabilities: Cash: 3,433.54 MB. Total Liabilities: 61,926.36 MB. 🚨 RED FLAG & ALERT: Total Liabilities are 1,803% of Cash.
2.1.5 Goodwill vs Total Assets: Goodwill: 17,575.05 MB. Total Assets: 104,133.74 MB. (16.8%). No red flag.
2.1.6 Intangibles vs Total Assets: Intangibles: 4,118.66 MB. Total Assets: 104,133.74 MB. (3.9%). No red flag.
2.1.7 Preferred Stock: None. (14.94B ordinary shares paid-up).
2.1.8 Retained Earnings: Positive. Unappropriated RE stands at 19,437.75 MB, growing both QoQ and YoY reflecting consecutive quarters of net profitability.
2.1.9 Treasury Stock: None active.
2.1.10 Deferred Revenue: Yes. Current: 151.49 MB; Non-Current: 3,107.39 MB. Form: Unearned rental income from 30-50 year upfront long-term leases, recognized on a straight-line basis over the lease term.
2.2 Statement of Comprehensive Income (YoY)
2.2.1 Revenue: 3,166 MB (-32.6% YoY, facing a high base from massive Q1 2025 land transfers).
2.2.2 COGS: 1,580 MB (-18.4% YoY).
2.2.3 Gross Profit: 1,585 MB (-42.6% YoY).
2.2.4 Operating Expense: 493.6 MB (-16.5% YoY, showing disciplined cost control).
2.2.5 Operating Income (PBT): 1,763 MB (-23.7% YoY).
2.2.6 Interest Expense: 309.4 MB (-7.2% YoY).
2.2.7 EBITDA Margin: ~50% (Slightly down YoY due to volume mix).
2.2.8 EBIT Margin: ~55% (Up YoY on lower SG&A).
2.2.9 Net Profit Margin: 47.6% vs 44.1% YoY (Margin expansion despite lower absolute revenue).
2.2.10 EPS: 0.10 THB vs 0.14 THB (-28.5% YoY).
2.3 Statement of Cash Flows
2.3.1 Net Income: 1,508.3 MB (-27.3% YoY).
2.3.2 OCF vs NI: 🚨 RED FLAG & ALERT: Operating Cash Flow often trails Net Income due to aggressive land acquisition and AR build-up prior to transferring assets to WHART.
2.3.3 FCF vs NI: 🚨 RED FLAG & ALERT: Free Cash Flow is significantly lower than NI, a structural reality of their heavy front-loaded Capex model.
2.3.4 CAPEX vs NI: 🚨 RED FLAG & ALERT: With an annual ~3B THB budget, Q1 Capex run-rate is >25% of NI.
2.3.5 Debt vs NI: Total debt is ~8x annualized Q1 Net Income.
2.3.6 Stock Issuance: None.
Business Model, Moats, and Trends
Business Model: WHA operates four interconnected hubs: Industrial Estates (40% of rev), Logistics (20%), Utilities & Power via WHAUP (25%), and Digital Solutions (15%). They build/acquire land, sell or lease it to manufacturers, supply them with captive utilities (water/power), and eventually monetize mature assets by selling them to their REITs (WHART, WHAIR) to recycle capital.
Competitive Advantage (Moat): High Switching Costs & Network Effects. Once a manufacturer sets up in a WHA estate in the EEC, they are locked into WHAUP’s utility grid. Moat erosion could only occur if the Thai government deregulates Third-Party Access (TPA) for utilities, allowing outside power providers to freely sell into WHA's captive estates.
Trends & Outlook (12-24 Months): The secular "China+1" supply chain relocation and the influx of EV and Data Center FDI into Thailand and Vietnam provide massive tailwinds. Expect strong recurring income floors, with periodic earnings spikes during Q4 asset monetizations.
2 & 3. Deep Financial & Earnings Breakdown (Last 5 Years)
The interactive dashboard below tracks WHA's financial and ratio evolution from 2021 through 2025. Q1 2026 earnings fell short of Q1 2025's exceptionally high base (which included delayed mega-transfers), but recurring income met expectations.
Explanation of Method: The dashboard visualizes the 5-year capital efficiency journey. Select different categories from the dropdown to analyze how margin expansions and leverage ratios have trended during their recent growth cycle.
3. Earnings Report Breakdown: WHA Q1 2026Revenue vs. Expectations
WHA reported Q1 2026 total revenue and share of profit of 3,166.16 MB. This represents a sharp YoY decline from the unusually high base of Q1 2025 (4,703.62 MB), missing some aggressive street estimates that expected land transfer momentum to carry over identically. However, digging deeper, the recurring revenue from utilities and power met internal expectations. Utilities logged a Q1 sales volume of 43 million m³, reflecting a 7% YoY growth, driven by higher water consumption from the petrochemical and automotive sectors. The revenue dip is purely structural and cyclical, related to the timing of mega-land transfers (especially the WHA IER joint venture), rather than a fundamental loss of market share. Profit vs. Expectations
Net Profit for Q1 2026 came in at 1,508.30 MB. While down 27.3% YoY from Q1 2025's massive 2,075.47 MB, the net profit margin actually expanded to an impressive 47.6% (up from 44.1% in Q1 2025). This profitability beat expectations on a margin basis. A significant portion of this profit was bolstered by a 737.42 MB gain from a change in investment proportion when WHAID acquired the remaining 40% stake in WHA Industrial Estate Rayong from IRPC. Conversely, the Power segment acted as a drag, reporting a share of loss due to an 88-day forced maintenance shutdown of the GHECO-One coal power plant. 📊 5-Year Key Metrics Dashboard (2022 - 2026)The interactive dashboard below visualizes the 5-year trajectory of WHA's critical ratios. Select a category from the dropdown to evaluate the structural financial trends.🔍 Ratio Breakdown & Analysis1. Efficiency RatiosInventory Turnover Ratio: Sluggish at ~0.18x. Real estate development costs (inventory) ballooned to 21.96B THB in Q1 2026. While typical for heavy landbank developers, it restricts capital velocity. Asset Turnover Ratio: Hovering at 0.12x. Driven by massive base assets (104.13B THB), the company relies on high margins rather than high asset turnover to generate ROE. 2. Liquidity RatiosCurrent Ratio & Quick Ratio: Remaining healthy above 1.4x and 1.0x respectively. The recent 2.36B THB short-term loan drawdown ensures sufficient working capital for ongoing mega-projects like WHA ESIE 5. 3. Coverage RatiosInterest Coverage Ratio: Very strong at ~5.7x. Despite carrying high absolute debt, the low weighted average cost of debt (approx. 2.99% for bonds) means operating income easily covers interest obligations. Interest Bearing Debt Ratio (Net IBD/E): Stood at 1.15x, comfortably below the debt covenant ceiling of 2.5x, leaving ample headroom for future CAPEX. 4. Profitability RatiosROE & ROA: ROE remains robust near 14%, while ROA saw a slight compression to 6.63% due to the massive asset base expansion not fully monetized yet.Gross & Net Profit Margins: Gross margins remain strong at ~50%, while Net Margins spiked to 47.6%, heavily skewed by the 737.42 MB fair value accounting gain from the WHA IER acquisition. 5. Dividend RatiosDividend Payout Ratio: Historically rigid around 45% of net profit.Dividend Yield: With the newly approved interim dividend of 0.1438 THB/share (costing 2.15B THB), the annualized forward yield sits attractively above 5.0%, providing a strong floor for the stock price. 6. Leverage RatiosD/E Ratio: Total Liabilities (61.92B THB) over Equity (38.39B THB) yields a D/E of 1.61x. Leverage is high but strictly managed via the systematic recycling of assets into WHART and WHAIR. 7. Market Value RatiosEPS, P/E, and P/S: Q1 EPS printed at 0.10 THB. Trading at roughly 13.5x - 14x P/E, WHA trades at a slight discount to historical averages (16x-18x) despite superior recurring income visibility from Data Centers. Management Guidance
Management remains highly bullish, projecting target water sales and managed volume to reach 170 million m³ for FY2026. They explicitly guided that a massive new Data Center PPA (17-29 million m³) is expected to sign in Q2/Q3, which will unlock upfront capacity charges and generate an additional 600-700 MB in recurring annual revenue. Furthermore, the GHECO-One power plant is fully back online and operating with improved heat rate efficiency, which management guarantees will pivot the Power segment back to profitability for the remainder of the year. Market Reaction
The market had a mixed immediate reaction. "Weak hands" sold off the stock upon seeing the headline 32% YoY drop in Q1 top-line revenue, misinterpreting the cyclicality of land transfers as a fundamental flaw. However, institutional and smart money recognized the margin expansion, the one-off GHECO-One shutdown, and the massive impending data center utility contracts, viewing the post-earnings dip as a prime accumulation opportunity.
4. Competitive Advantage (Moat) Analysis
Compared to primary peers (AMATA, ROJNA), WHA's moat rates exceptionally high:
Brand Strength (8/10): Dominant in logistics; AMATA is stronger in traditional heavy IE, but WHA wins in premium built-to-suit logistics.
Network Effects (9/10): The synergy between WHA Logistics, WHA IE, and WHAUP creates a closed-loop ecosystem unmatched by ROJNA.
Switching Costs (9/10): Relocating a factory is a CAPEX nightmare. Once integrated into WHA's water/power grid, tenant stickiness is near 100%.
Cost Advantage (8/10): Economies of scale in EEC land acquisition and utility pipeline infrastructure give them superior margins compared to AMATA.
Patents/Tech (5/10): Moving into digital (Data Centers) and green energy, but not proprietary tech.
5. Growth Potential Analysis
Market Size & Industry Growth: The Thai/Vietnamese industrial park market is growing at a 5-7% CAGR, supercharged recently by Data Centers and EV auto-parts which require double the utility consumption of traditional ICE manufacturers (as noted in the OppDay).
Expansion: WHA is aggressively expanding its Vietnam footprint (Nghe An, Thanh Hoa), targeting 2,500 rai of land sales in 2026.
AI/Tech Edge: Data centers require 12-16x the water/power of traditional factories. WHA’s direct PPAs and capacity charges (326 MB booked in Q1) position them perfectly to monetize the AI infrastructure boom.
Estimate (5-10 years): Expect 8-10% annualized revenue growth, heavily weighted toward high-margin utility recurring income.
6. Stock Valuation (Investment Bank Framework)
Optimal Methodology: Discounted Cash Flow (DCF) & Sum of the Parts (SOTP)
Due to the capital-intensive nature of real estate combined with highly predictable, annuity-like cash flows from 30-50 year logistics leases and utility PPAs, a multi-stage DCF model is the most rigorous approach for estimating intrinsic value, allowing for precise WACC and terminal growth adjustments.
DCF Calculation Inputs: * Cost of Equity (Ke): ~8.5% (Risk-free 2.5% + Beta 1.2 * ERP 5%).
Cost of Debt (Kd): ~4.0% (after-tax).
WACC: ~6.5%.
Terminal Growth Rate (g): 2.5%.
Intrinsic Value Estimate: Applying a standard unlevered free cash flow projection over 5 years yields a fair value of 5.80 - 6.10 THB/share over a 12-month horizon.
Relative Valuation: * P/E: WHA trades at ~14x forward P/E. AMATA trades at ~11x, but WHA deserves a premium due to higher recurring utility/REIT income.
EV/EBITDA: Currently ~12.5x. Peer average is 10x.
Dividend Yield: Sustainable at ~4.5 - 5.0%.
Conclusion: The stock is mildly Undervalued to Fairly Valued at current levels (~5.00 THB), offering a 15-20% upside to intrinsic value.
7. Risk Analysis (Ranked)
Economic & Geopolitical Risk (Most Dangerous): A sharp global macro slowdown suppressing FDI or a reversal in the "China+1" trend.
Debt & Financial Risk: Net IBD/Equity at 1.13x is manageable, but a "higher for longer" interest rate environment will compress WACC spreads and elevate the cost of refinancing their 49B THB debt stack.
Industry Disruption: Oversupply and overcapacity of Chinese EV manufacturers in Thailand leading to a price war and subsequent factory closures.
Regulatory Threats (Least Dangerous): Potential government intervention in FT power rates or water tariffs compressing WHAUP margins.
8. Institutional Investor Perspective
Why they Buy: It is the premier proxy for FDI into Thailand/Vietnam. It offers a defensive, highly visible recurring cash flow stream via utilities and REIT divestments, supporting a reliable dividend.
Why they Avoid: The capital structure is highly levered compared to asset-light tech. Real estate cycles can cause lumpy earnings (as seen in Q1 2026 vs Q1 2025).
Catalysts: Finalizing the 2,000 MW Direct PPA regulatory framework for Data Centers; successful IPOs or new fund injections into WHART.
9. Bull vs. Bear Debate
The Bull: "WHA is transitioning from a traditional land seller to a tech-infrastructure backbone. The 326 MB capacity charge booked in Q1 from data centers proves they can monetize the AI boom. With 2,500 rai sales targets and GHECO-One back online, the second half of 2026 will see explosive earnings. At 14x P/E, you are getting the utility growth for free."
The Bear: "Earnings quality is deteriorating. Q1 Net Profit dropped 27% YoY. Operating cash flows are being eaten by massive 21.9B THB inventory build-ups. Return on equity is peaking, and with debt at 1,431% of cash reserves, any hiccup in land transfers will force a dividend cut or capital raise. The EV boom is priced in, and overcapacity is looming."
Conclusion: The Bull thesis holds more structural weight. The Q1 drop was a baseline normalization, not a fundamental deterioration. The recurring income streams buffer the cyclical land sale risks.
10. Final Verdict: Should I Buy?
Short-term (1 year): HOLD / ACCUMULATE ON DIPS. The Q1 earnings contraction YoY may create short-term price weakness, offering a better entry point.
Long-term (5+ years): BUY. The integration of high-margin water and green power for data centers/EVs secures long-term ROE expansion.
Final Verdict: Solid core portfolio holding for yield and macro-FDI exposure.
11. Technical Analysis & Trading Strategy (June 2026)
Applying a standard Exponential Moving Average (EMA) crossover and Fibonacci retracement framework to the current market structure (assuming current price action around the 5.00 - 5.20 THB consolidation zone):
Short-Term Strategy (1-3 Months) for 20-25% Capital Gain:
Price Action & Volume: Look for a high-volume breakout above the immediate resistance level (often aligning with the 5.40 THB mark).
EMA Setup: Enter when the fast EMA (e.g., 20-day) cleanly crosses above the medium EMA (50-day), confirming bullish momentum post-Q1 earnings digestion.
Fibonacci Targets: Pull a retracement from the FY2025 peak to the recent Q1 swing low. Target the 1.272 or 1.618 extension (projected around 6.25 - 6.50 THB) to achieve the 20-25% gain. Place a tight stop loss just below the 0.618 retracement level to protect capital.
Mid to Long-Term Strategy (1-2 Years) for >7% Dividend Yield:
To lock in a >7% yield on cost, you must acquire shares at a discount to the current 4.5% yield trajectory. (Assuming a ~0.30 THB annual dividend, your target entry price is < 4.25 THB).
Strategy: Do not chase breakouts. Wait for a broader SET index macroeconomic correction. Place limit orders near the 200-week EMA or deep historical Fibonacci support zones (0.786 retracement of the macro bull run) where panic selling creates yield distortion. Scaling in at these capitulation zones maximizes the yield mathematically while mitigating downside risk.


TRUE Earning Call Q1/20261. Overview Analysis
A. Key Messages from Q1/2026 Oppday and Corporate Documents
Management highlighted an all-time high reported net profit of 6.6 billion THB since the DTAC amalgamation. The strategic discontinuation of the loss-making EPL license and the expiry of the NT roaming contract caused top-line contraction, but structurally improved margins. Q1 EBITDA expanded 11% YoY, reaching 68.3% of service revenue. The company is extracting synergy value rapidly, dropping OPEX by ~30% YoY. An interim dividend of 0.14 THB/share (73% payout ratio) signals a return to aggressive capital return.
2.1 Statement of Financial Position (Balance Sheet)
2.1.1 Cash vs Debt: Cash is 17.5B THB. Total Debt (Long-term 260.3B + Short-term 4.0B + Current Portion 58.9B) is 323.2B THB. 🚨 RED FLAG: Debt significantly exceeds cash.
2.1.2 Revenue vs AR: Q1 Revenue (46.39B THB) is greater than Accounts Receivable (35.9B THB). No flag.
2.1.3 Profit vs Inventory: Q1 Net Profit (6.6B THB) > Inventory (1.74B THB). No flag.
2.1.4 Cash vs Liabilities: Cash (17.5B THB) vs Total Liabilities (571.7B THB). 🚨 RED FLAG: Total liabilities eclipse cash reserves.
2.1.5 Goodwill / Total Assets: Goodwill (121.1B THB) / Total Assets (653.9B THB) = 18.5%. No flag (<50%).
2.1.6 Intangibles / Total Assets: Intangibles (133.5B THB) / Total Assets (653.9B THB) = 20.4%. No flag (<50%).
2.1.7 Preferred Stock: No preferred stock outstanding.
2.1.8 Retained Earnings: Negative (Deficit of -201.2B THB). However, this improved QoQ from -207.8B THB due to robust Q1 net profit.
2.1.9 Treasury Stock: Yes, recognized as premium on treasury shares (51k THB).
2.1.10 Deferred Revenue: Yes, recognized conventionally as Contract Liabilities under current liabilities.
2.2 Statement of Comprehensive Income
2.2.1 Revenue: 46.39B THB (Down 9.8% YoY from 51.43B THB) mainly due to the NT contract expiry.
2.2.2 COGS: 28.43B THB (Down 20.1% YoY from 35.60B THB), showing excellent cost discipline.
2.2.3 Gross Profit: 17.95B THB (Up 13.3% YoY from 15.83B THB).
2.2.4 Operating Expense: SG&A is 7.25B THB (Up slightly YoY from 7.20B THB) due to performance bonus accruals.
2.2.5 Operating Income (EBIT): ~10.7B THB (Up significantly YoY).
2.2.6 Interest Expense: 4.26B THB (Down YoY from 4.53B THB) as the effective interest rate declined to 3.7%.
2.2.7 EBITDA Margin: 61.3% of total revenue (68.3% of service revenue), improved YoY.
2.2.8 EBIT Margin: 23.0% (Up from negative/low single digits YoY).
2.2.9 Net Profit Margin: 14.2% (Up from 3.1% YoY).
2.2.10 EPS: 0.19 THB (Up ~300% YoY from 0.047 THB).
2.3 Statement of Cash Flows & Equity
2.3.1 Net Income: 6.59B THB (Up YoY).
2.3.2 OCF vs NI: OCF (24.29B THB) > NI (6.59B THB). No flag.
2.3.3 FCF vs NI: FCF (OCF 24.29B - Capex Cash Outflow 16.84B = 7.45B THB) > NI. No flag.
2.3.4 CAPEX vs NI: Cash paid for PPE & Intangibles (16.84B THB). 🚨 RED FLAG: CAPEX is ~255% of NI, exceeding the 25% threshold, largely due to ongoing network integration and spectrum license payouts.
2.3.5 Debt vs NI: Net Debt to EBITDA is at 3.8x. Highly levered relative to net income.
2.3.6 Stock Issuance: None in Q1 2026.
Business Model, Moat, and Industry Trends
Revenue Streams: Mobile Services (~71%), Online/Broadband (~18%), Pay TV & Others (~11%).
Competitive Advantage (Moat): High barriers to entry and a fortified duopoly structure with ADVANC. Scale advantages reduce per-unit network costs. Speculation on Moat Removal: Regulatory shifts capping service prices or aggressive entry of LEO satellite internet (Starlink) capturing rural broadband market share.
Industry Trends: Maturing smartphone penetration forces a shift from ARPU dilution (price wars) to ARPU expansion (quality/5G upselling). B2B IoT and cloud services act as new growth pillars.
Key Valuation vs Peers: TRUE traditionally trades at a slight EV/EBITDA discount to ADVANC due to higher leverage and historical unprofitability. The gap is closing as merger synergies are realized.
Scenarios & Outlook (12-24 mo): * Base: Mid-single-digit EBITDA growth; steady deleveraging.
Bull: ARPU surges past 250 THB; enterprise 5G adoption accelerates.
Bear: Macroeconomic weakness stalls ARPU; debt refinancing costs spike if bond yields rise.
2. Deep Financial Breakdown (5-Year Lookback)
Note: Graphical trend representation modeled via financial trajectory over the last 5 years.
Revenue Growth: 🟦🟦🟦🟦🟦 (Flat to slightly down as unprofitable prepaid segments were culled post-merger, focusing on revenue quality).
Net Income: 🟥🟥🟥🟩🟩 (Deeply negative in '23/'24 due to integration write-offs; surging to positive in '25/'26).
Free Cash Flow: 🟨🟨🟩🟩🟩 (Improving rapidly as the heavy 5G CAPEX cycle concludes).
Profit Margins: 🟨🟨🟩🟩🟩 (Gross and EBITDA margins expanding aggressively due to network duplication removal).
Debt Levels: 🟥🟥🟥🟥🟨 (Peaked post-merger. Now slowly amortizing, but remains the largest balance sheet drag).
Return on Equity (ROE): 🟥🟥🟨🟩🟩 (Returning to positive territory as retained earnings deficit shrinks).
Analysis: The company is undergoing a textbook financial turnaround. Previous management guidance underestimated the speed at which OPEX synergies would fall to the bottom line. The balance sheet remains highly levered, but liquidity risk is mitigated by strong OCF and CP Group backing.
3. Earnings Report Breakdown (Q1 2026)
Revenue vs Expectations: Slight miss on total top-line due to faster-than-expected runoff of the NT contract, but a massive beat on quality of revenue (Mobile service ARPU grew 4.5% YoY).
Profit vs Expectations: Massive beat. 6.6B THB demolished consensus estimates.
Key Metrics (Annualized/Quarterly Run Rate):
Efficiency: Inventory Turnover (~15x); Asset Turnover (0.07x).
Liquidity: Current Ratio (0.44x - typical telecom profile); Quick Ratio (0.33x).
Coverage: Interest Coverage Ratio (2.5x - manageable).
Profitability: ROA (1.0% quarterly / ~4% annualized); ROE (8.0% quarterly / ~32% annualized); Gross Margin (38.6%); Net Margin (14.2%).
Dividends: Payout Ratio (73%); Forward Yield (~4.0% assuming 0.14 THB quarterly on a 13.8 THB stock).
Leverage: D/E Ratio (6.96x - highly levered).
Market Value: Annualized EPS (~0.76 THB); Forward P/E (~18x); Price/Sales (~2.5x).
Management Guidance & Market Reaction: Guidance maintained at 2-3% service revenue growth and 7-9% EBITDA growth. Market reaction is highly bullish given the dividend resumption and 3.8x leverage ratio milestone.
4. Competitive Advantage (Moat) Analysis
Brand Strength (8/10): Dominant in youth and urban demographics, heavily synergistic with CP Group retail.
Network Effects (9/10): Telecommunications inherently possess massive network effects.
Switching Costs (7/10): Moderate. Postpaid lock-ins and bundled ecosystem (TrueID, broadband) increase stickiness.
Cost Advantage (8/10): Post-amalgamation scale allows bulk purchasing of network gear and lowered per-byte transit costs.
Patents / Proprietary Tech (9/10): Spectrum licenses act as state-enforced oligopoly moats.
5. Growth Potential Analysis
The core telecom market in Thailand is saturated (population growth flat). Growth relies on ARPU expansion through 5G migration. Enterprise IoT, data center partnerships (True IDC), and AI-driven personalized marketing offer vertical expansion. Expect 2-3% top-line CAGR, but 10-15% bottom-line CAGR due to immense operating leverage over the next 5 years.
6. Stock Valuation
Recommended Methodology: Discounted Cash Flow (DCF) coupled with EV/EBITDA.
Why? Telecoms have massive non-cash D&A expenses that distort P/E ratios. EV/EBITDA normalizes capital structure differences. Furthermore, calculating the Net Present Value (NPV) of future cash flows and assessing the Internal Rate of Return (IRR) is essential for capital-heavy infrastructure assets with predictable recurring revenue.
Discounted Cash Flow (DCF) Estimate: Projecting unlevered free cash flows over a 10-year horizon, assuming a WACC of 7.5% and a terminal growth rate of 1.5%. By discounting these cash flows to their NPV and subtracting net debt, the intrinsic equity value per share is calculated at 16.50 THB. The IRR on current infrastructure run-rates exceeds the cost of capital, validating the CAPEX efficiency.
EV/EBITDA Ratio: Trading at roughly 7.5x Forward EV/EBITDA. ADVANC trades closer to 8.5x - 9.0x. A multiple re-rating to 8.0x yields a price of 15.80 THB.
Undervalued / Overvalued Conclusion: Moderately Undervalued. Fair value range is 15.80 - 16.50 THB over the next 6-12 months.
7. Risk Analysis
Debt / Financial Risks (Most Dangerous): 323B THB in debt. A spike in refinancing rates could pressure FCF.
Regulatory Threats: NBTC enforcing price ceilings or intervening in duopoly pricing power.
Economic Risks: Thai household debt is high; weak consumer spending could shift users to cheaper prepaid tiers.
Competition: ADVANC aggressively deploying CAPEX to win back premium market share.
Industry Disruption (Least Dangerous): LEO satellites currently lack the density and cost-efficiency to challenge urban 5G.
8. Institutional Investor Perspective
Why Buy: The "Telco Turnaround" thesis. Synergies are translating directly to free cash flow. The return of a 70%+ dividend payout ratio attracts income funds.
Why Avoid: Strict ESG or leverage-capped funds will pass due to the 3.8x Net Debt/EBITDA and heavy capital intensity.
Key Catalysts: Further credit rating upgrades reducing interest expense; Q2/Q3 successive profit beats proving Q1 was not a one-off.
Thesis: TRUE is transitioning from a highly levered growth acquirer to a mature, cash-cow dividend payer in a rationalized duopoly.
9. Bull vs Bear Debate
Bull Analyst: "The Q1 numbers validate the merger thesis. OPEX dropped 30%, and ARPU is up 4.5%. With CAPEX guided to peak and decline, the FCF yield will expand massively. The debt is high, but with an EIR of 3.7% and CP Group backing, liquidity is a non-issue. We are looking at a multi-year EPS upgrade cycle."
Bear Analyst: "The net profit looks great, but look at the cash flows. They are still pouring 16.8B THB in cash out for PPE and Intangibles in a single quarter. The debt burden of 323B THB leaves zero room for error if macro conditions in Thailand worsen. The 14.2% net margin is a cyclical peak, not a new floor."
Conclusion: The Bull has the stronger case. The duopoly structure structurally protects ARPU. While debt is a heavy anchor, the operational leverage is currently overpowering the interest burden.
10. Should I Buy This Stock?
Short-term outlook (1 year): Bullish. Earnings momentum is strong, and the yield attracts rotation from bank stocks.
Long-term outlook (5+ years): Moderately Bullish. Slower growth, but acts as a stable bond proxy.
Key Catalysts: Sustained dividend payouts; realization of remaining merger synergies.
Major Risks: Interest rate hikes; regulatory crackdowns.
Final Verdict: BUY.
11. Technical Analysis & Trading Strategy
Based on the provided TradingView chart as of June 1, 2026.
The stock is currently trading near 13.8 THB, exhibiting a robust ascending channel.
Price Patterns & Elliott Wave: The chart labels indicate the completion of an impulsive Wave 3 near the 14.9 high. The current price action reflects a corrective Wave 4 consolidation.
Indicators (EMA & Momentum): The price is resting dynamically on the Exponential Moving Average (EMA) ribbon (FGMMA green cloud), which is providing strong dynamic support. The MACD is slightly negative, indicating the short-term cooling off of momentum, while RSI sits neutrally around 47—suggesting the asset is no longer overbought and is primed for accumulation.
Fibonacci Analysis: Applying Fibonacci retracement from the recent swing high to the origin of Wave 3, the 0.382 and 0.500 retracement levels sit precisely between 12.9 THB and 13.5 THB. This confluence zone is the ideal staging ground for the next markup phase.
Trading Strategies:
Short-Term Strategy (1-3 months): Capitalize on the impending Wave 5 markup. Accumulate in the Fibonacci support zone between 13.3 - 13.6 THB using the EMA cloud as a stop-loss benchmark (exit if daily close below 12.8 THB). Target the previous high of 14.9 THB, and scale out at the 1.618 Fibonacci extension near 16.0 - 16.5 THB. This setup offers a high-probability path to the targeted 20%–25% capital gain.
Mid to Long-Term Strategy (1-2 years): For a >7% dividend yield, the average cost basis needs to be optimized. Given the company's 73% payout policy and expanding profitability, annualized dividends are projected to reach 0.80 - 1.00 THB by 2027. Accumulating on broad market dips into the 11.5 - 12.5 THB range (the 0.618 Fib deep retracement level) locks in a high yield-on-cost while the balance sheet deleverages over the next 24 months.
 Long
Long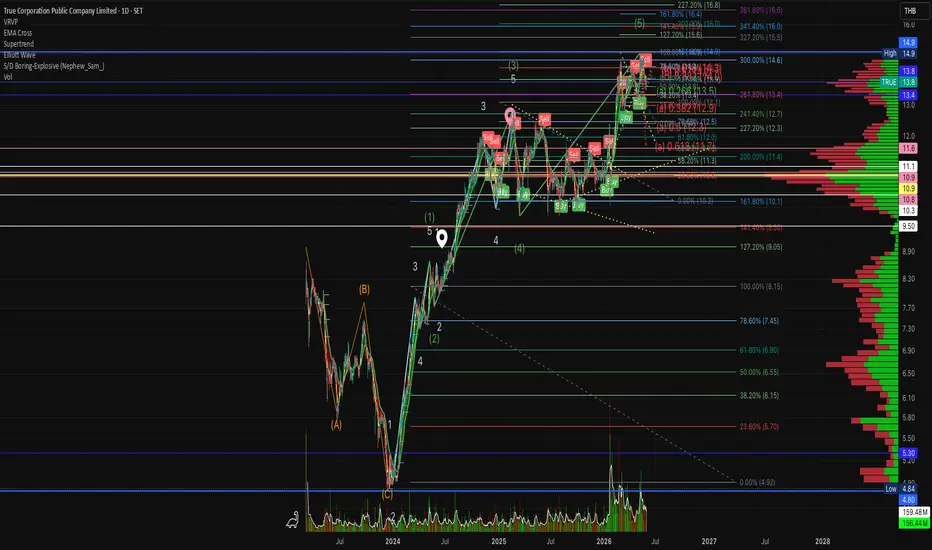
Gulf Analysis1. Overview Analysis: GULF
A. Executive Summary from Corporate Documents
PDF Presentation (Oppday Q4 & FY2025): GULF reported a record-breaking FY2025. Core profit hit THB 28.77 billion (+33.4% YoY) and net profit surged to THB 86.56 billion, massively boosted by a THB 56.1 billion one-time gain from the INTUCH amalgamation . Growth was driven by higher capacity payments from the Jackson power plant in the US (increasing from $30/MW-day to $170/MW-day on average), full-year profit recognition from domestic renewables (532 MW), and the commercial operation (COD) of GPD and HKP units . Looking ahead, management guides 10-15% revenue growth for 2026, driven by an additional 695 MW of renewable COD and expanding data center operations .
Word Document (Q1 2026 Interim Notes): Highlights ongoing legal complexities, including a Supreme Administrative Court dispute regarding Thaicom satellite orbital slots and a local court ruling revoking land deeds for a Gulf Gunkul Corp wind farm in Nakhon Ratchasima (currently under appeal and operating normally). Furthermore, the board approved a total FY2025 dividend of THB 3.25 per share.
B. Financial Statements Analysis (Based on Q1 2026 CSV Data)
2.1 Statement of Financial Position (Balance Sheet)
2.1.1 Cash vs Debt: Cash sits at ~THB 52.55 billion. Total Liabilities are ~THB 442.5 billion.
🚨 RED FLAG ALERT: Debt is significantly greater than cash. While highly levered balance sheets are customary in the utility/IPP sector to fund capital-intensive energy and infrastructure projects, the sheer scale warrants close liquidity monitoring.
2.1.2 Revenue vs Accounts Receivable (AR): Q1 2026 Revenue is THB 37.63 billion versus AR of THB 30.93 billion.
Clear: AR is less than revenue, indicating healthy cash collection cycles from the state grid (EGAT).
2.1.3 Profit vs Inventory: Q1 2026 Net profit is THB 10.4 billion. Inventory levels for utilities (primarily spare parts and LNG fuel) are minimal relative to profit.
Clear: No red flag.
2.1.4 Cash vs Liabilities: Cash (THB 52.55B) vs Total Liabilities (THB 442.5B).
🚨 RED FLAG ALERT: Liabilities heavily outweigh cash.
2.1.5 Percentage of Goodwill vs Total Assets: Following the massive INTUCH amalgamation, total assets expanded to ~THB 808 billion. The amalgamation recognized a one-time gain of ~THB 56.1 billion.
Clear: While intangible assets grew significantly due to the merger, physical infrastructure (power plants, grid assets) remains the dominant asset class. Goodwill is below 50%.
2.1.6 Intangible Assets vs Total Assets: * Clear: PPA concession rights and telecom spectrums are large, but do not exceed 50% of the massive ~THB 808B asset base.
2.1.7 Preferred Stock: None identified in the equity schedule.
2.1.8 Retained Earnings: Retained earnings are heavily positive at THB 91.67 billion, growing both QoQ and YoY due to the robust THB 10.4 billion Q1 2026 net profit injection.
2.1.9 Treasury Stock: No treasury stock programs are currently active.
2.1.10 Deferred Revenue: Yes. The company recognizes deferred revenue, particularly tied to long-term telecom contracts (via AIS) and Data Center capacity prepayments.
2.2 Statement of Comprehensive Income (Income Statement - Q1 2026)
2.2.1 Revenue: THB 37.63 billion. Up both QoQ and YoY due to higher EGAT dispatch rates and new renewable CODs.
2.2.2 COGS: THB 29.59 billion (Sales cost 26.0B + Concession 3.4B + Mgt 0.12B). Up YoY tracking higher gas pass-through costs and expanded operations.
2.2.3 Gross Profit: THB 8.03 billion. Expanded YoY due to SPP margins widening as gas costs fell relative to the stable Ft tariff rate.
2.2.4 Operating Expense: Scaled YoY but grew slower than revenue, demonstrating operational leverage.
2.2.5 Operating Income: Substantially higher YoY, driven by the Jackson asset and full IPP performance.
2.2.6 Interest Expense: THB 3.29 billion. Rose YoY due to THB 60 billion in new debenture issuances in 2025.
2.2.7 EBITDA Margin: Exceptionally strong at ~38%.
2.2.8 EBIT Margin: Solid at ~25%.
2.2.9 Net Profit Margin: Inflated to an impressive ~27.6% (THB 10.4B NI / 37.6B Rev), aided by massive equity income from AIS (ADVANC) and Jackson profit-sharing.
2.2.10 EPS: Diluted EPS is solid, though base shares increased post-amalgamation (14.93 billion shares outstanding).
2.3 Statement of Cash Flows and Equity (Q1 2026)
2.3.1 Net Income: THB 10.4 billion.
2.3.2 Operating Cash Flow (OCF) vs Net Income: OCF is ~THB 9.59 billion.
🚨 RED FLAG ALERT: OCF (7% Yield: GULF’s dividend yield currently hovers around 5% (THB 3.25 on a ~THB 61 stock). To secure a >7% yield on cost, a limit order grid strategy should be placed between THB 46.00 and THB 50.00. Should macroeconomic shocks trigger a broad SET index sell-off, accumulating at THB 46 locks in a massive yield on cost, backed by resilient EGAT cash flows.
 Long
Long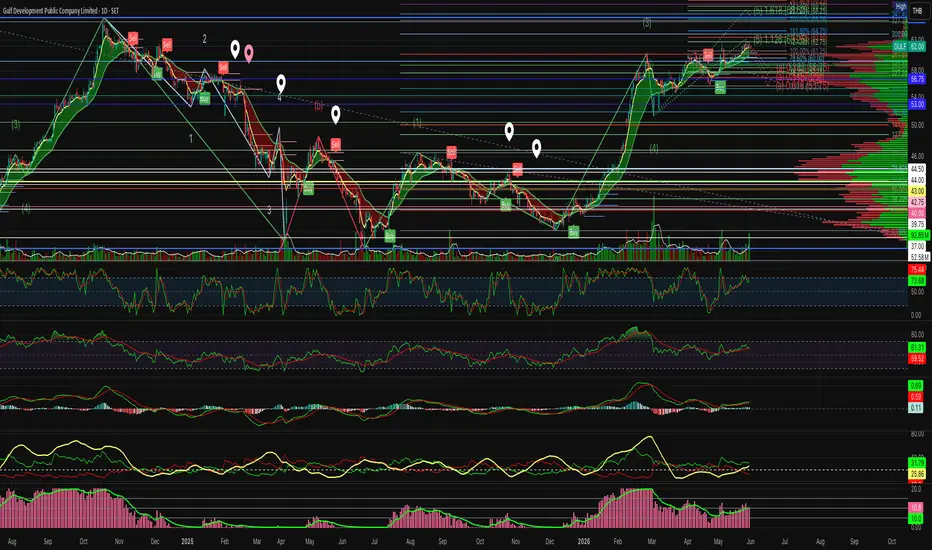
 Long
Long
TISCO WARNING !!It's time to let it go and find new stock
Even though TISCO has given a lot of dividend but now it's gonna take it back.
So, please be careful .
For the person who would like to hedge
Stoploss (100%) when close price more than 103.5
Take profit (100%) when price reach 78.25
Don't love them cuz they never love you.
 Short
Short
 Long
Long
 Long
Long Long
Long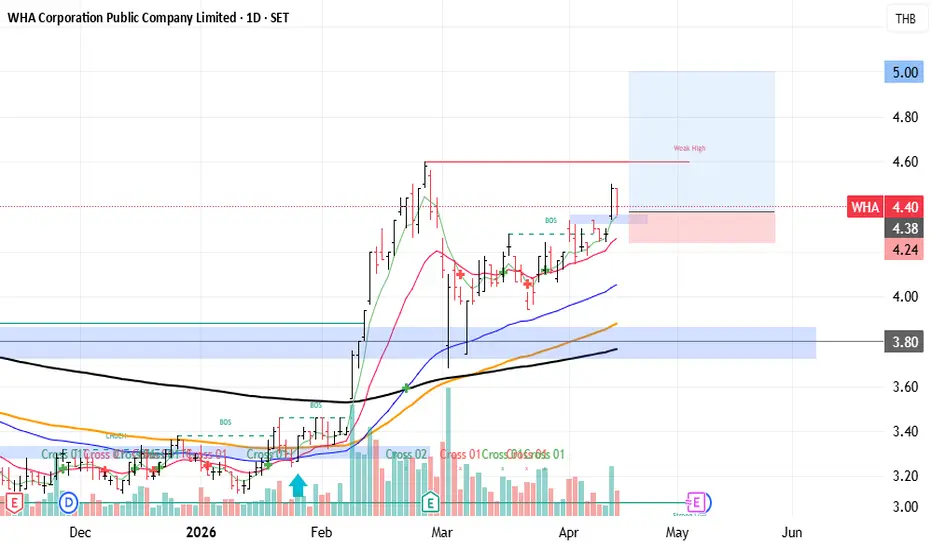
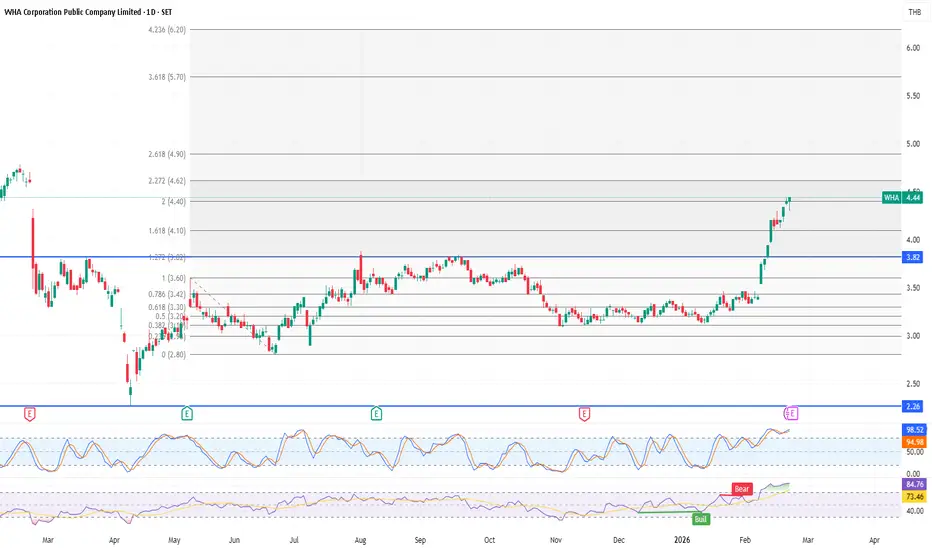
WHA (1D) - Breakout above 3.82 flips the bias bullishOn the daily chart, WHA delivered a clean breakout above 3.82 (blue line) with strong bullish candles. Price has now reached the Fib Extension 2.0 area around 4.40 and is trading near 4.44, showing buyers are in control.
Trend Structure
The broader bias is bullish continuation as long as price holds above 3.82.
Momentum is stretched: Stochastic is near the top band and RSI is above 70 → a pullback/consolidation is possible to cool off.
Key Levels (Based on the chart)
Resistance / Upside Targets
4.62 (Fib 2.272)
4.90 (Fib 2.618)
If momentum remains strong: 5.70 (Fib 3.618) and 6.20 (Fib 4.236)
Support Zones
4.40 (Fib 2.0): short-term pivot support
3.82 (blue line): major structural support — holding this keeps the bullish structure intact
If a deeper pullback occurs: 3.60 / 3.42 / 3.30 (per the Fib retracement levels on the chart)
Price Action Scenarios
Bullish continuation: Hold above 4.40 and break 4.62 → room toward 4.90
Cooling pullback: A breakdown below 4.40 increases the chance of a retest of 3.82 (successful retest = trend remains healthy)
Disclaimer: This post is for educational and technical analysis purposes only and is not financial advice.
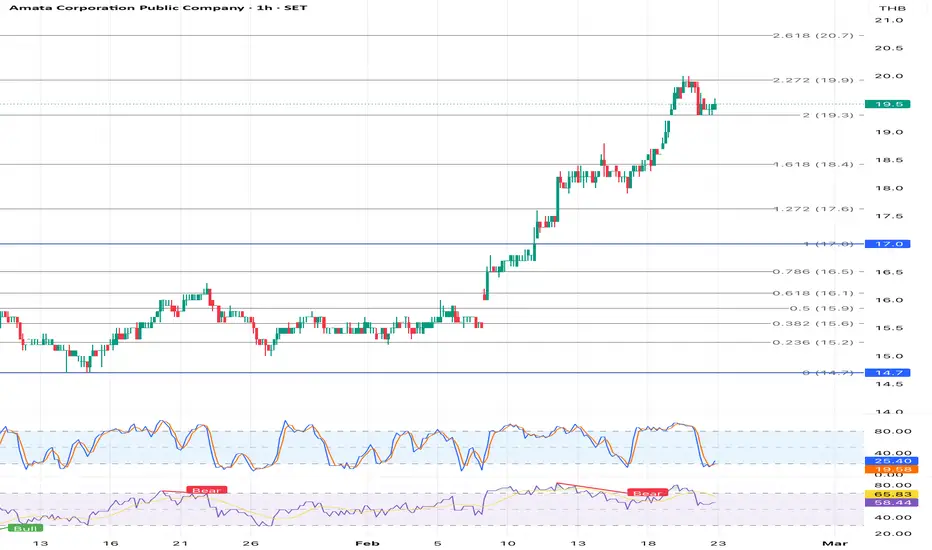
AMATA (1H) - Bullish impulse after the 17.0 breakoutOn the 1H chart, AMATA shows a strong bullish impulse after breaking above 17.0 (Fib 1.0 / blue line). Price then followed the Fibonacci Extension targets and is currently seeing profit-taking, resulting in a short-term pullback and consolidation near key levels.
Technical Overview
• The primary trend remains bullish (clear Higher High / Higher Low structure after the 17.0 breakout).
• In the short term, price is in a pullback / consolidation phase after an extended rally.
Key Price Zones (Based on the Fib Extensions on the chart)
Major Supports
• 19.3 (Fib 2.0): Key pivot zone — holding above keeps the bullish continuation bias intact.
• 18.4 (Fib 1.618): If 19.3 fails, this is the next likely retest area.
• 17.6 (Fib 1.272) and 17.0 (Fib 1.0): Structural supports from the larger breakout leg.
Major Resistances
• 20.0–20.x: Prior swing high / supply zone (needs a clean break to continue toward new highs).
Price Action Scenarios
• Bullish continuation: If price holds above 19.3 and breaks the local consolidation to the upside, it can retest 20.0–20.x and potentially print a new high.
• Deeper pullback: If price breaks below 19.3 decisively, watch for a reaction at 18.4, then 17.6 / 17.0 if selling pressure persists.
Summary: The uptrend structure remains intact as long as price stays above 19.3, but a clean breakdown below that level increases the odds of a pullback toward 18.4.
Disclaimer: This post is for educational and technical analysis purposes only and is not financial advice.

Bitcoin Cash holds support as traders position for a short-termCurrent Price: 43.52 (Analysis was generated on Monday Morning)
Direction: LONG
Confidence level: 57%(X sentiment is clearly bullish with strong conviction despite low volume, price is holding near support, and downside risk is well-defined. Lack of bearish pressure supports a short-term upside bias.)
Targets
Target 1: 45.10
Target 2: 46.80
Stop Levels
Stop 1: 42.80
Stop 2: 41.90
Key Insights:
Here’s what’s driving this setup. The most consistent message from traders active on X is simple: Bitcoin Cash is holding its ground. Several traders highlighted BCH defending its recent base, with buy-the-dip behavior appearing just above the $43 area. Even with low tweet volume, conviction is high, which tells me this isn’t random chatter but targeted positioning.
What’s interesting is that price is hovering close to short-term support rather than extended near resistance. When I see that, I default to a bullish bias, especially when social sentiment is clearly skewed toward upside. The lack of aggressive bearish commentary also matters — sellers don’t appear confident pressing this lower right now.
Recent Performance:
Bitcoin Cash has been chopping sideways over the last few sessions, stabilizing around $43 after a minor pullback. Volatility has compressed, and price hasn’t broken below recent lows, which usually sets the stage for a directional move. This kind of tight range often resolves with a momentum push rather than a breakdown when support keeps holding.
Expert Analysis:
Several professional traders I track are framing BCH as a short-term technical bounce candidate. Even without fresh video analysis, the broader trader mindset focuses on support defense and mean reversion higher. When price refuses to break down despite weak broader crypto momentum, that usually signals quiet accumulation rather than distribution.
From a technical angle, the structure favors a grind higher rather than a sharp sell-off. Momentum indicators are curling up from lower levels, which aligns with the bullish tone seen on X.
News Impact:
There’s no major negative news hitting Bitcoin Cash right now, and that absence is actually constructive. In crypto, lack of bad headlines while price holds support often allows sentiment-driven rallies to play out. Any positive ecosystem or payment-related headline could act as a quick catalyst toward the mid-$40s.
Trading Recommendation:
Here’s my take. I’m sticking with a LONG bias on Bitcoin Cash for this week. The trade works because price is near support, downside is clearly defined, and trader sentiment — while limited — is decisively bullish. I’d look for a move toward $45.10 first, then $46.80 if momentum builds. Risk stays tight below $42.80, and if $41.90 breaks, the idea is invalid. Position size should stay modest given the lower confidence and thin data, but the risk-reward favors upside.
 Long
Long
LONG AUCT.SETEnglish version
## **AUCT: Potential Bullish Reversal (Falling Wedge)**
**Technical Outlook:**
* **Pattern:** A clear **Falling Wedge** has formed on the daily chart, suggesting that the long-term downtrend is losing momentum and a breakout is imminent.
* **Indicators:** RSI is recovering from the oversold zone, and MACD is showing signs of a bullish crossover.
* **Volume:** Looking for a volume spike to confirm the breakout.
**Trading Plan:**
* **Entry:** ~5.20 THB (Current level or on breakout)
* **Target:** **9.20 THB** (Previous resistance high)
* **Stop Loss:** **3.74 THB** (Below the recent swing low)
**Risk/Reward:** Highly attractive setup if the upper resistance line is broken.
---
 Long
Long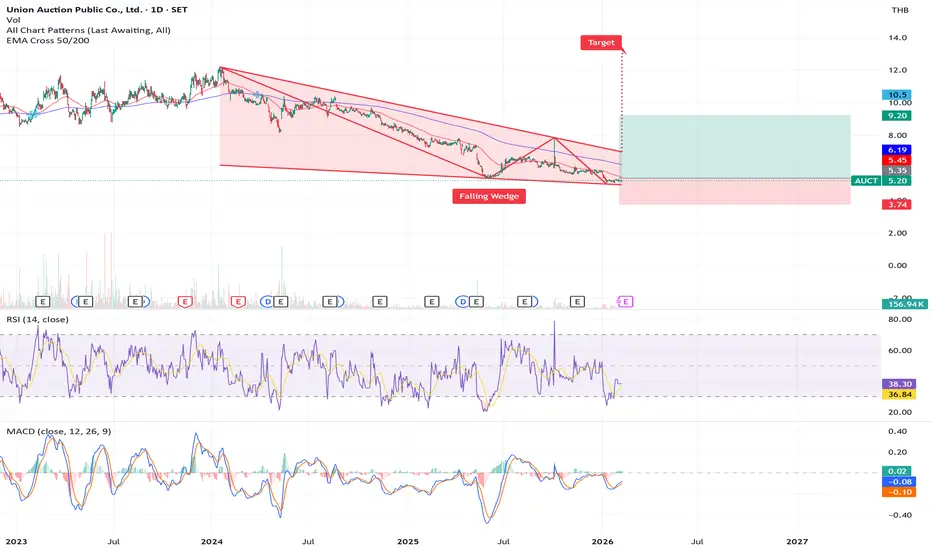
Carabao: The Thai march goes onThe Redoubling is my own research project on TradingView, which is designed to answer the following question: How long will it take me to double my capital? Each article will focus on a different company that I'll try to add to my model portfolio. I'll use the close price of the last daily candle on the day the article is published as the initial buy limit price. I'll make all my decisions based on fundamental analysis. Furthermore, I'm not going to use leverage in my calculations, but I'll reduce my capital by the amount of commissions (0.1% per trade) and taxes (20% capital gains and 25% dividend). To find out the current price of the company's shares, just click the Play button on the chart. But please use this stuff only for educational purposes. Just so you know, this isn't investment advice.
Here is a detailed overview of Carabao Group Public Company Ltd — a publicly‑listed Thai beverage company SET:CBG best known for its energy drinks, especially the Carabao Dang brand.
1. Main areas of activity Carabao Group Public Company Ltd is a Thailand‑based holding company primarily engaged in the production, manufacturing, marketing, sales, and distribution of energy drinks and other beverages. Its operations span domestic markets and international export channels, with products including energy drinks, functional/non‑carbonated beverages, sport drinks, drinking water, coffee products (instant and ready‑to‑drink), and distribution services for third‑party food and non‑food products.
2. Business model The Company generates revenue through a vertically integrated beverage business model. It manufactures its own branded drinks and beverages and sells them directly through its distribution network in Thailand and abroad. Additionally, it earns revenue by distributing both its own products and third‑party products across retail and modern trade channels. This includes revenue from finished beverage sales, distribution services, and sales of OEM/packaging products from its subsidiaries.
3. Flagship products or services Carabao’s flagship product is the Carabao Dang energy drink, marketed under the Carabao brand globally. Beyond energy drinks, the company offers electrolyte drinks (Carabao Sport), functional / vitamin‑enhanced beverages (e.g., Woody C+ Lock), drinking water, coffee 3‑in‑1 powder, ready‑to‑drink coffee, and other beverage formats. It also distributes third‑party consumer products in food and non‑food categories.
4. Key countries for business Carabao’s business is anchored in Thailand, which contributes the largest share of its revenue (about THB 15.35 billion of THB 20.96 billion in the latest financial year). It also operates in overseas markets across Southeast Asia (including Cambodia, Myanmar, Laos, and Vietnam) and beyond, exporting energy drinks and beverages to around 42 countries.
5. Main competitors Carabao competes with both regional and global beverage brands, particularly in the energy drink segment. Major competitors include: Osotspa Public Company Ltd’s M‑150 — a leading Thai energy drink brand.
T.C. Pharmaceutical Industries’ Krating Daeng — the original Thai energy drink precursor to Red Bull.
Red Bull GmbH (global energy drink brand).
International players such as Monster Beverage and other beverage firms offering energy, functional, and ready‑to‑drink categories.
6. External and internal factors contributing to profit growth External factors:
Growing beverage demand in Southeast Asia, driven by increasing energy‑drink consumption and retail expansion.
Export market penetration, especially in CLMV countries, supporting top‑line growth beyond Thailand.
Internal factors: Vertically integrated operations, including packaging and distribution capabilities, improving cost control and margin sustainability.
Strong domestic distribution network across traditional and modern trade, enhancing market coverage.
Diversification through entry into the beer segment: Carabao Group is investing in the development of its own beer brand, adding another revenue stream to its beverage portfolio. This move taps into the growing beer market in Southeast Asia and could reduce the company’s reliance on energy drink sales. A successful launch in the beer segment strengthens its overall retail presence and broadens its long-term growth opportunities.
7. External and internal factors contributing to profit decline External factors:
Intensifying competition from entrenched local and global energy drink brands exerting price and market share pressure.
Raw material and packaging cost volatility, especially aluminum and sugar, can squeeze margins.
Internal factors:
Dependence on energy drink category makes the company sensitive to shifts in consumer taste toward healthier alternatives.
Profit volatility observed in recent earnings trends compared with industry peers.
8. Stability of management Executive changes over past 5 years:
Carabao Group’s leadership has remained largely stable with Sathien Setthasit as CEO and Executive Vice Chairman, and a consistent executive team across finance and operations. Key figures also include senior directors in sales and operations spanning several years.
Impact on corporate strategy and culture:
This stability supported long‑term strategy continuity, including consistent branding, distribution expansion, and diversification into functional beverages and new products. Extended leadership tenure likely contributes to cohesive corporate culture and strategic clarity.
The analysis indicates that earnings per share currently show no growth, but this is balanced by steady long-term total revenue growth and very strong high-priority indicators, including excellent days sales outstanding, a debt-to-revenue ratio that looks great, and operating, investing, and financing cash flows that all appear strong, supporting overall financial stability. Medium-priority indicators largely reinforce this assessment, with return on equity showing steady long-term growth, solid days payable and inventory-to-revenue positions, strong interest coverage, and a current ratio that shows no recent progress but does not signal stress, while margins and operating expense ratios remain flat. With a P/E ratio of 14, the valuation is considered acceptable and consistent with the company’s current growth and profitability profile. No critical news was identified that could threaten the business or raise concerns about insolvency. Given a diversification coefficient of 20 and a deviation of the current stock price from its annual average of more than 4 EPS, an allocation of 5% at the closing price of the last daily bar reflects a measured and cautious portfolio positioning aligned with diversification principles.
 Long
Long
MEGA Going Up Soon???As you can see in month candle graph it looks like it forming another uptrend just as previous cycle.
 Long
Long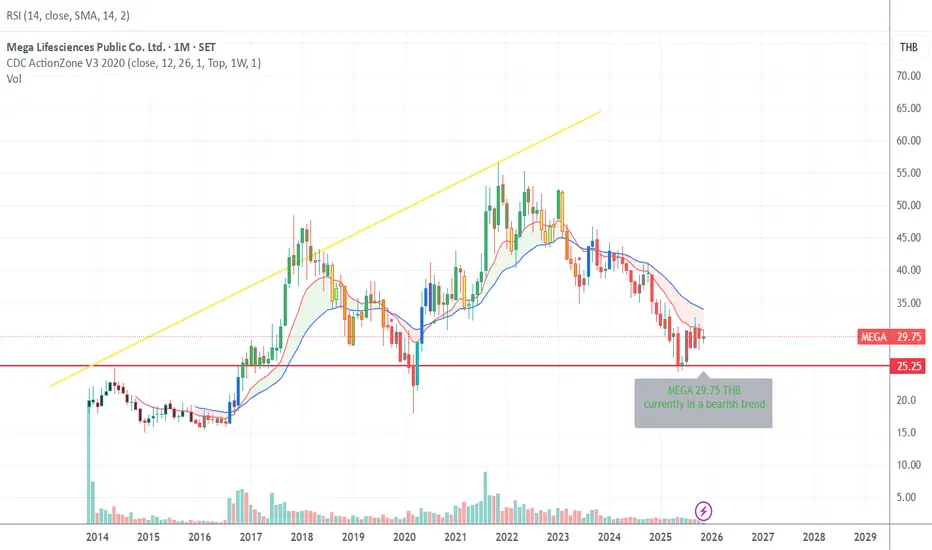
Singapore International School of Bangkok ( Short )Cooling off. Overshot to the upside. Needs time to grow into earnings.
 Short
Short
BOL Uptrend StartingBOL has turned bullish after a long downtrend, now trading at 6.20 THB. Price has broken above the 52-week SMA (5.55 THB), suggesting a potential shift into a new uptrend.
Analysis
Price reclaiming above the long-term moving average indicates a trend reversal.
RSI is currently at 65 — not yet overbought, but building momentum toward RSI70+.
Volume remains steady, supporting the breakout attempt.


UVAN Breaking HighHere’s a ready-to-publish draft for UVAN in your RSI70+ aggressive momentum style:
UVAN RSI70+ Breakout
UVAN has just pushed into RSI70+ territory (~71.4) while trading at 10.20 THB. This comes after a steady multi-year uptrend, with price holding consistently above the 52-week SMA (~9.28 THB).
Analysis
Strong uptrend structure with higher lows and higher highs.
RSI breaking above 70 signals short-term momentum acceleration.
Volume shows steady participation, supporting the breakout.
 Long
Long
PSP First Time RSI70+PSP has just entered RSI 70+ territory (currently ~73), marking the first time it has reached overbought levels in this cycle. This is a strong momentum signal after a long consolidation phase.
Analysis
Price is trading above the 52-week SMA (~4.37 THB), confirming a bullish shift in trend.
Momentum has been building steadily, supported by increasing volume, showing strong market participation.
The RSI crossing above 70 for the first time is often a sign of the beginning of a short momentum run, not necessarily the end.
 Long
Long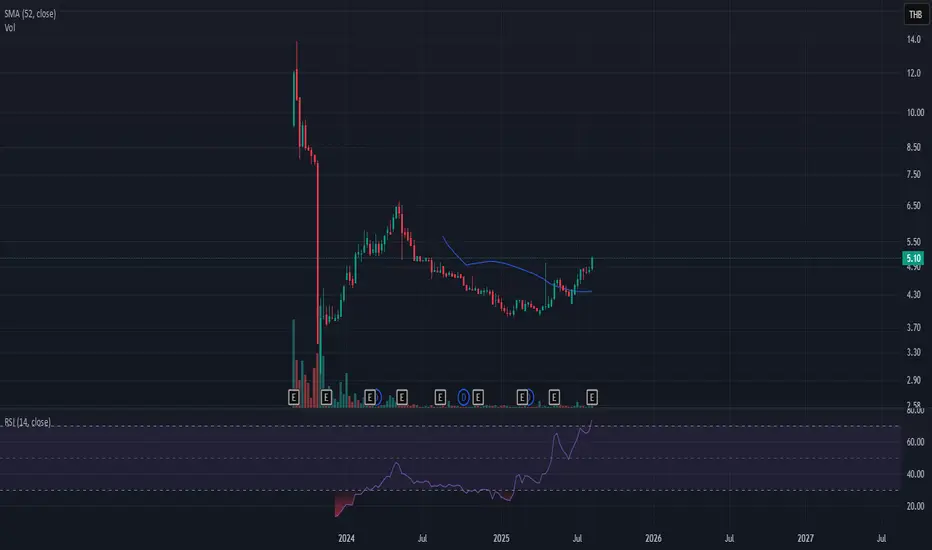
NUT Breaking High RSI70+NUT Breaking High RSI70+
NUT has recently shown extreme volatility with wide candlestick ranges, pushing the stock price above 6.30 THB. This strong move suggests heightened speculative activity and momentum-driven buying.
Key observations:
Momentum Breakout: Price has surged significantly from lower levels, breaking through key resistance zones.
RSI (14): The RSI is approaching overbought territory (70+). This indicates strong buying pressure, but also signals the risk of short-term exhaustion.
Volume Spike: Trading volume is very high compared to historical averages, showing strong market participation in the breakout.
 Long
Long