Bitcoin Cash holds support as traders position for a short-termCurrent Price: 43.52 (Analysis was generated on Monday Morning)
Direction: LONG
Confidence level: 57%(X sentiment is clearly bullish with strong conviction despite low volume, price is holding near support, and downside risk is well-defined. Lack of bearish pressure supports a short-term upside bias.)
Targets
Target 1: 45.10
Target 2: 46.80
Stop Levels
Stop 1: 42.80
Stop 2: 41.90
Key Insights:
Here’s what’s driving this setup. The most consistent message from traders active on X is simple: Bitcoin Cash is holding its ground. Several traders highlighted BCH defending its recent base, with buy-the-dip behavior appearing just above the $43 area. Even with low tweet volume, conviction is high, which tells me this isn’t random chatter but targeted positioning.
What’s interesting is that price is hovering close to short-term support rather than extended near resistance. When I see that, I default to a bullish bias, especially when social sentiment is clearly skewed toward upside. The lack of aggressive bearish commentary also matters — sellers don’t appear confident pressing this lower right now.
Recent Performance:
Bitcoin Cash has been chopping sideways over the last few sessions, stabilizing around $43 after a minor pullback. Volatility has compressed, and price hasn’t broken below recent lows, which usually sets the stage for a directional move. This kind of tight range often resolves with a momentum push rather than a breakdown when support keeps holding.
Expert Analysis:
Several professional traders I track are framing BCH as a short-term technical bounce candidate. Even without fresh video analysis, the broader trader mindset focuses on support defense and mean reversion higher. When price refuses to break down despite weak broader crypto momentum, that usually signals quiet accumulation rather than distribution.
From a technical angle, the structure favors a grind higher rather than a sharp sell-off. Momentum indicators are curling up from lower levels, which aligns with the bullish tone seen on X.
News Impact:
There’s no major negative news hitting Bitcoin Cash right now, and that absence is actually constructive. In crypto, lack of bad headlines while price holds support often allows sentiment-driven rallies to play out. Any positive ecosystem or payment-related headline could act as a quick catalyst toward the mid-$40s.
Trading Recommendation:
Here’s my take. I’m sticking with a LONG bias on Bitcoin Cash for this week. The trade works because price is near support, downside is clearly defined, and trader sentiment — while limited — is decisively bullish. I’d look for a move toward $45.10 first, then $46.80 if momentum builds. Risk stays tight below $42.80, and if $41.90 breaks, the idea is invalid. Position size should stay modest given the lower confidence and thin data, but the risk-reward favors upside.
 Long
Long
 Long
Long
Carabao: The Thai march goes onThe Redoubling is my own research project on TradingView, which is designed to answer the following question: How long will it take me to double my capital? Each article will focus on a different company that I'll try to add to my model portfolio. I'll use the close price of the last daily candle on the day the article is published as the initial buy limit price. I'll make all my decisions based on fundamental analysis. Furthermore, I'm not going to use leverage in my calculations, but I'll reduce my capital by the amount of commissions (0.1% per trade) and taxes (20% capital gains and 25% dividend). To find out the current price of the company's shares, just click the Play button on the chart. But please use this stuff only for educational purposes. Just so you know, this isn't investment advice.
Here is a detailed overview of Carabao Group Public Company Ltd — a publicly‑listed Thai beverage company SET:CBG best known for its energy drinks, especially the Carabao Dang brand.
1. Main areas of activity Carabao Group Public Company Ltd is a Thailand‑based holding company primarily engaged in the production, manufacturing, marketing, sales, and distribution of energy drinks and other beverages. Its operations span domestic markets and international export channels, with products including energy drinks, functional/non‑carbonated beverages, sport drinks, drinking water, coffee products (instant and ready‑to‑drink), and distribution services for third‑party food and non‑food products.
2. Business model The Company generates revenue through a vertically integrated beverage business model. It manufactures its own branded drinks and beverages and sells them directly through its distribution network in Thailand and abroad. Additionally, it earns revenue by distributing both its own products and third‑party products across retail and modern trade channels. This includes revenue from finished beverage sales, distribution services, and sales of OEM/packaging products from its subsidiaries.
3. Flagship products or services Carabao’s flagship product is the Carabao Dang energy drink, marketed under the Carabao brand globally. Beyond energy drinks, the company offers electrolyte drinks (Carabao Sport), functional / vitamin‑enhanced beverages (e.g., Woody C+ Lock), drinking water, coffee 3‑in‑1 powder, ready‑to‑drink coffee, and other beverage formats. It also distributes third‑party consumer products in food and non‑food categories.
4. Key countries for business Carabao’s business is anchored in Thailand, which contributes the largest share of its revenue (about THB 15.35 billion of THB 20.96 billion in the latest financial year). It also operates in overseas markets across Southeast Asia (including Cambodia, Myanmar, Laos, and Vietnam) and beyond, exporting energy drinks and beverages to around 42 countries.
5. Main competitors Carabao competes with both regional and global beverage brands, particularly in the energy drink segment. Major competitors include: Osotspa Public Company Ltd’s M‑150 — a leading Thai energy drink brand.
T.C. Pharmaceutical Industries’ Krating Daeng — the original Thai energy drink precursor to Red Bull.
Red Bull GmbH (global energy drink brand).
International players such as Monster Beverage and other beverage firms offering energy, functional, and ready‑to‑drink categories.
6. External and internal factors contributing to profit growth External factors:
Growing beverage demand in Southeast Asia, driven by increasing energy‑drink consumption and retail expansion.
Export market penetration, especially in CLMV countries, supporting top‑line growth beyond Thailand.
Internal factors: Vertically integrated operations, including packaging and distribution capabilities, improving cost control and margin sustainability.
Strong domestic distribution network across traditional and modern trade, enhancing market coverage.
Diversification through entry into the beer segment: Carabao Group is investing in the development of its own beer brand, adding another revenue stream to its beverage portfolio. This move taps into the growing beer market in Southeast Asia and could reduce the company’s reliance on energy drink sales. A successful launch in the beer segment strengthens its overall retail presence and broadens its long-term growth opportunities.
7. External and internal factors contributing to profit decline External factors:
Intensifying competition from entrenched local and global energy drink brands exerting price and market share pressure.
Raw material and packaging cost volatility, especially aluminum and sugar, can squeeze margins.
Internal factors:
Dependence on energy drink category makes the company sensitive to shifts in consumer taste toward healthier alternatives.
Profit volatility observed in recent earnings trends compared with industry peers.
8. Stability of management Executive changes over past 5 years:
Carabao Group’s leadership has remained largely stable with Sathien Setthasit as CEO and Executive Vice Chairman, and a consistent executive team across finance and operations. Key figures also include senior directors in sales and operations spanning several years.
Impact on corporate strategy and culture:
This stability supported long‑term strategy continuity, including consistent branding, distribution expansion, and diversification into functional beverages and new products. Extended leadership tenure likely contributes to cohesive corporate culture and strategic clarity.
The analysis indicates that earnings per share currently show no growth, but this is balanced by steady long-term total revenue growth and very strong high-priority indicators, including excellent days sales outstanding, a debt-to-revenue ratio that looks great, and operating, investing, and financing cash flows that all appear strong, supporting overall financial stability. Medium-priority indicators largely reinforce this assessment, with return on equity showing steady long-term growth, solid days payable and inventory-to-revenue positions, strong interest coverage, and a current ratio that shows no recent progress but does not signal stress, while margins and operating expense ratios remain flat. With a P/E ratio of 14, the valuation is considered acceptable and consistent with the company’s current growth and profitability profile. No critical news was identified that could threaten the business or raise concerns about insolvency. Given a diversification coefficient of 20 and a deviation of the current stock price from its annual average of more than 4 EPS, an allocation of 5% at the closing price of the last daily bar reflects a measured and cautious portfolio positioning aligned with diversification principles.  Long
Long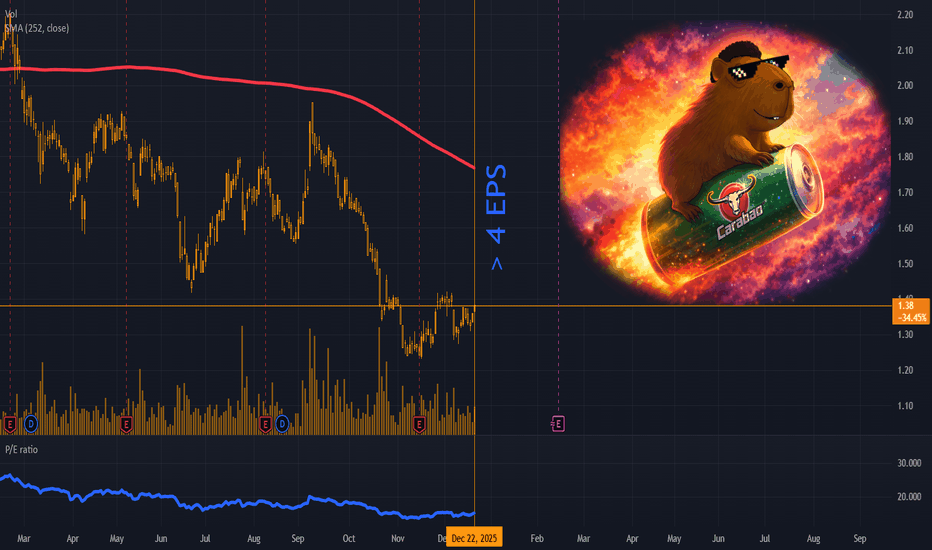
 Long
Long
 Short
Short
 Long
Long
 Long
Long
 Long
Long
 Long
Long
 Long
Long
 Long
Long
 Long
Long
 Long
Long
 Long
Long
 Long
Long
Long 
 Long
Long
 Long
Long
 Long
Long