COM7 | Elliott Wave Projection | Target Inv. Cup&Handle BreakoutPrice action and chart pattern trading setup:
> A possible inverted cup&handle pattern ABC correction
> stock price once again testing its support and probably making another pullback one more time
> Target handle pullback @ 0.382 - 0.236 Fibonacci zone
> Target downtrend C wave @ inverted cup&handle breakout @ 0.786 - 1.0 fibonacci extension of A wave
> Stoploss can be placed at the upcoming pullback wave 4 correction -12%
> Risk reward ratio: 2.5:1
Always trade with affordable risk and respect your stoploss, nothing 100%
Elliott wave 1 Elliott wave 1 Flat graph by Nantich The traingle
Turtle and rabbit
One day a rabbit was boasting about how fast he could run. He was laughing at the turtle for being so slow. Much to the rabbit’s surprise, the turtle challenged him to a race. The rabbit thought this was a good joke and accepted the challenge. The fox was to be the umpire of the race. As the race began, the rabbit raced way ahead of the turtle, just like everyone thought.
The rabbit got to the halfway point and could not see the turtle anywhere. He was hot and tired and decided to stop and take a short nap. Even if the turtle passed him, he would be able to race to the finish line ahead of him. All this time the turtle kept walking step by step by step. He never quit no matter how hot or tired he got. He just kept going.
However, the rabbit slept longer than he had thought and woke up. He could not see the turtle anywhere! He went at full speed to the finish line but found the turtle there waiting for him.
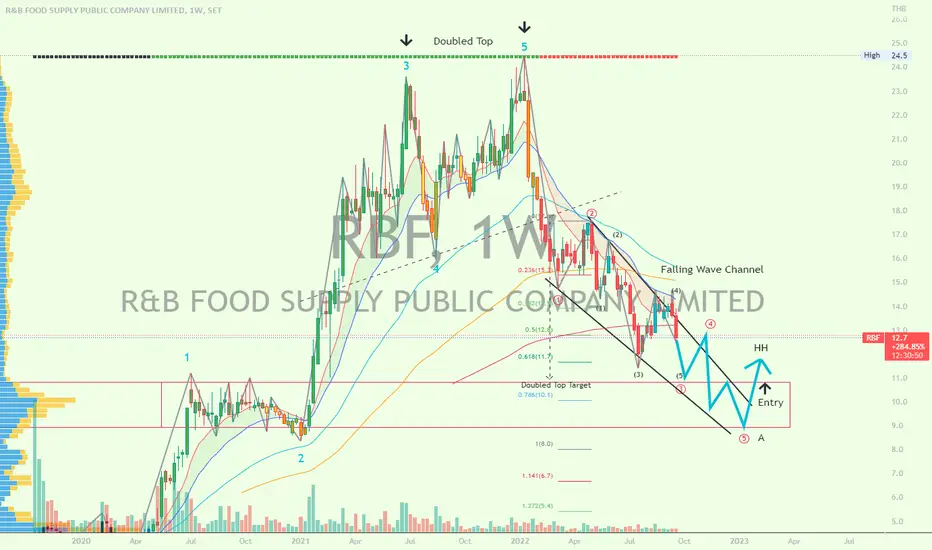
RBF | Wave Analysis | Target Projection - Ending DiagonalPrice action and chart pattern trading
> Falling wave channel pattern, possible downtrend 3-wave ending diagonal pattern
> Target doubled top zone previous wave 1 - 2 as price rejection is expected, followed by tight candlestick consolidation.
> Entry @ downtrend channel breakout from the consolidation, MACD and RSI bullish signal
> there are other strategies you can use, including using indicators and using patterns like triangle, ABCD , XABCD, and head and shoulders .
Always trade with affordable risk and respect your stoploss, nothing is 100%.
PRM | Elliott Wave Analysis | B-wave Buy on dip trading setupPrice action and chart pattern trading:
> Falling wedge correction wave with strong breakout uptrend if you didn't catch the first uptrend, here is the setup for buying the dip.
> status MACD dead-crossing the signal line, possible correction is coming.
> 1st Entry @ strong POC support near 6 baht or SMMA25 zone
> 2nd Entry @ falling wedge retest zone about 0.618 retracement
> Target B wave uptrend near 2-wave downtrend or 0.618-0.786 retracement zone also equals to the target of the falling wedge with a + 30-40%% upside.
> Stoploss @ slightly below the 2nd entry zone -10% downside.
> Risk reward ratio: 3:1
Buying the dip is an important strategy you can use to trade the financial market. Apart from the dollar cost averaging and Fibonacci retracement, there are other strategies you can use, including using indicators and using patterns like triangle, ABCD, XABCD, and head and shoulders.
Always trade with affordable risk and respect your stoploss, nothing is 100%.
TKN | Wave Analysis | Possible Upcoming Impulse 3-Wave ForecastPrice action and chart pattern trading setup
> Wave pattern: 2-Wave Triangle ABCDE - possible upcoming wave E before rising impulse 3 wave.
> Entry: Support level SMMA50 and SMMA20 @ 0.618 and 0.786 retracement zone
> Target: 3 -wave triangle breakout plus distance of the triangle channel 1.272 extension zone of main 1-wave +15-20%
> Stoploss: Lower triangle support zone -7-8%
> Risk reward ratio: 3:1
Always trade with affordable risk and respect your stoploss
DELTA | Wave Analysis | Target Projection - Take Profit ZonePrice action and chart pattern trading setup - take profit position
> A descending triangle major wave 2 - ABCDE pattern with 3-3-3-3-3 complex structure
> Target: a possible scenario of making D-wave with an upcoming ending diagonal at the upper resistance of the triangle 0.786-1.0 retracement +15-20% upside
> Stoploss: at the previous high position a-wave - 8% downside
> Risk reward ratio: 2:1 approx.
> After completing the D-wave could possibly retrace downward trend 0.382 - 0.786 for the final E-wave which is the most difficult wave to predict.
Always trade with affordable risk and respect your stoploss
Good luck
BLong
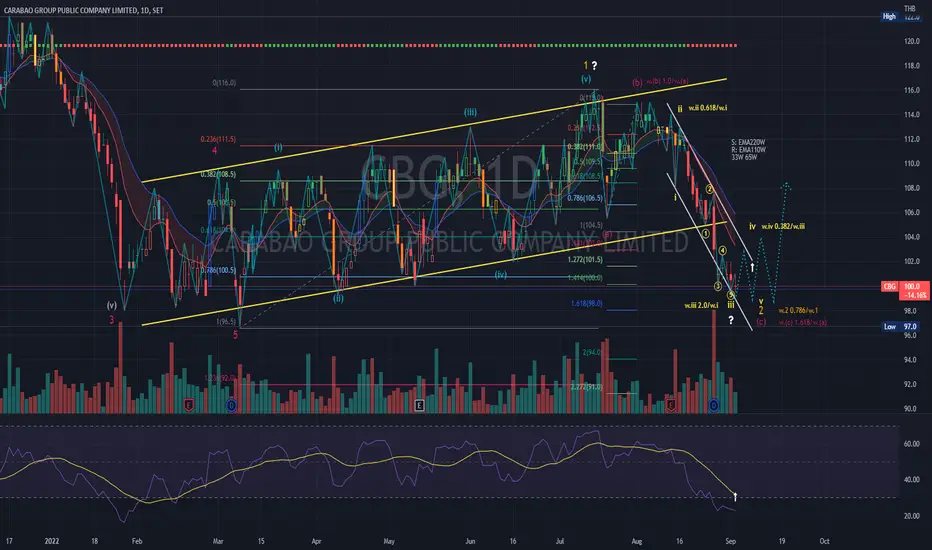
CBG | Wave Analysis | Leading Diagonal 2-Wave Price action and chart pattern trading setup
> A possible 2-wave leading diagonal pattern ending at 0.786 retracement zone
> Entry @ downtrend breakout with reversal pattern - watch for double bottom / inverse head & shoulders / triangle wave candlestick consolidation
> Target @ 0.786-1.0 retracement to previous 1-wave + 10 - 12%
> Stoploss @ the lowest position -4-5%
> Risk reward ratio: 2.5:1
Always trade with affordable risk and respect your stoploss
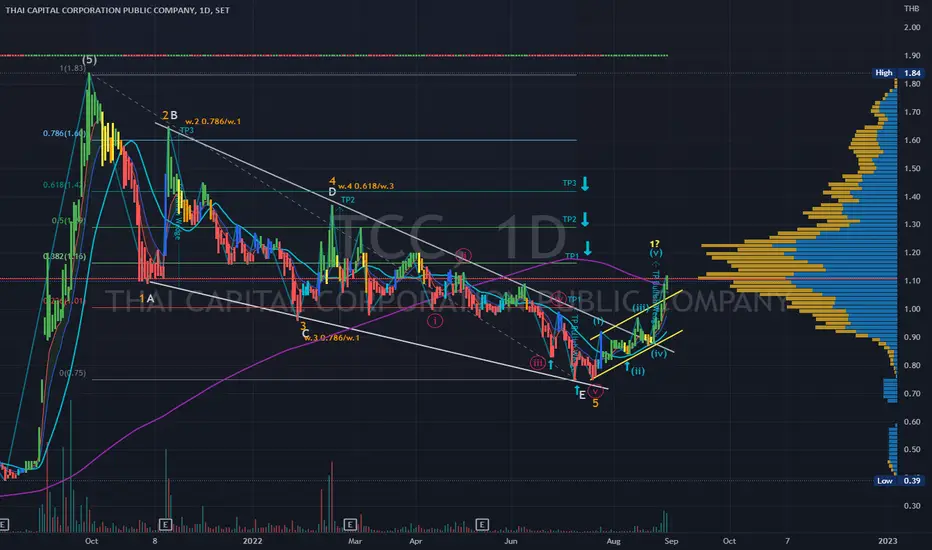
TCC | Wave Analysis | Falling Wedge Breakout TargetElliott Wave Projection - Price action and chart pattern trading
> Bullish Wedge Elliott Wave downtrend channel breakout
> Key resistance SMA200
> TP1 @ 0.382 retracement of previous wave 5 - volume profile point of control zone equal to distance of wave E to the falling wedge breakout point
> TP2 @ 0.5 retracement - upper resistance of key volume profile zone = distance of wave C > D from breakout point
> TP3 @ 0.618 retracement - equal to the distance of A>B +30%
> Entry @ Pullback SMA200 zone
> Stoploss @ SMA20 zone -10%+
> Risk reward ratio: 3:1
Always trade with affordable risk and respect your stoploss
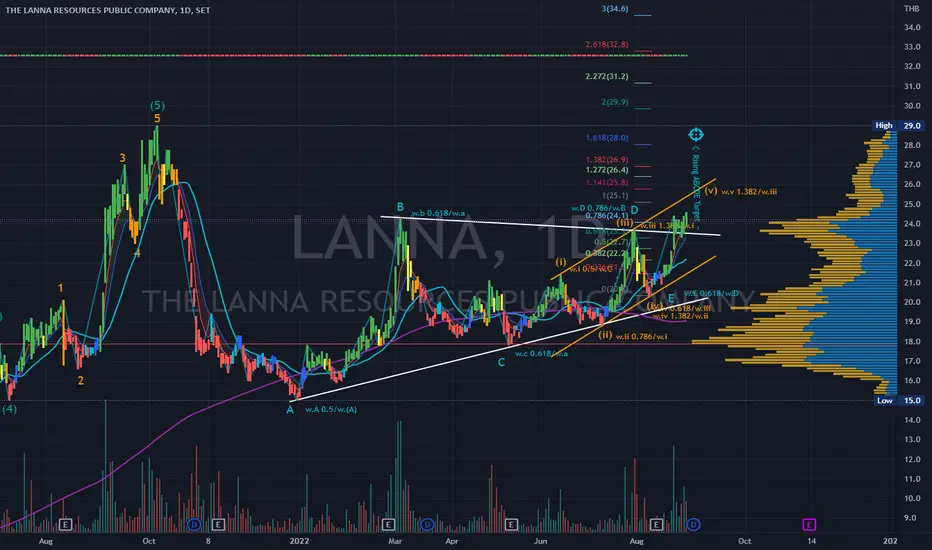
LANNA | Wave Analysis | ABCDE Triangle Breakout TargetPrice action and chart pattern trading
> Elliott Wave Projection - Rising triangle wave ABCDE breakout pattern
> TP1 @ Upper channel resistance wave v leading diagonal - 1.382 extension of wave iii +12% upside
> TP2 @ 1.618 extension of wave D +18% upside
> Stoploss @ SMA20 - 6-7%
> Risk reward ratio: 2.5-3:1
Always trade with affordable risk and respect your stoploss