Penunjuk
Strategi

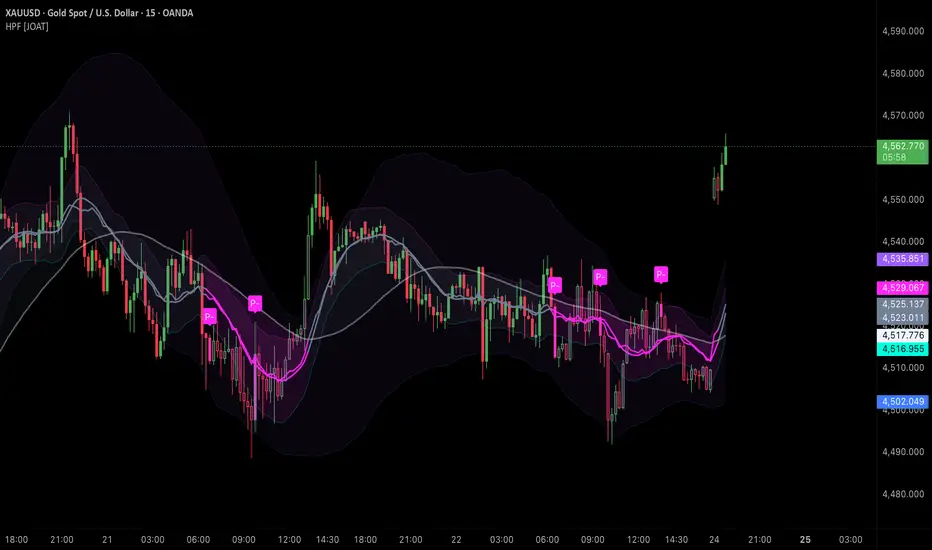
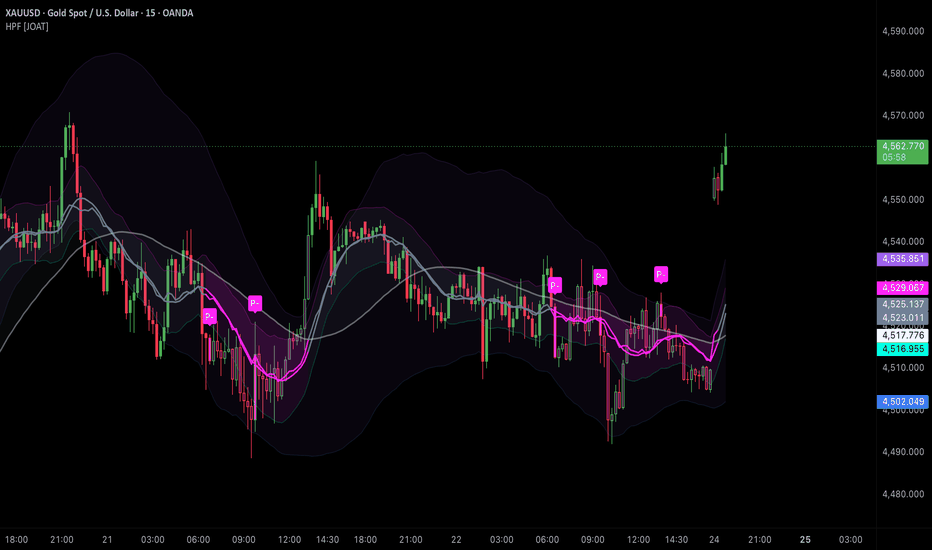
Helios Pullback Framework [JOAT]Helios Pullback Framework
Introduction
Helios Pullback Framework evaluates pullback quality using ALMA trend stack, regression trajectory, pullback depth, wick recovery, liquidity capture, compression, and HTF bias.
This open-source indicator is designed as a context tool, not a standalone trading system. It focuses on explaining the current market state with restrained visuals and confirmed-bar logic where signals are used.
Core Concepts
1. ALMA Trend Stack
Fast and slow ALMA lines define execution and institutional spines.
2. Regression Trajectory
A regression envelope provides dynamic path context rather than static zones.
3. Pullback Quality
Pullback depth, wick recovery, phase impulse, and stretch are scored.
4. Liquidity Capture
Confirmed sweeps of recent highs or lows contribute only when aligned with bias.
score = bias + pullDepth + wickRecovery + sweep + compression + htf
Features
ALMA trend stack
Regression trajectory envelope
Pullback depth and wick recovery scoring
Liquidity capture markers
Sparse P+ and P- labels
Input Parameters
ALMA lengths
Volatility and trajectory length
HTF and optional session gate
Signal score, cooldown, and max stretch
Display toggles
How to Use This Script
Use P+ and P- labels as pullback-quality events inside an existing bias. Gold circles mark liquidity capture without full confirmation.
Limitations
The script uses historical OHLCV data and cannot know future prices.
Signals and states can be late during fast reversals because confirmed-bar logic is used to reduce repainting.
Model outputs should be interpreted with market context, risk controls, and independent analysis.
No visual state should be treated as a certain trade outcome.
Originality Statement
Helios is original in replacing supply/demand boxes with a cleaner model that scores pullback elasticity, trajectory, and liquidity capture.
Disclaimer
This indicator is provided for educational and informational purposes only. It is not financial advice, investment advice, or a recommendation to buy or sell any financial instrument. All calculations are derived from historical market data and may produce inaccurate readings in some market conditions. No indicator can predict future market behavior. Use proper risk management and independent judgment.
-Made with passion by jackofalltrades
Penunjuk
Penunjuk

Mean Reversion Pro 📊 Mean Reversion Pro — Data-Driven Edge on Any Market, Any Timeframe
Most mean reversion indicators tell you the price is "too far" from the moving average. This one tells you exactly how far is statistically worth trading — using your own chart's historical data as proof.
Works on all instruments and timeframes: futures (NQ, ES, CL, GC…), crypto (BTC, ETH, SOL…), forex (EUR/USD, GBP/USD…), indices (SPX, DAX, NASDAQ…), stocks, commodities — anything with a price and volume.
─────────────────────────────────────────
🔍 WHAT THIS INDICATOR DOES
─────────────────────────────────────────
Mean Reversion Pro silently analyses every historical instance where price deviated from a moving average by a given distance. For each of 15 tested threshold levels it computes:
• Win rate — % of times price returned to the MA within the timeout
• Expectancy — (win-rate × avg MFE) − (loss-rate × avg MAE)
• Profit Factor — gross gain / gross loss ratio
• Avg MAE — average adverse excursion (how far against you before reverting)
• Avg MFE — average favourable excursion (how far in your favour)
• Avg return time — average bars needed to reach the MA
It then automatically selects the threshold with the highest expectancy that also satisfies your minimum win-rate and minimum occurrences filters — and only then shows a signal. No manual optimisation. No curve-fitting.
─────────────────────────────────────────
⚙️ KEY FEATURES
─────────────────────────────────────────
✅ Universal — works on futures, crypto, forex, indices, stocks, commodities
✅ 3 threshold modes: fixed Points, ATR multiples, Z-Score (adapts to any volatility regime)
✅ 5 MA types: EMA, SMA, WMA, VWMA, Hull MA
✅ Auto-optimised threshold — the indicator finds the best level by itself
✅ Real-time dashboard: win-rate, expectancy, profit factor, MAE, MFE, return time (Long & Short)
✅ Dynamic bands: 1× and 1.5× optimal threshold zones drawn on the chart
✅ Non-repainting signals — only fires on confirmed, closed bars
✅ Optional filters: trend (EMA 50), volume, US session, minimum ATR
✅ Minimum history guard — signals are held until enough bars have been analysed
✅ All parameters fully exposed and documented with tooltips
─────────────────────────────────────────
📈 WHO IS THIS FOR
─────────────────────────────────────────
• Futures traders — NQ, MNQ, ES, MES, CL, GC, SI, ZB…
• Crypto traders — BTC, ETH, SOL and all altcoins on any exchange
• Forex traders — all major, minor and exotic pairs
• Index traders — SPX, NDX, DAX, FTSE, CAC, Nikkei…
• Stock traders and swing traders looking for mean reversion pullbacks
• Prop firm traders who need a systematic, rules-based edge
• Any trader tired of arbitrary support/resistance levels with no statistical backing
─────────────────────────────────────────
🧠 HOW TO USE IT
─────────────────────────────────────────
1. Apply to any chart on any timeframe
2. Let at least 500 bars load (recommended: 1000–2000 for robust statistics)
3. Choose Threshold Mode:
— Points → best for futures and indices (fixed price distances)
— ATR → best for crypto and forex (volatility-adjusted)
— Z-Score → best for statistical/quant approaches
4. Set your minimum Win Rate (default 65%) and minimum Occurrences (default 15)
5. A signal appears only when all statistical conditions are met AND your filters pass
6. Read the dashboard to assess setup quality before entering a trade
─────────────────────────────────────────
💡 WHY EXPECTANCY MATTERS MORE THAN WIN RATE
─────────────────────────────────────────
A strategy with 80% win rate can still lose money if the average loss is 5× the average win. Mean Reversion Pro uses expectancy — the only metric that combines win rate, average gain and average loss into a single number — as its selection criterion. A signal only appears when the math is in your favour.
─────────────────────────────────────────
⚠️ DISCLAIMER
─────────────────────────────────────────
This indicator is a decision-support tool only. It does not provide financial advice and does not guarantee future results. Past statistical performance is not indicative of future performance. Always use proper risk management. Penunjuk

Echelon Trend Filter [JOAT]Echelon Trend Filter
Introduction
Echelon Trend Filter is a recursive digital trend filter that creates a clean trend spine, optional step-state transitions, EMA context, and pivot zones.
This open-source indicator is designed as a context tool, not a standalone trading system. It focuses on explaining the current market state with restrained visuals and confirmed-bar logic where signals are used.
Core Concepts
1. Recursive Filter
The source is smoothed recursively to reduce minor bar noise.
2. Step-State Transitions
Optional step mode holds the trend state until a meaningful transition occurs.
3. EMA Context
A long EMA gives broader context for the filtered state.
4. Pivot Context Zones
Recent pivots create reference zones around prior turning areas.
state = step > step ? 1 : step < step ? -1 : state
Features
Digital trend spine
Optional step-state behavior
EMA cloud context
Pivot context zones
Confirmed transition alerts
Input Parameters
Filter length and source
Step mode toggle
Institutional EMA length
Pivot length and zone width
Cloud, candle, and panel toggles
How to Use This Script
Use the spine as trend context. Long and short transition labels mark confirmed state changes, while the EMA cloud helps judge broader alignment.
Limitations
The script uses historical OHLCV data and cannot know future prices.
Signals and states can be late during fast reversals because confirmed-bar logic is used to reduce repainting.
Model outputs should be interpreted with market context, risk controls, and independent analysis.
No visual state should be treated as a certain trade outcome.
Originality Statement
Echelon is original in combining recursive smoothing, held state transitions, EMA context, and pivot zones into a minimal trend overlay.
Disclaimer
This indicator is provided for educational and informational purposes only. It is not financial advice, investment advice, or a recommendation to buy or sell any financial instrument. All calculations are derived from historical market data and may produce inaccurate readings in some market conditions. No indicator can predict future market behavior. Use proper risk management and independent judgment.
-Made with passion by jackofalltrades
Penunjuk

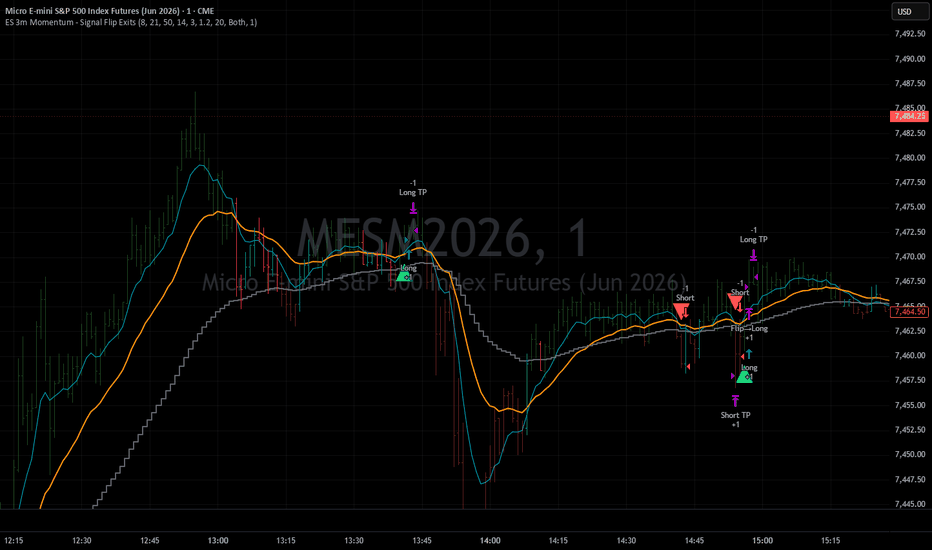
ES 1m - 3m Momentum - Signal Flip ExitsHow the strategy works on both timeframes
The core logic is identical — four filters must all agree before a trade fires: the fast EMA (8) crosses the slow EMA (21), price is on the correct side of the 50 EMA, smoothed RSI is above or below 50, and volume is above its 20-bar average. When all four line up, you enter long or short. You stay in the trade until the opposite signal fires or the 1-point take profit is hit.
On the 1-minute chart the crossovers fire constantly — you could see 40–80 signals per day. The volume and RSI filters cut most of them, but commission ($5 round-trip) eats deeply into a 1-point target. To make it work on 1m you'd want to tighten the RSI threshold to 52/48 instead of 50/50, and possibly raise the volume multiplier to 1.5× to further reduce trade count. It's workable but requires extra tuning.
On the 3-minute chart (the version built for you) the signal count drops to a healthier 15–30 trades per day. Each bar represents 3× the price action so the EMA and RSI readings are more stable, the trend filter is more meaningful, and you're less likely to get chopped by random 1-minute noise. This is why 3m was the right choice — the filters have room to breathe.
The key risk on both timeframes is a trending day where the signal never flips. You enter long, ES runs 5–10 points, and you sit through the full move. That's fine — that's the plan. The danger is a choppy, range-bound day where you keep flipping long and short at the same price level. The volume filter is your main protection against that scenario. Strategi
Concordance Execution Model [JOAT]Concordance Execution Model
Introduction
Concordance Execution Model is a strategy framework that integrates regime detection, trend bias, structure direction, pressure, relative volume, regression confidence, and ATR risk management.
This open-source strategy is a research framework, not a performance claim. It demonstrates how rule-based confluence, realistic costs, risk controls, and confirmed-bar execution can be organized in Pine Script v6.
Core Concepts
1. Regime Filter
ALMA, EMA, structure, and regression confidence determine whether long or short entries are allowed.
2. Multi-Factor Entry Gate
Entries require confirmed structure or pullback context plus pressure, RVOL, and cooldown alignment.
3. ATR Risk Model
Stops, targets, trailing stops, structure invalidation, and time stops manage exits.
4. Confirmed-Bar Execution
Entry conditions are evaluated with confirmed bars to reduce repainting behavior.
longEntry = confirmed and regimeBull and pressureBull and rvolOk and cooled
Features
Regime, structure, pressure, and regression filters
ATR stop and target exits
Optional trailing stop
Structure invalidation and time stop exits
Dashboard and candle regime colors
Input Parameters
Structure pivot length and HTF bias
ALMA and regression confidence settings
Delta pressure, RVOL, and cooldown
ATR stop, target, trailing, and time stop
Panel and candle display toggles
Strategy Properties
Initial capital: 100000
Position sizing: 10 percent of equity
Pyramiding: 0
Commission: 0.02 percent
Slippage: 2 ticks
Stops and targets: ATR-based, with optional trailing stop
How to Use This Script
Use this as a transparent research framework. Test on multiple markets and review trade samples rather than relying on a single backtest.
Limitations
The script uses historical OHLCV data and cannot know future prices.
Signals and states can be late during fast reversals because confirmed-bar logic is used to reduce repainting.
Model outputs should be interpreted with market context, risk controls, and independent analysis.
No visual state should be treated as a certain trade outcome.
Originality Statement
Concordance is original in combining several independent model families into a realistic, non-pyramiding execution framework with explicit risk exits.
Disclaimer
This indicator is provided for educational and informational purposes only. It is not financial advice, investment advice, or a recommendation to buy or sell any financial instrument. All calculations are derived from historical market data and may produce inaccurate readings in some market conditions. No indicator can predict future market behavior. Use proper risk management and independent judgment.
-Made with passion by jackofalltrades
Strategi

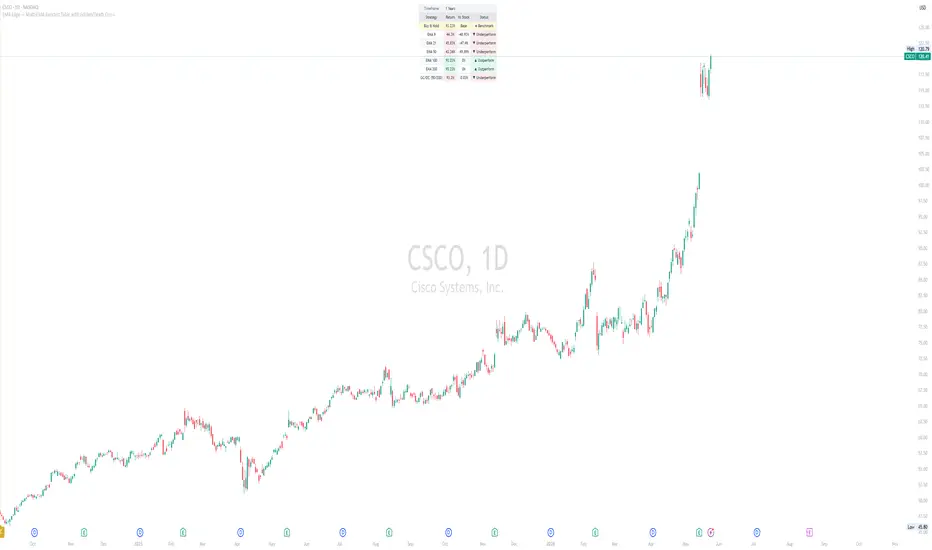
EMA Edge - Multi-EMA Backtest Table with Golden/Death CrossEMA Edge — Multi-EMA Backtest Table with Golden/Death Cross
A clean, all-in-one performance dashboard that backtests 6 long-only strategies side-by-side against a Buy & Hold benchmark — 5 single-EMA crossover strategies plus a classic Golden Cross / Death Cross strategy — with on-chart cross markers and built-in alerts.
Instead of guessing which EMA length works best for a given stock or timeframe, this indicator runs the math for you and shows the answer in a single glance, ranked against simply holding the asset.
What It Does
For each of 5 user-defined EMA lengths, the indicator simulates a simple long-only strategy:
Buy when price closes above the EMA (when flat)
Sell when price closes below the EMA (when long)
Equity starts at 100 and compounds across trades using the close-to-close return of each trade
A 6th strategy row tests the classic Golden/Death Cross:
Buy when the fast EMA crosses above the slow EMA (Golden Cross)
Sell when the fast EMA crosses below the slow EMA (Death Cross)
Special first-bar handling: if the fast EMA is already above the slow EMA at the start of your backtest window (i.e., we're mid-trend with no fresh Golden Cross to wait for), the strategy enters immediately at that bar's opening price. This avoids the unrealistic outcome of sitting in cash for years waiting for a cross that already happened.
All strategies are compared against a Buy & Hold baseline that starts at the close of the first in-range bar. If a position is open at the last bar, its equity is marked-to-market so every strategy is compared on equal terms — fully invested vs. partially invested at the cutoff.
Features
5 configurable EMAs — defaults 9 / 21 / 50 / 100 / 200, fully editable
Golden/Death Cross strategy — uses independent fast/slow EMA inputs (default 50 / 200)
Performance table showing Return %, delta vs. Buy & Hold, and Outperform / Underperform status per strategy
Flexible backtest window — X weeks, X years, or full chart lifetime
On-chart GC / DC markers with optional subtle background tint on cross bars
Built-in alerts for both Golden Cross and Death Cross events
Fully customizable table — 9 position options, 6 text sizes, all colors exposed as inputs
Soft, light color palette designed not to dominate the chart
Optional EMA plotting (off by default to keep the chart clean)
How To Read The Table
ColumnMeaningStrategyThe rule being testedReturnTotal % return of the strategy over the chosen windowVs StockDifference between the strategy's return and Buy & HoldStatus▲ Outperform if the strategy beat Buy & Hold, ▼ Underperform if not
Green-tinted rows = strategy beat Buy & Hold
Red-tinted rows = strategy underperformed Buy & Hold
Cream row = the Buy & Hold baseline itself
How To Use
Add the indicator to any chart — works on stocks, ETFs, crypto, forex, any timeframe.
Choose your backtest window (e.g., 1 Year, 5 Years, or Lifetime).
Scan the table to see which strategy historically beat Buy & Hold on this asset.
Use the on-chart GC / DC labels to spot historical and live cross events. Right-click any marker → Add Alert to be notified on new crosses.
Tip: Test the same EMA lengths across daily and weekly timeframes and across different assets. You'll usually find that what works on a steady index like SPY does not work on a volatile single stock, and vice versa. That's the entire point of the table — to make those differences visible instead of assumed.
Key Inputs
EMA 1–5: Lengths for the 5 single-EMA strategies
Show EMAs: Plot EMAs on chart (off by default)
Use Lifetime Performance: Backtest from the very first bar instead of a fixed window
Performance Timeframe Type / Value: Weeks or Years lookback
Crosses group: Toggle GC/DC display, set fast/slow EMA lengths, customize colors
Table Style group: Position, text size, background and text colors
Notes & Limitations
All strategies are long-only — no shorts, no leverage, no stops, no commissions, no slippage. This is a clean rule-based comparison, not a turnkey trading system. Live results will differ.
Entries and exits use close prices, except for the GC/DC strategy's first-bar entry when already in a golden state, which uses open.
Open positions at the last bar are marked-to-market so the comparison vs. Buy & Hold is apples-to-apples.
Past performance is not indicative of future results. Use this as a research and screening tool.
The GC/DC strategy uses separate EMA lengths from the 5 table EMAs by design, so you can run 9/21/50/100/200 in the table while still testing the classic 50/200 cross.
Alerts Available
Golden Cross: Fast EMA crossed above Slow EMA
Death Cross: Fast EMA crossed below Slow EMA
If you find this useful, a boost is appreciated. Suggestions and feedback welcome in the comments.
Open-source — feel free to study, fork, and adapt. Penunjuk

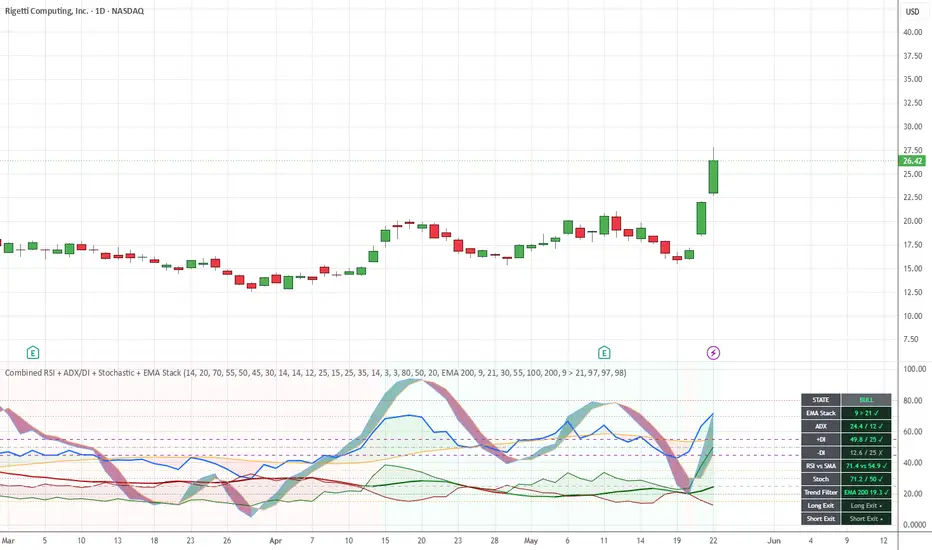
Combined RSI + ADX/DI + Stochastic + EMA StackShort Description
A compact market structure indicator that combines EMA stack alignment, ADX/DI trend strength, RSI vs RSI SMA, Stochastic positioning, and an optional trend filter to present bull, bear, neutral, and no-trade conditions in a clear visual format.
Long Description
Combined RSI + ADX/DI + Stochastic + EMA Stack is a compact market-structure indicator designed to help traders evaluate directional alignment, trend strength, and momentum conditions in one place.
The indicator combines:
EMA stack alignment
ADX trend strength
DI directional confirmation
RSI relative to its SMA
Stochastic position above or below the midline
Optional trend filter using EMA 100 or EMA 200
How it works
The main structural check is the selected EMA stack. The user can choose how strict that stack should be, from a simple 9 > 21 relationship to a broader multi-EMA sequence.
A bullish state requires:
the selected EMA stack to be aligned bullish
ADX above the no-trade threshold
+DI above the DI threshold
RSI above its SMA
Stochastic above 50
price above the selected trend filter when the filter is enabled
A bearish state requires:
the selected EMA stack to be aligned bearish
ADX above the no-trade threshold
-DI above the DI threshold
RSI below its SMA
Stochastic below 50
price below the selected trend filter when the filter is enabled
A no-trade state appears when ADX is below the defined threshold. This helps filter out weaker market conditions where trend strength may not be sufficient.
How to read the panel
The compact panel is designed to make the current condition easy to understand at a glance.
Green indicates bullish alignment
Red indicates bearish alignment
Amber indicates a no-trade condition because ADX is below threshold
Neutral coloring indicates partial alignment, but not enough confirmation for a full bullish or bearish state
Each row shows the current value and whether that condition is currently supporting the active side.
Exit consideration
The script also includes stochastic-based exit context.
For long trades:
monitor when %K crosses below %D from an overbought area, typically above 80
this can indicate that bullish momentum is weakening
For short trades:
monitor when %K crosses above %D from an oversold area, typically below 20
this can indicate that bearish momentum is weakening
Suggested use
This indicator is best used as a trend-alignment and market-structure tool rather than as a standalone trading system. It can help traders:
identify whether bullish or bearish conditions are structurally aligned
avoid weaker market environments through the ADX no-trade filter
confirm direction with DI, RSI, and Stochastic
apply a broader directional bias using EMA 100 or EMA 200
monitor stochastic crossover conditions as possible exit considerations
Default settings are intended to provide a balanced starting point, while still allowing users to make the EMA stack and trend filter stricter or more flexible.
Notes
This indicator is intended for chart analysis and educational use. It should be used alongside broader market context, risk management, and personal trade planning.
Preferred time frame D or W chart for stocks.
Attribution
This script includes logic derived in part from “ADX Di+ Di- ” by gu5tavo71.
Original source:
www.safecreative.org
© gu5tavo71 (Gustavo Cardelle)
License notice provided by the original author:
Attribution-NonCommercial 4.0 International (CC BY-NC 4.0)
creativecommons.org
Summary of the author’s stated terms:
Share, copy and redistribute this script
Adapt, transform and build on this script
NonCommercial: You may not use the material for commercial purposes
Release Notes
Initial Release — Sam George
Combined RSI + ADX/DI + Stochastic + EMA Stack was created to make multi-factor trend alignment easier to read in a clear, compact format.
This first release includes:
Configurable EMA stack alignment for flexible trend structure analysis
ADX no-trade filter to help avoid weaker trend conditions
DI threshold confirmation for directional strength
RSI vs RSI SMA for momentum bias
Stochastic midline confirmation for additional trend alignment
Optional Trend Filter using EMA 100 or EMA 200
Compact state panel showing bull, bear, neutral, and no-trade conditions
Stochastic-based exit context for long and short trade management
Improved visual structure for faster decision support and easier interpretation
This version is intended to provide a structured view of market condition, trend quality, and alignment across multiple components in one place. Penunjuk

MA Cloud System by @cumacevikCustomizable MA Cloud System (Multi-Timeframe)
This premium Pine Script v5 indicator maps short, medium, and long-term market structures simultaneously using 4 independent moving averages and 3 distinct trend clouds.
Key Features:
Dual-Mode Timeframe (MTF): Scales automatically with your chart interval or locks to a specific macro timeframe (Daily, Weekly, etc.). Built-in lookahead protection guarantees zero data leak bias during backtesting.
EMA / SMA Selector: Toggle the entire calculation engine between EMA and SMA closing prices with a single click.
Granular Line Control: Customize each MA line independently—adjust period length, color, thickness (1−4px), and line typography (Solid, Dashed, or Dotted).
Fault-Tolerant Cloud Engine: Toggling a line off shifts its color to 100% transparency rather than dropping the data array. This prevents the clouds from fracturing, ensuring seamless visual trend tracking.
Clean UI Architecture: Zero clutter. All useless, anonymous checkboxes inside TradingView's "Style" tab are eliminated. Every control is cleanly organized within the primary "Inputs" panel. Penunjuk

Impulse Momentum OscillatorImpulse Momentum Oscillator
Impulse Momentum Oscillator is a momentum-based chart study designed to visualize impulse movement, signal-line interaction, histogram acceleration, and momentum state changes.
The script uses a smoothed high/low channel, a zero-lag midpoint line, a signal line, and a histogram to help users study how momentum expands, slows, crosses, and changes direction.
It does not provide buy or sell recommendations. The purpose of this script is to help users study momentum structure and oscillator behavior.
────────────────────
Core Concept
────────────────────
This script is based on an impulse-style oscillator model.
Instead of comparing only two moving averages, the script first builds a smoothed high/low channel and then compares a zero-lag midpoint line against that channel.
The impulse line moves away from zero when the midpoint line extends above the smoothed high channel or below the smoothed low channel.
A signal line is then calculated from the impulse line, and the histogram measures the distance between the impulse line and the signal line.
The result is an oscillator that can be used to study:
• Momentum expansion
• Momentum slowdown
• Zero-line bias
• Golden cross and dead cross behavior
• Strong cross conditions above or below the zero line
────────────────────
What This Script Shows
────────────────────
The script can display:
• Impulse line
• Signal line
• Momentum histogram
• Zero line
• Golden cross and dead cross dots
• Strong cross pulse effect
• Last-bar status label
• Momentum state panel
• Optional crossover background
These visual elements are intended to make momentum transitions easier to review.
────────────────────
How It Works
────────────────────
1. The script calculates a smoothed high channel and a smoothed low channel.
2. It calculates a zero-lag midpoint line from the selected source.
3. When the midpoint line moves above the high channel, the impulse value becomes positive.
4. When the midpoint line moves below the low channel, the impulse value becomes negative.
5. When the midpoint line stays inside the channel, the impulse value remains neutral.
6. A signal line is calculated from the impulse line.
7. The histogram is calculated as the difference between the impulse line and the signal line.
8. Optional release emphasis visually strengthens histogram movement after compression.
9. Cross markers are plotted at interpolated cross locations for cleaner visual alignment.
────────────────────
Momentum States
────────────────────
The histogram is classified into several visual states:
Strong Bull:
Histogram is positive, growing, and aligned with bullish zero-line bias.
Bull Hold:
Histogram remains positive but begins slowing.
Strong Bear:
Histogram is negative, falling, and aligned with bearish zero-line bias.
Bear Hold:
Histogram remains negative but begins slowing.
Wait:
Momentum is mixed, neutral, or less clearly aligned.
These states are visual classifications only. They are not trading instructions.
────────────────────
Cross Markers
The script highlights two main crossover events:
Golden Cross:
The impulse line crosses above the signal line.
Dead Cross:
The impulse line crosses below the signal line.
Strong Golden Cross:
A golden cross occurs above the zero line.
Strong Dead Cross:
A dead cross occurs below the zero line.
The script estimates the visual cross location by interpolating between the previous bar and the current bar. This is intended to place the dot closer to the actual line intersection.
────────────────────
Inputs And Customization
────────────────────
Users can adjust:
• Source
• Impulse length
• Signal length
• Release emphasis
• Release power
• Higher timeframe mode
• Zero-bias coloring
• Compression lookback
• Line visibility
• Histogram visibility
• Cross dots
• Strong cross pulse effect
• Last-bar label
• Status panel
• Marker size
• Colors
────────────────────
How To Use
────────────────────
Use this script as a momentum context tool.
General interpretation examples:
• Impulse line above signal line may show stronger upward momentum structure.
• Impulse line below signal line may show weaker or downward momentum structure.
• Histogram expansion may show increasing momentum pressure.
• Histogram slowdown may show weakening momentum pressure.
• Crosses above the zero line can be reviewed differently from crosses below the zero line.
• The status panel can help summarize the current oscillator state.
This script should be used with independent analysis, risk management, and a defined trading plan.
────────────────────
Confirmation And Repainting Notes
────────────────────
The oscillator is calculated from current and historical price data.
The script does not use future price data.
When higher timeframe mode is enabled, values are requested from the selected higher timeframe with lookahead disabled.
Cross markers are based on current bar crossover conditions. If users want confirmed readings, they should evaluate conditions after bar close.
The interpolated cross dots are visual aids and should be understood as approximate line-intersection markers.
────────────────────
Limitations
────────────────────
This script does not predict future price movement.
It does not provide buy or sell recommendations.
Oscillators can produce frequent crosses during sideways or low-volatility markets.
Momentum readings can lag or change while the current candle is still forming.
This script should not be used as a standalone trading system.
────────────────────
Disclaimer
────────────────────
This publication is for educational and informational chart analysis only.
It does not constitute financial advice, investment advice, or a recommendation to buy or sell any financial instrument.
All trading and investment decisions are the responsibility of the user.
━━━━━━━━━━━━━━━━━━━━
Impulse Momentum Oscillator
Impulse Momentum Oscillator는 임펄스 움직임, 시그널 라인과의 관계, 히스토그램 가속, 모멘텀 상태 변화를 시각적으로 확인하기 위한 모멘텀 기반 차트 분석 보조지표입니다.
이 스크립트는 스무딩된 고점/저점 채널, 제로랙 중간선, 시그널 라인, 히스토그램을 사용해 모멘텀이 어떻게 확장되고 둔화되며 교차하고 방향을 바꾸는지 관찰할 수 있도록 돕습니다.
이 지표는 매수 또는 매도 추천을 제공하지 않습니다.
목적은 모멘텀 구조와 오실레이터 흐름을 분석하는 것입니다.
────────────────────
핵심 개념
────────────────────
이 스크립트는 임펄스형 오실레이터 구조를 기반으로 합니다.
단순히 두 이동평균을 비교하는 방식이 아니라, 먼저 스무딩된 고점/저점 채널을 만들고, 제로랙 중간선이 이 채널과 어떤 관계에 있는지를 확인합니다.
중간선이 스무딩된 고점 채널 위로 확장되면 임펄스 값은 양수 방향으로 움직입니다.
중간선이 스무딩된 저점 채널 아래로 확장되면 임펄스 값은 음수 방향으로 움직입니다.
임펄스 라인에서 시그널 라인을 계산하고, 두 선의 차이를 히스토그램으로 표시합니다.
이를 통해 다음 요소를 관찰할 수 있습니다.
• 모멘텀 확장
• 모멘텀 둔화
• 0선 기준 방향성
• 골든크로스와 데드크로스
• 0선 위/아래에서 발생하는 강한 교차 조건
────────────────────
표시 요소
────────────────────
이 스크립트는 다음 요소를 표시할 수 있습니다.
• 임펄스 라인
• 시그널 라인
• 모멘텀 히스토그램
• 0선
• 골든크로스 / 데드크로스 점
• 강한 교차 펄스 효과
• 마지막 봉 상태 라벨
• 모멘텀 상태 패널
• 선택 가능한 교차 배경 강조
이 시각 요소들은 모멘텀 전환을 더 쉽게 복기하기 위한 참고 자료입니다.
────────────────────
작동 방식
────────────────────
1. 스무딩된 고점 채널과 저점 채널을 계산합니다.
2. 선택한 소스에서 제로랙 중간선을 계산합니다.
3. 중간선이 고점 채널 위로 이동하면 임펄스 값은 양수로 계산됩니다.
4. 중간선이 저점 채널 아래로 이동하면 임펄스 값은 음수로 계산됩니다.
5. 중간선이 채널 안에 있으면 임펄스 값은 중립에 가깝게 유지됩니다.
6. 임펄스 라인에서 시그널 라인을 계산합니다.
7. 임펄스 라인과 시그널 라인의 차이를 히스토그램으로 계산합니다.
8. 선택에 따라 압축 이후 히스토그램 확장 구간을 시각적으로 강조합니다.
9. 교차 마커는 선의 실제 교차 위치에 더 가깝게 보이도록 보간 방식으로 표시됩니다.
────────────────────
모멘텀 상태
────────────────────
히스토그램은 다음 상태로 분류됩니다.
Strong Bull:
히스토그램이 양수이고 증가하며, 0선 기준 상승 방향과 정렬된 상태입니다.
Bull Hold:
히스토그램은 양수지만 상승 압력이 둔화되는 상태입니다.
Strong Bear:
히스토그램이 음수이고 하락하며, 0선 기준 하락 방향과 정렬된 상태입니다.
Bear Hold:
히스토그램은 음수지만 하락 압력이 둔화되는 상태입니다.
Wait:
모멘텀이 혼합, 중립, 또는 명확하지 않은 상태입니다.
이 상태 분류는 시각적 참고용이며 매매 지시가 아닙니다.
────────────────────
교차 마커
────────────────────
이 스크립트는 두 가지 주요 교차 이벤트를 표시합니다.
Golden Cross:
임펄스 라인이 시그널 라인을 상향 교차합니다.
Dead Cross:
임펄스 라인이 시그널 라인을 하향 교차합니다.
Strong Golden Cross:
0선 위에서 골든크로스가 발생합니다.
Strong Dead Cross:
0선 아래에서 데드크로스가 발생합니다.
스크립트는 이전 봉과 현재 봉 사이의 값을 보간하여 시각적 교차 위치를 계산합니다. 이는 점이 실제 선 교차 지점에 더 가깝게 표시되도록 하기 위한 시각적 보조 기능입니다.
────────────────────
입력값 및 설정
────────────────────
사용자는 다음 항목을 조정할 수 있습니다.
• Source
• Impulse length
• Signal length
• Release emphasis
• Release power
• Higher timeframe mode
• Zero-bias coloring
• Compression lookback
• 라인 표시 여부
• 히스토그램 표시 여부
• 교차 점
• 강한 교차 펄스 효과
• 마지막 봉 라벨
• 상태 패널
• 마커 크기
• 색상
────────────────────
사용 방법
────────────────────
이 스크립트는 모멘텀 흐름을 확인하는 보조도구로 사용할 수 있습니다.
일반적인 해석 예시는 다음과 같습니다.
• 임펄스 라인이 시그널 라인 위에 있으면 상승 모멘텀 구조가 상대적으로 강할 수 있습니다.
• 임펄스 라인이 시그널 라인 아래에 있으면 하락 또는 약한 모멘텀 구조일 수 있습니다.
• 히스토그램 확장은 모멘텀 압력 증가를 보여줄 수 있습니다.
• 히스토그램 둔화는 모멘텀 압력 약화를 보여줄 수 있습니다.
• 0선 위에서 발생한 교차와 0선 아래에서 발생한 교차는 서로 다르게 복기할 수 있습니다.
• 상태 패널은 현재 오실레이터 상태를 요약하는 데 도움을 줍니다.
이 스크립트는 독립적인 분석, 리스크 관리, 본인의 매매 계획과 함께 참고해야 합니다.
────────────────────
확인봉 및 리페인트 안내
────────────────────
이 오실레이터는 현재 및 과거 가격 데이터를 기반으로 계산됩니다.
이 스크립트는 미래 가격 데이터를 사용하지 않습니다.
상위 시간봉 모드를 사용할 경우, lookahead 비활성 상태로 선택한 시간봉의 값을 가져옵니다.
교차 마커는 현재 봉의 교차 조건을 기준으로 표시됩니다. 확정 값을 원하는 사용자는 봉 마감 이후 기준으로 확인해야 합니다.
보간된 교차 점은 시각적 보조 기능이며, 선 교차 위치를 근사해 보여주는 참고 마커로 이해해야 합니다.
────────────────────
한계
────────────────────
이 스크립트는 미래 가격 움직임을 예측하지 않습니다.
매수 또는 매도 추천을 제공하지 않습니다.
오실레이터는 횡보장 또는 저변동성 구간에서 잦은 교차를 만들 수 있습니다.
현재 캔들이 완성되기 전에는 모멘텀 값이 변할 수 있습니다.
이 스크립트를 단독 매매 시스템으로 사용해서는 안 됩니다.
────────────────────
중요 고지
────────────────────
본 게시물은 교육 및 정보 제공 목적의 차트 분석 자료입니다.
투자 자문, 매수·매도 추천, 특정 금융상품 거래 권유를 의미하지 않습니다.
모든 투자 판단과 그 결과에 대한 책임은 이용자 본인에게 있습니다. Penunjuk

Caelum Bias Ribbon [JOAT]Caelum Bias Ribbon
Introduction
Caelum Bias Ribbon is a multi-timeframe ALMA consensus ribbon. It evaluates whether 15m, 1H, 4H, 1D, and 1W horizons are aligned, mixed, or overheated.
This open-source indicator is designed as a context tool, not a standalone trading system. It focuses on explaining the current market state with restrained visuals and confirmed-bar logic where signals are used.
Core Concepts
1. ALMA Deviation States
Each timeframe creates an ALMA center and deviation threshold to classify bullish, bearish, or neutral state.
2. Consensus Voting
The script counts aligned timeframes to identify broad directional agreement.
3. Overheat Tracking
Directional runs are counted so stretched multi-timeframe conditions can be marked without predicting reversal.
4. Ribbon Visualization
Colored ALMA ribbons and fills show agreement without heavy labels.
consensus = bullCount >= gate ? 1 : bearCount >= gate ? -1 : 0
Features
Five-timeframe ALMA ribbon
Consensus and mixed-state detection
Overheat markers
Consensus candle coloring
Compact dashboard
Input Parameters
Deviation factor
ALMA length, offset, and sigma
Deviation length
Overheat run threshold
Display toggles
How to Use This Script
Use Caelum as a directional filter. Strong agreement supports trend-following context; mixed readings warn that timeframes are not aligned.
Limitations
The script uses historical OHLCV data and cannot know future prices.
Signals and states can be late during fast reversals because confirmed-bar logic is used to reduce repainting.
Model outputs should be interpreted with market context, risk controls, and independent analysis.
No visual state should be treated as a certain trade outcome.
Originality Statement
Caelum is original in combining ALMA deviation states, multi-horizon voting, run-length overheat logic, and a clean ribbon display.
Disclaimer
This indicator is provided for educational and informational purposes only. It is not financial advice, investment advice, or a recommendation to buy or sell any financial instrument. All calculations are derived from historical market data and may produce inaccurate readings in some market conditions. No indicator can predict future market behavior. Use proper risk management and independent judgment.
-Made with passion by jackofalltrades
Penunjuk

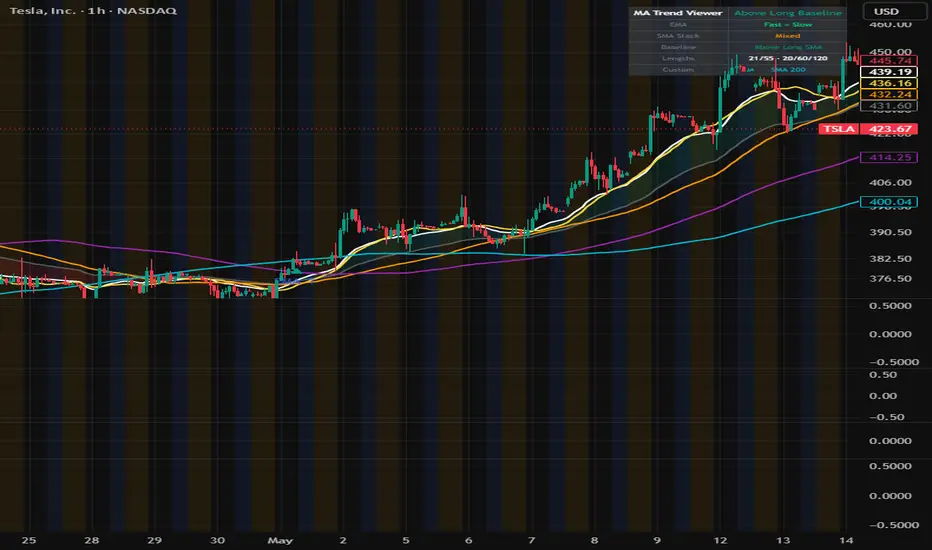
Moving Average Trend ViewerMoving Average Trend Viewer
Moving Average Trend Viewer is a chart study designed to visualize several moving averages on the same chart and help users observe trend structure, moving average alignment, crossover behavior, and price location relative to a longer-term baseline.
The script combines fast and slow EMAs, short / mid / long SMAs, and a customizable moving average into one clean viewer.
It does not provide buy or sell recommendations. The purpose of this script is to help users study moving average structure and trend context.
────────────────────
Core Concept
────────────────────
Moving averages are often used to smooth price movement and observe the direction of the broader trend.
This script focuses on three moving average concepts:
• Fast / slow EMA relationship
• Short / mid / long SMA alignment
• Price location relative to a longer-term SMA baseline
When shorter moving averages are above longer moving averages, the chart may show stronger upward structure.
When shorter moving averages are below longer moving averages, the chart may show weaker or downward structure.
When the moving averages are mixed, the market may be more neutral, transitional, or sideways.
────────────────────
What This Script Shows
────────────────────
The script can display:
• Fast EMA
• Slow EMA
• Short SMA
• Mid SMA
• Long SMA
• Custom SMA or EMA
• Optional EMA fast / slow fill zone
• Optional EMA crossover markers
• Optional SMA crossover markers
• Optional price / long SMA reference markers
• A compact trend status table
These elements are intended to make moving average structure easier to review on the chart.
────────────────────
How It Works
────────────────────
1. The script calculates a fast EMA and a slow EMA.
2. It calculates short, mid, and long simple moving averages.
3. It calculates a user-defined custom moving average using either SMA or EMA.
4. It checks whether the fast EMA is above or below the slow EMA.
5. It checks whether the short, mid, and long SMAs are aligned in bullish or bearish order.
6. It checks whether price is above or below the long SMA baseline.
7. It optionally marks crossover and baseline events.
8. It displays a status table summarizing the current moving average structure.
────────────────────
Visual Elements
────────────────────
The script includes:
• EMA Fast / Slow lines
• SMA Short / Mid / Long lines
• Custom MA line
• EMA Fast / Slow fill zone
• Reference markers for crossover events
• Reference markers for long baseline reclaim or loss
• Trend status table
The fill zone between the fast and slow EMAs helps users quickly identify whether the faster average is above or below the slower average.
────────────────────
Inputs And Customization
────────────────────
Users can adjust:
• EMA Fast length
• EMA Slow length
• SMA Short length
• SMA Mid length
• SMA Long length
• Custom MA length
• Custom MA type
• Line visibility
• Line width
• EMA zone fill
• Crossover markers
• Long baseline markers
• Status table location
The default structure uses commonly watched moving average areas, but all lengths can be customized.
────────────────────
Reference Markers
────────────────────
The script includes optional reference markers.
EMA Fast / Slow Cross:
Shows when the fast EMA crosses above or below the slow EMA.
SMA Short / Mid Cross:
Shows when the short SMA crosses above or below the mid SMA.
Price / Long SMA Events:
Shows when price crosses above or below the longer-term SMA baseline.
These markers are not trading signals. They are visual reference points for studying trend changes and moving average interaction.
────────────────────
How To Use
────────────────────
Use this script as a moving average structure viewer.
General interpretation examples:
• Fast EMA above Slow EMA may indicate stronger short-term trend structure.
• Fast EMA below Slow EMA may indicate weaker short-term trend structure.
• Short SMA above Mid SMA above Long SMA may indicate bullish alignment.
• Short SMA below Mid SMA below Long SMA may indicate bearish alignment.
• Price above the long SMA may show stronger baseline structure.
• Price below the long SMA may show weaker baseline structure.
This script should be used with independent analysis, risk management, and a defined trading plan.
────────────────────
Confirmation And Repainting Notes
────────────────────
Moving averages are calculated from current and historical price data.
Crossover markers are based on bar conditions and may appear when the selected crossover condition is met.
The script does not use future price data.
Because moving average values update as the current candle develops, users who want confirmed values should evaluate signals after bar close.
────────────────────
Limitations
────────────────────
This script does not predict future price movement.
It does not provide buy or sell recommendations.
Moving averages can lag because they are based on historical prices.
In sideways or low-volatility markets, moving average crosses may occur frequently and may not provide useful directional context.
The script should not be used as a standalone trading system.
────────────────────
Disclaimer
────────────────────
This publication is for educational and informational chart analysis only.
It does not constitute financial advice, investment advice, or a recommendation to buy or sell any financial instrument.
All trading and investment decisions are the responsibility of the user.
━━━━━━━━━━━━━━━━━━━━
Moving Average Trend Viewer
Moving Average Trend Viewer는 여러 이동평균선을 한 차트 위에 표시하여 추세 구조, 이동평균 배열, 교차 흐름, 그리고 가격이 장기 기준선과 어떤 위치 관계에 있는지 확인하기 위한 차트 분석 보조지표입니다.
이 스크립트는 빠른 EMA와 느린 EMA, 단기/중기/장기 SMA, 그리고 사용자가 직접 설정할 수 있는 커스텀 이동평균선을 하나의 뷰어로 정리합니다.
이 지표는 매수 또는 매도 추천을 제공하지 않습니다.
목적은 이동평균 구조와 추세 환경을 관찰하는 것입니다.
────────────────────
핵심 개념
────────────────────
이동평균선은 가격 움직임을 부드럽게 정리하고, 전체적인 추세 방향을 확인하는 데 자주 사용됩니다.
이 스크립트는 세 가지 이동평균 개념에 초점을 둡니다.
• 빠른 EMA와 느린 EMA의 관계
• 단기 / 중기 / 장기 SMA 배열
• 가격과 장기 SMA 기준선의 위치 관계
짧은 이동평균선이 긴 이동평균선 위에 있으면 상대적으로 강한 상승 구조로 볼 수 있습니다.
짧은 이동평균선이 긴 이동평균선 아래에 있으면 상대적으로 약하거나 하락 구조로 볼 수 있습니다.
이동평균 배열이 섞여 있으면 시장이 중립, 전환, 또는 횡보 구간에 있을 수 있습니다.
────────────────────
표시 요소
────────────────────
이 스크립트는 다음 요소를 표시할 수 있습니다.
• 빠른 EMA
• 느린 EMA
• 단기 SMA
• 중기 SMA
• 장기 SMA
• 커스텀 SMA 또는 EMA
• 선택 가능한 EMA Fast / Slow 구간 채움
• 선택 가능한 EMA 교차 마커
• 선택 가능한 SMA 교차 마커
• 선택 가능한 가격 / 장기 SMA 기준선 참고 마커
• 간단한 추세 상태 테이블
이 요소들은 차트 위에서 이동평균 구조를 더 쉽게 복기하기 위한 시각적 참고 자료입니다.
────────────────────
작동 방식
────────────────────
1. 빠른 EMA와 느린 EMA를 계산합니다.
2. 단기, 중기, 장기 단순 이동평균선을 계산합니다.
3. 사용자가 선택한 SMA 또는 EMA 방식으로 커스텀 이동평균선을 계산합니다.
4. 빠른 EMA가 느린 EMA 위에 있는지 아래에 있는지 확인합니다.
5. 단기, 중기, 장기 SMA가 상승 배열인지 하락 배열인지 확인합니다.
6. 가격이 장기 SMA 기준선 위에 있는지 아래에 있는지 확인합니다.
7. 선택에 따라 교차 및 기준선 이벤트를 표시합니다.
8. 현재 이동평균 구조를 상태 테이블로 요약합니다.
────────────────────
시각 요소
────────────────────
이 스크립트는 다음 시각 요소를 포함합니다.
• EMA Fast / Slow 라인
• SMA Short / Mid / Long 라인
• Custom MA 라인
• EMA Fast / Slow 구간 채움
• 교차 이벤트 참고 마커
• 장기 기준선 회복 또는 이탈 참고 마커
• 추세 상태 테이블
빠른 EMA와 느린 EMA 사이의 채움 영역은 빠른 평균선이 느린 평균선 위에 있는지 아래에 있는지를 빠르게 확인하는 데 도움을 줍니다.
────────────────────
입력값 및 설정
────────────────────
사용자는 다음 항목을 조정할 수 있습니다.
• EMA Fast 기간
• EMA Slow 기간
• SMA Short 기간
• SMA Mid 기간
• SMA Long 기간
• Custom MA 기간
• Custom MA 유형
• 라인 표시 여부
• 라인 두께
• EMA 구간 채움
• 교차 마커
• 장기 기준선 마커
• 상태 테이블 위치
기본 구조는 자주 참고되는 이동평균 영역을 사용하지만, 모든 기간은 사용자가 직접 조정할 수 있습니다.
────────────────────
참고 마커
────────────────────
이 스크립트에는 선택 가능한 참고 마커가 포함되어 있습니다.
EMA Fast / Slow Cross:
빠른 EMA가 느린 EMA를 상향 또는 하향 교차할 때 표시합니다.
SMA Short / Mid Cross:
단기 SMA가 중기 SMA를 상향 또는 하향 교차할 때 표시합니다.
Price / Long SMA Events:
가격이 장기 SMA 기준선을 상향 돌파하거나 하향 이탈할 때 표시합니다.
이 마커들은 매매 신호가 아닙니다.
추세 변화와 이동평균선 간의 상호작용을 관찰하기 위한 시각적 참고 지점입니다.
────────────────────
사용 방법
────────────────────
이 스크립트는 이동평균 구조 확인용 보조지표로 사용할 수 있습니다.
일반적인 해석 예시는 다음과 같습니다.
• 빠른 EMA가 느린 EMA 위에 있으면 단기 추세 구조가 상대적으로 강할 수 있습니다.
• 빠른 EMA가 느린 EMA 아래에 있으면 단기 추세 구조가 상대적으로 약할 수 있습니다.
• 단기 SMA가 중기 SMA 위에 있고, 중기 SMA가 장기 SMA 위에 있으면 상승 배열로 볼 수 있습니다.
• 단기 SMA가 중기 SMA 아래에 있고, 중기 SMA가 장기 SMA 아래에 있으면 하락 배열로 볼 수 있습니다.
• 가격이 장기 SMA 위에 있으면 기준선 위의 구조로 볼 수 있습니다.
• 가격이 장기 SMA 아래에 있으면 기준선 아래의 구조로 볼 수 있습니다.
이 스크립트는 독립적인 분석, 리스크 관리, 본인의 매매 계획과 함께 참고해야 합니다.
────────────────────
확인봉 및 리페인트 안내
────────────────────
이동평균선은 현재 및 과거 가격 데이터를 기반으로 계산됩니다.
교차 마커는 선택된 교차 조건이 충족될 때 표시됩니다.
이 스크립트는 미래 가격 데이터를 사용하지 않습니다.
현재 진행 중인 캔들의 이동평균 값은 캔들이 완성되기 전까지 변할 수 있으므로, 확정 값을 원하는 사용자는 봉 마감 이후 기준으로 확인해야 합니다.
────────────────────
한계
────────────────────
이 스크립트는 미래 가격 움직임을 예측하지 않습니다.
매수 또는 매도 추천을 제공하지 않습니다.
이동평균선은 과거 가격을 기반으로 하므로 지연성이 있습니다.
횡보장 또는 저변동성 구간에서는 이동평균 교차가 자주 발생할 수 있으며, 방향성 판단에 유용하지 않을 수 있습니다.
이 스크립트를 단독 매매 시스템으로 사용해서는 안 됩니다.
────────────────────
중요 고지
────────────────────
본 게시물은 교육 및 정보 제공 목적의 차트 분석 자료입니다.
투자 자문, 매수·매도 추천, 특정 금융상품 거래 권유를 의미하지 않습니다.
모든 투자 판단과 그 결과에 대한 책임은 이용자 본인에게 있습니다. Penunjuk

Adaptive Ichimoku CloudAdaptive Ichimoku Cloud
Adaptive Ichimoku Cloud is an Ichimoku-based chart study designed to visualize cloud structure, cloud direction, cloud transitions, and price location relative to the cloud.
The script keeps the core Ichimoku calculation structure while adding optional reference markers and a compact status table for easier chart review.
It does not provide buy or sell recommendations. The purpose of this script is to help users study Ichimoku cloud behavior and understand how price interacts with the cloud environment.
────────────────────
Core Concept
────────────────────
Ichimoku analysis is built around the relationship between several midpoint-based lines.
This script uses the standard Ichimoku components:
• Tenkan
• Kijun
• Senkou Span A
• Senkou Span B
• Cloud displacement
Senkou Span A is calculated from the midpoint of Tenkan and Kijun.
Senkou Span B is calculated from a longer high-low midpoint range.
The area between Senkou Span A and Senkou Span B forms the cloud.
When Senkou Span A is above Senkou Span B, the cloud is treated as bullish.
When Senkou Span A is below Senkou Span B, the cloud is treated as bearish.
────────────────────
What This Script Shows
────────────────────
The script can display:
• Ichimoku cloud
• Senkou Span A and Senkou Span B borders
• Optional Tenkan and Kijun lines
• Bullish and bearish cloud twist markers
• Price break above / below cloud reference markers
• Tenkan / Kijun cross reference markers
• A compact status table showing cloud state, price location, and active parameters
These elements are intended to make the current cloud structure easier to read.
────────────────────
How It Works
────────────────────
1. The script calculates Tenkan using the midpoint of the highest high and lowest low over the selected Tenkan length.
2. It calculates Kijun using the same midpoint method over the selected Kijun length.
3. It calculates Senkou Span A as the midpoint between Tenkan and Kijun.
4. It calculates Senkou Span B using a longer high-low midpoint range.
5. It plots Senkou Span A and Senkou Span B forward using the selected displacement.
6. It fills the area between both spans to create the cloud.
7. It optionally marks cloud twists, price/cloud events, and Tenkan/Kijun crosses.
────────────────────
Adaptive Parameters
────────────────────
The script includes an optional adaptive intraday parameter mode.
When adaptive mode is enabled, shorter intraday charts use faster cloud settings while higher timeframes use the standard Ichimoku structure.
The standard manual setting remains available:
• Tenkan: 9
• Kijun: 26
• Senkou Span B: 52
• Displacement: 26
Users can disable adaptive mode and manually adjust all core parameters.
────────────────────
Reference Markers
────────────────────
The script includes optional reference markers.
Cloud Twist:
Shows when Senkou Span A crosses Senkou Span B.
Price / Cloud Events:
Shows when price crosses above or below the current cloud area.
Tenkan / Kijun Cross:
Shows when Tenkan crosses above or below Kijun.
These markers are not trading signals. They are visual reference points for studying cloud transitions and price interaction with the cloud.
────────────────────
How To Use
────────────────────
Use the cloud to observe the broader chart environment.
General interpretation examples:
• Price above the cloud may indicate stronger upward structure.
• Price below the cloud may indicate weaker downward structure.
• Price inside the cloud may indicate a more neutral or transitional area.
• A cloud twist can show a change in future cloud direction.
• Tenkan / Kijun crosses can be used as additional reference points when studying momentum shifts.
This script should be used with independent analysis, risk management, and a defined trading plan.
────────────────────
Confirmation And Repainting Notes
────────────────────
The cloud is plotted with displacement, which is part of the traditional Ichimoku structure.
Senkou Span A and Senkou Span B are projected forward by the selected displacement value.
Cloud twist markers are also displayed with the same displacement so they visually align with the projected cloud area.
Price/cloud reference markers and Tenkan/Kijun cross markers are based on current bar conditions.
Users should understand that projected cloud values are visual structural references and should not be interpreted as future price prediction.
────────────────────
Limitations
────────────────────
This script does not predict future price movement.
It does not provide buy or sell recommendations.
It does not guarantee that price will continue in the direction of the cloud.
It does not replace independent analysis or risk management.
The cloud may be less useful in noisy, sideways, or low-volatility conditions.
────────────────────
Disclaimer
────────────────────
This publication is for educational and informational chart analysis only.
It does not constitute financial advice, investment advice, or a recommendation to buy or sell any financial instrument.
All trading and investment decisions are the responsibility of the user.
━━━━━━━━━━━━━━━━━━━━
Adaptive Ichimoku Cloud
Adaptive Ichimoku Cloud는 일목균형표 기반의 차트 분석 보조지표로, 구름 구조, 구름 방향, 구름 전환, 그리고 가격이 구름과 어떤 위치 관계에 있는지를 시각적으로 확인하기 위해 설계되었습니다.
이 스크립트는 일목균형표의 핵심 계산 구조를 유지하면서, 차트 복기를 돕기 위한 참고 마커와 간단한 상태 테이블을 추가합니다.
이 지표는 매수 또는 매도 추천을 제공하지 않습니다.
목적은 사용자가 일목 구름 구조와 가격의 상호작용을 더 쉽게 관찰할 수 있도록 돕는 것입니다.
────────────────────
핵심 개념
────────────────────
일목균형표는 여러 개의 고저점 중간값 기반 선들의 관계를 바탕으로 시장 구조를 해석합니다.
이 스크립트는 다음 일목 구성 요소를 사용합니다.
• 전환선
• 기준선
• 선행스팬 A
• 선행스팬 B
• 구름 표시 이동값
선행스팬 A는 전환선과 기준선의 중간값으로 계산됩니다.
선행스팬 B는 더 긴 기간의 고점과 저점 중간값으로 계산됩니다.
선행스팬 A와 선행스팬 B 사이의 영역이 구름입니다.
선행스팬 A가 선행스팬 B 위에 있으면 상승 구름으로 해석합니다.
선행스팬 A가 선행스팬 B 아래에 있으면 하락 구름으로 해석합니다.
────────────────────
표시 요소
────────────────────
이 스크립트는 다음 요소를 표시할 수 있습니다.
• 일목 구름
• 선행스팬 A / 선행스팬 B 테두리
• 선택 가능한 전환선 / 기준선
• 상승 및 하락 구름 전환 마커
• 가격의 구름 상단 돌파 / 하단 이탈 참고 마커
• 전환선 / 기준선 교차 참고 마커
• 구름 상태, 가격 위치, 현재 파라미터를 보여주는 상태 테이블
이 요소들은 현재 구름 구조를 더 쉽게 읽기 위한 시각적 참고 자료입니다.
────────────────────
작동 방식
────────────────────
1. 선택된 전환선 기간 동안의 최고가와 최저가 중간값으로 전환선을 계산합니다.
2. 선택된 기준선 기간 동안의 최고가와 최저가 중간값으로 기준선을 계산합니다.
3. 전환선과 기준선의 중간값으로 선행스팬 A를 계산합니다.
4. 더 긴 기간의 최고가와 최저가 중간값으로 선행스팬 B를 계산합니다.
5. 선택된 이동값만큼 선행스팬 A와 선행스팬 B를 앞으로 표시합니다.
6. 두 선 사이를 채워 구름을 형성합니다.
7. 선택에 따라 구름 전환, 가격/구름 이벤트, 전환선/기준선 교차를 표시합니다.
────────────────────
Adaptive 파라미터
────────────────────
이 스크립트는 선택 가능한 분봉 대응 파라미터 기능을 제공합니다.
Adaptive 모드를 켜면 짧은 분봉 차트에서는 더 빠른 구름 설정을 사용하고, 높은 시간봉에서는 정석 일목 구조에 가까운 설정을 사용합니다.
기본 수동 설정은 다음과 같습니다.
• 전환선: 9
• 기준선: 26
• 선행스팬 B: 52
• 구름 이동값: 26
사용자는 Adaptive 모드를 끄고 모든 핵심 파라미터를 직접 조정할 수 있습니다.
────────────────────
참고 마커
────────────────────
이 스크립트에는 선택 가능한 참고 마커가 포함되어 있습니다.
구름 전환:
선행스팬 A가 선행스팬 B를 상향 또는 하향 교차할 때 표시합니다.
가격 / 구름 이벤트:
가격이 현재 구름 영역의 위로 돌파하거나 아래로 이탈할 때 표시합니다.
전환선 / 기준선 교차:
전환선이 기준선을 상향 또는 하향 교차할 때 표시합니다.
이 마커들은 매매 신호가 아닙니다.
구름 전환과 가격의 구름 상호작용을 관찰하기 위한 시각적 참고 지점입니다.
────────────────────
사용 방법
────────────────────
구름은 전체적인 차트 환경을 확인하는 데 사용할 수 있습니다.
일반적인 해석 예시는 다음과 같습니다.
• 가격이 구름 위에 있으면 상대적으로 강한 상승 구조로 볼 수 있습니다.
• 가격이 구름 아래에 있으면 상대적으로 약한 하락 구조로 볼 수 있습니다.
• 가격이 구름 안에 있으면 중립 또는 전환 구간으로 볼 수 있습니다.
• 구름 전환은 미래 구름 방향의 변화를 관찰하는 참고 지점이 될 수 있습니다.
• 전환선 / 기준선 교차는 모멘텀 변화 복기 시 보조 참고 요소로 사용할 수 있습니다.
이 스크립트는 독립적인 분석, 리스크 관리, 본인의 매매 계획과 함께 참고해야 합니다.
────────────────────
확인봉 및 리페인트 안내
────────────────────
구름은 전통적인 일목균형표 구조에 따라 이동값을 적용해 표시됩니다.
선행스팬 A와 선행스팬 B는 선택한 이동값만큼 앞으로 표시됩니다.
구름 전환 마커도 구름 영역과 시각적으로 맞도록 같은 이동값을 적용해 표시됩니다.
가격/구름 참고 마커와 전환선/기준선 교차 마커는 현재 봉 조건을 기준으로 표시됩니다.
사용자는 앞으로 표시되는 구름 값이 시각적 구조 참고용이며, 미래 가격을 예측하는 값이 아니라는 점을 이해해야 합니다.
────────────────────
한계
────────────────────
이 스크립트는 미래 가격 움직임을 예측하지 않습니다.
매수 또는 매도 추천을 제공하지 않습니다.
가격이 구름 방향대로 계속 움직인다는 것을 보장하지 않습니다.
독립적인 분석과 리스크 관리를 대체하지 않습니다.
노이즈가 많은 횡보장, 저변동성 구간에서는 구름 해석의 유용성이 낮아질 수 있습니다.
────────────────────
중요 고지
────────────────────
본 게시물은 교육 및 정보 제공 목적의 차트 분석 자료입니다.
투자 자문, 매수·매도 추천, 특정 금융상품 거래 권유를 의미하지 않습니다.
모든 투자 판단과 그 결과에 대한 책임은 이용자 본인에게 있습니다. Penunjuk

Penunjuk
Penunjuk

Penunjuk
Penunjuk

Penunjuk

Penunjuk

Penunjuk

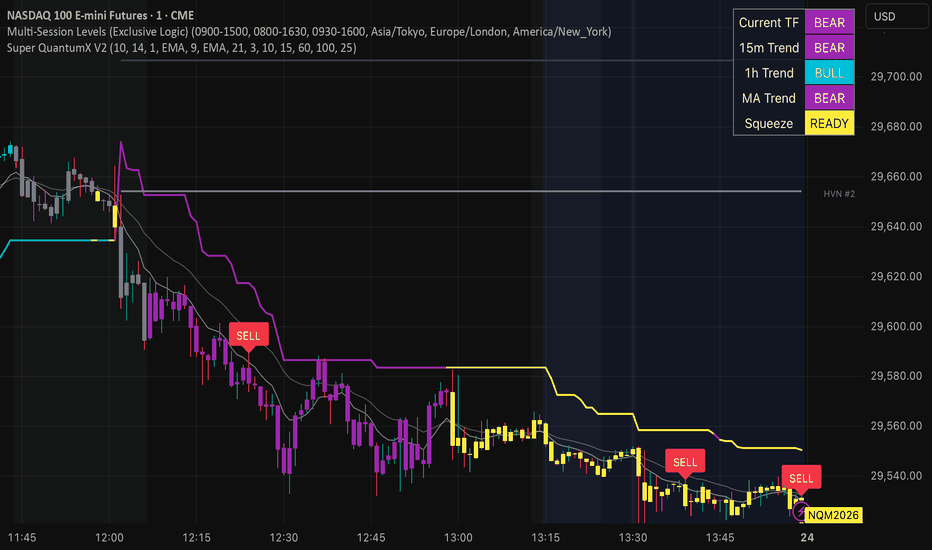
Super QuantumX Trend Shift Indicator V2Overview
The Super QuantumX Trend Shift Indicator V2 is an institutional-grade confluence engine designed for professional scalpers and intraday trend followers. While many retail indicators focus on a single metric (like price momentum), Super QuantumX recognizes that institutional moves are driven by a convergence of Momentum, Volume, Volatility, and Market Structure.
- This indicator is a sophisticated "Decision Matrix." It is not simply a collection of indicators on one chart; it is a gated signal system. A BUY or SELL signal is only generated when six distinct market dimensions align perfectly. This multi-layered approach filters out the noise of low-liquidity sessions and identifies the exact moment "Smart Money" enters the market.
Core Institutional Components & Why They Are Used:
1. Refined Momentum (Supertrend Logic): Used to define the primary active zones. We use Cyan for bullish and Purple for bearish momentum to provide an immediate visual bias.
2. Institutional Moving Averages (Multi-Type EMA Cross): Standard retail crosses are often too slow. We provide 6 adjustable MA types (EMA, TEMA, HMA, etc.) to confirm that the short-term trend is supported by institutional moving average baselines.
3. Accumulation Detection (Squeeze Pro): Before an institutional move occurs, the market often consolidates. We integrate Bollinger Band and Keltner Channel compression logic (Yellow bars) to identify these high-pressure zones where big orders are being filled.
4. Relative Aggression (CVD Proxy): Using a Cumulative Volume Delta proxy, the script ensures that signals are backed by aggressive market participants rather than thin retail volume.
5. Velocity & Strength (MACD/RSI/ADX): MACD tracks the velocity of the move, RSI confirms strength relative to the last 14 bars, and ADX filters out "Chop" zones by muting signals when volatility is too low to sustain a scalp.
6. Tactical Confirmation (Candle Pattern Recognition): Even if indicators align, we require a price action "trigger." The script looks for institutional-grade Engulfing patterns to ensure an impulse candle is behind every signal.
Advanced Profit Target Hierarchy
Unlike standard pivot points, our target system is dynamic and vertically aligned for a clean "R1-R3" look:
- HVN TARGET #1 & #2: Uses High Volume Nodedetection over a 100-bar and 25-bar lookback to find the Point of Control where liquidity is most dense.
- TARGET #3 & #4: Uses 1.618 and 2.618 Fibonacci Extensions of the higher-timeframe move to identify trend exhaustion levels.
The Multi-Timeframe Dashboard
A real-time dashboard tracks the health of the trade by showing the status of the Current, 15-minute, and 1-hour trend alignments. This ensures you never scalp against the "Master Trend" of the day.
How to Use
- The Setup: Wait for Yellow bars (Squeeze) to appear. This indicates institutional interest is building.
- The Trigger: A BUY or SELL label will appear when all 6 internal strategies align.
- The Zones: Only take long signals in Cyan zones and short signals in Purple zones.
- The Exit: Take profit at the horizontal HVN or Fib target levels and trail your stop along the Quantum Line .
Settings & Customization
Traders have full control over signal sensitivity, including an ATR Strength Filter to ensure candles have enough range to trade, and an optional Signal Cooldown to prevent repetitive labels during volatile sessions. Penunjuk