TradingView Bond Screener: simplify your fixed-income research
The Bond Screener is a powerful tool designed to help you compare and analyze government and corporate bonds based on your unique criteria. While bonds are generally more predictable and often less volatile than stocks and many other financial instruments, their level of risk depends on several factors: the specific characteristics of the issue, macroeconomic conditions, and the issuer’s overall financial health. The Bond Screener allows you to filter through thousands of options to find instruments that perfectly match your risk preferences and investment goals.
CONTENTS:
What is the Bond Screener?
The Bond Screener is a comprehensive financial analysis tool that lets you filter different bonds using various metrics, such as maturity date, issuer type, and coupon rate.
Adding bonds to your portfolio can help reduce overall volatility and make portfolio management more predictable through cross-asset diversification. However, keep in mind that bonds are never entirely risk-free: their resilience depends heavily on the issuer and the specific terms of the issue. Even sovereign bonds from countries with top-tier credit ratings are still exposed to shifting macroeconomic conditions and interest rate changes.
How to access the Bond Screener
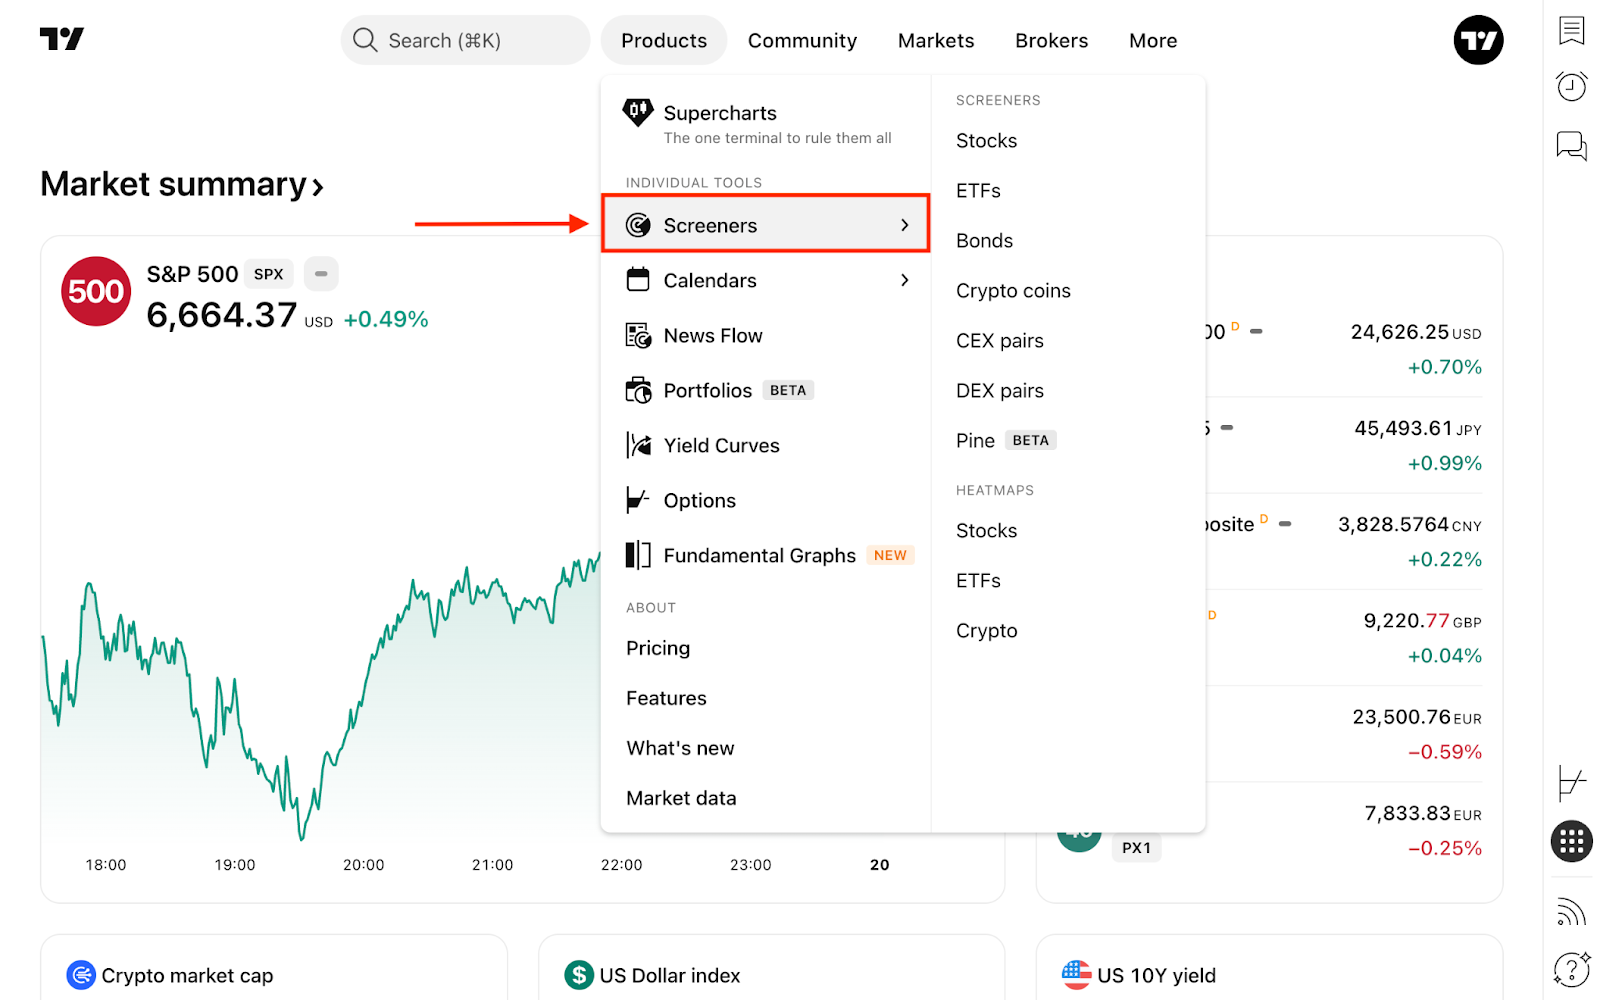
From the main page, click the Products dropdown in the top navigation menu, hover over Screeners, and select Bonds.
Alternatively, you can access it directly via Supercharts. On the right-hand toolbar, click Products → Screeners. If another screener is currently active (like the Stock Screener), simply click its name at the top and switch to the Bond Screener.
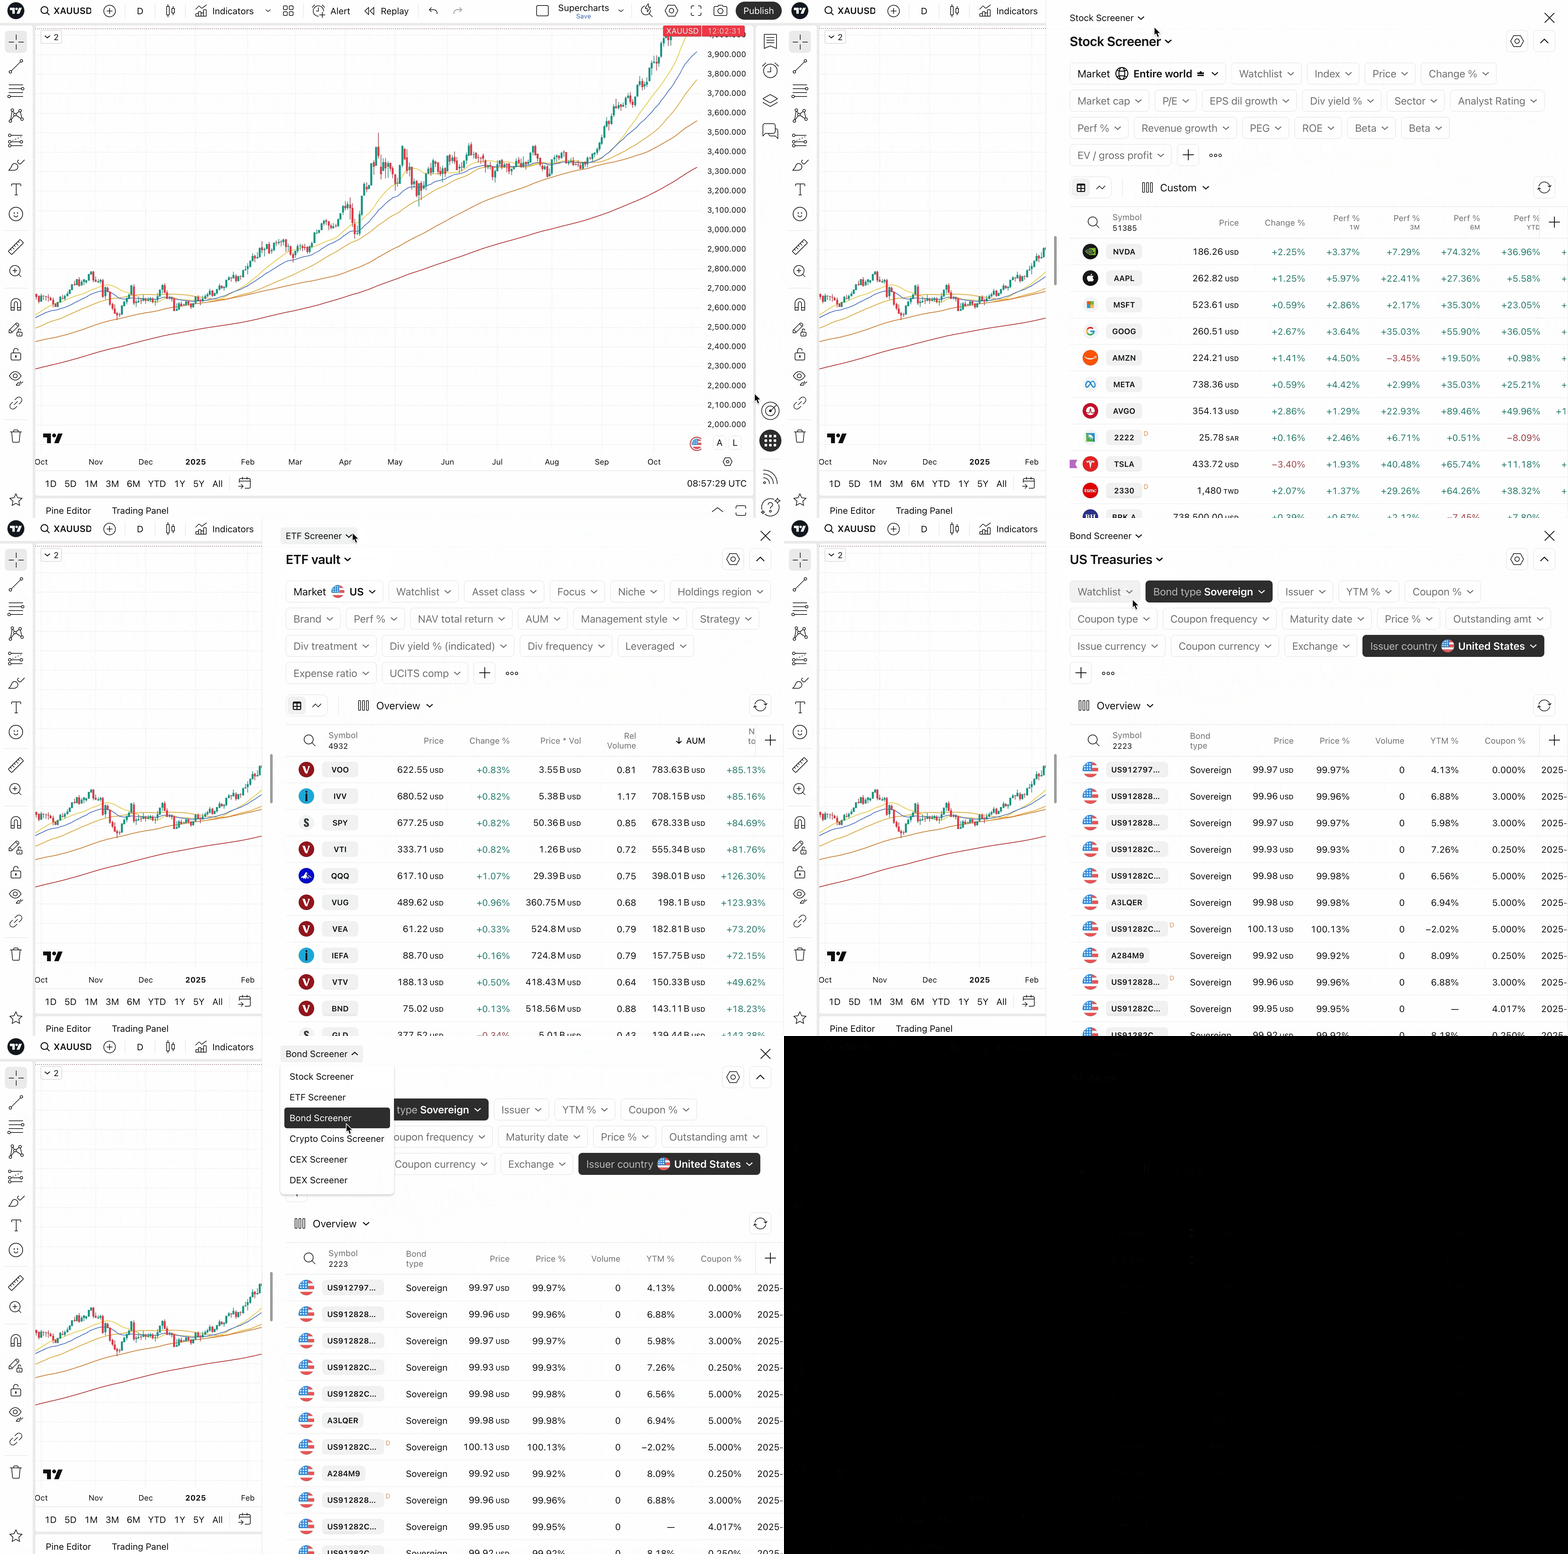
Regardless of how you access it, the tool offers the exact same functionality, so pick the workflow that best suits your setup.
How to use the Bond Screener
When you first open the tool, you will see US bond market data sorted by maturity date by default.
One of the core features of the Bond Screener is the ability to create, save, and manage multiple custom screens for future analysis. You can also utilize popular preset screens — carefully preconfigured filters designed to highlight interesting bonds. To access these, click the current screen name (e.g., US Treasuries) in the top-left corner and select Open screen…
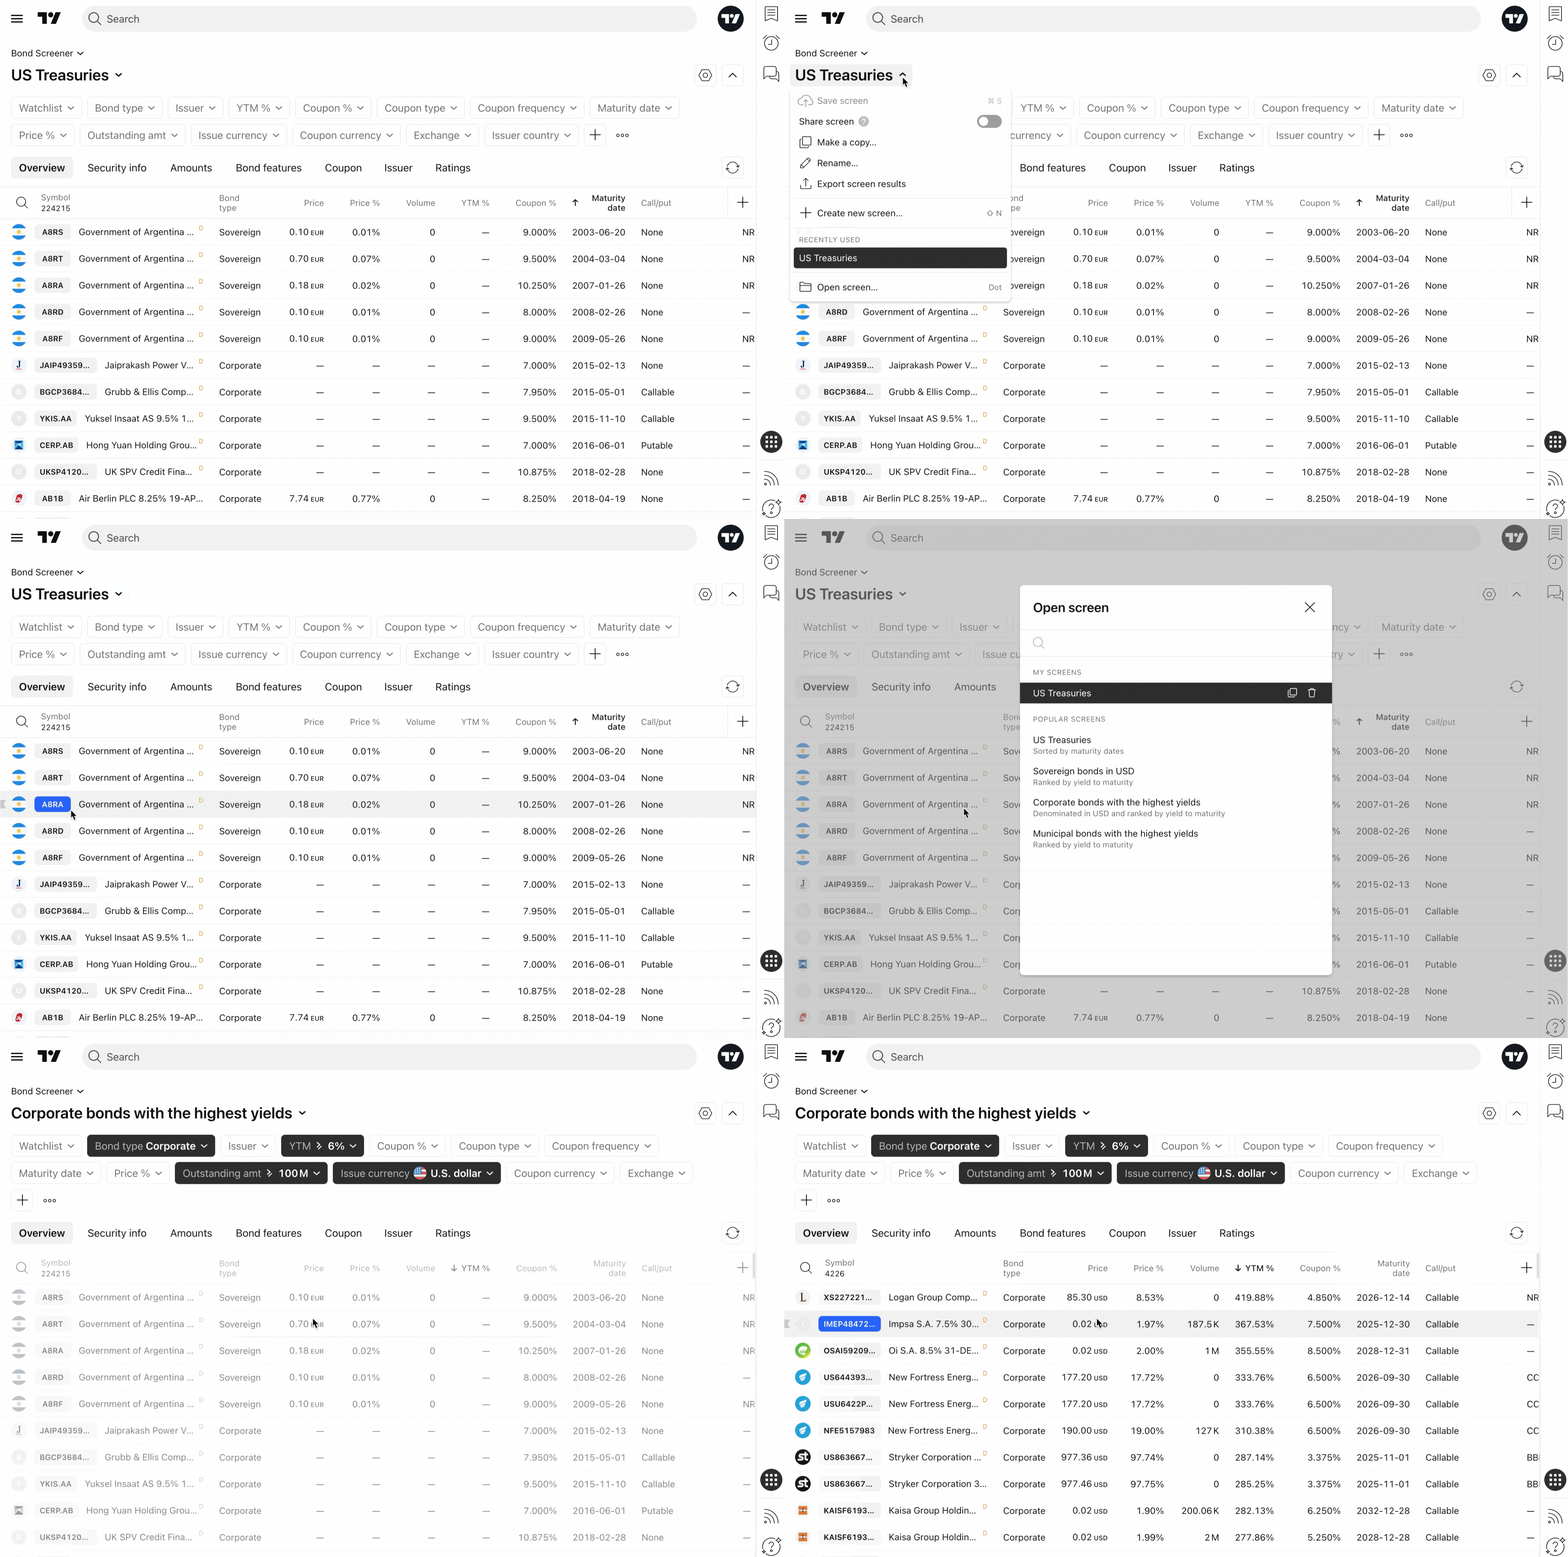
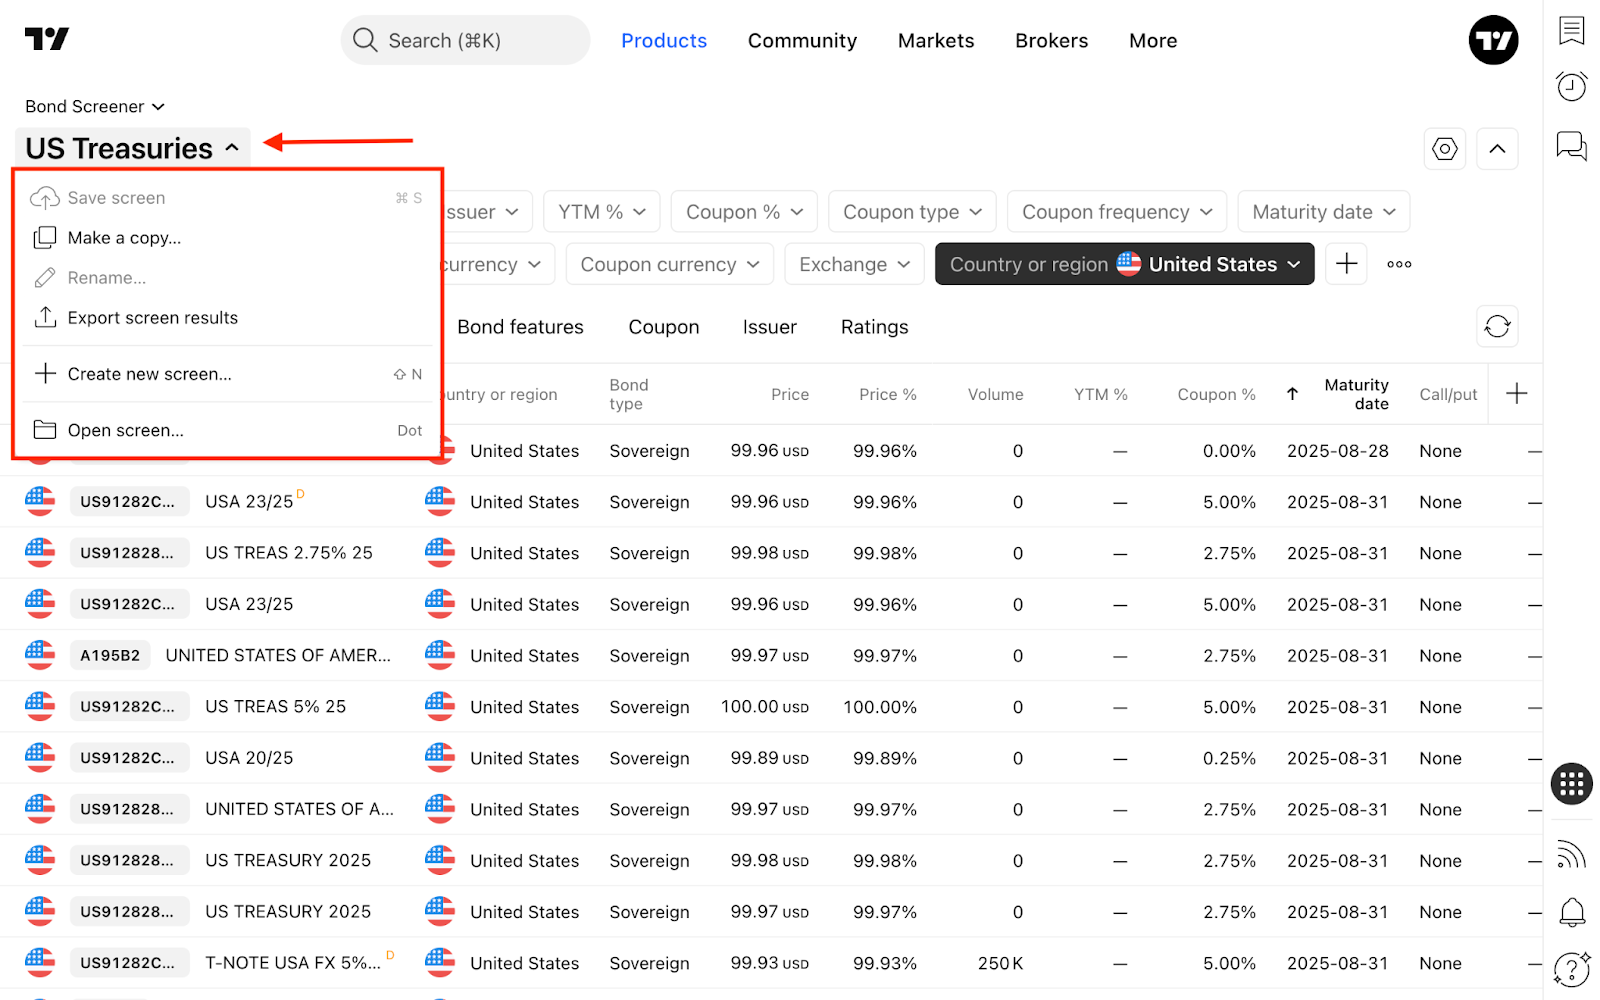
In this same dropdown menu, you can view recently used screens, export your results as a CSV file, or start a completely new screen.
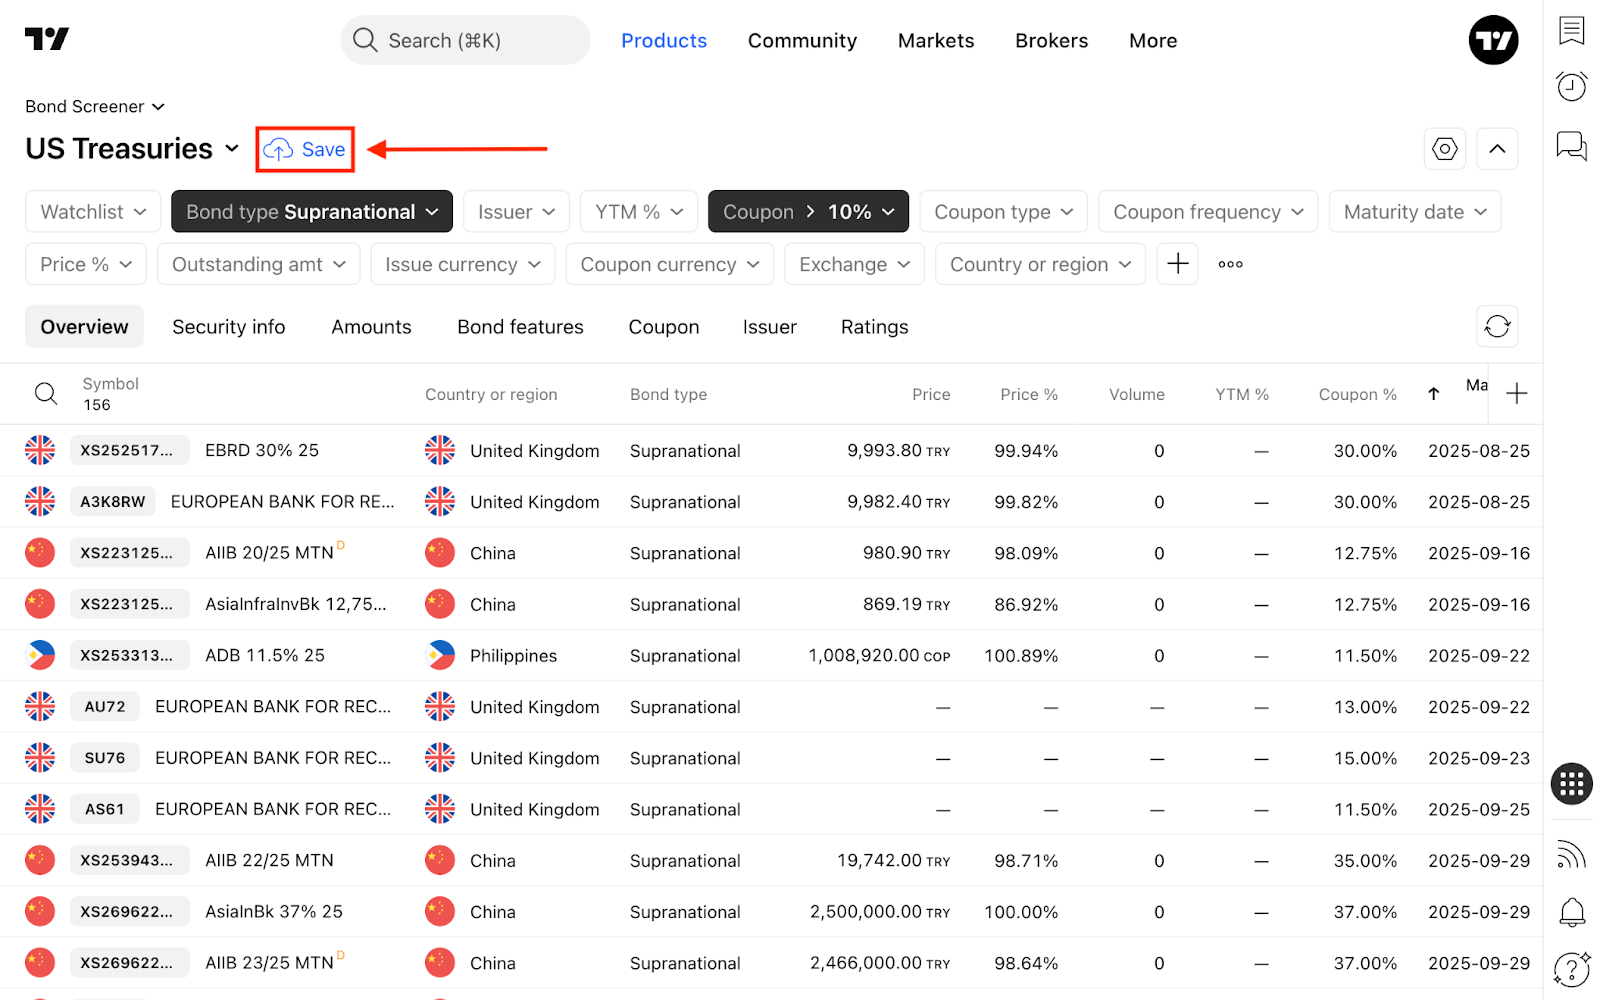
To create a personalized screen, simply select your desired filters, click the blue Save button that appears, and give your template a name.
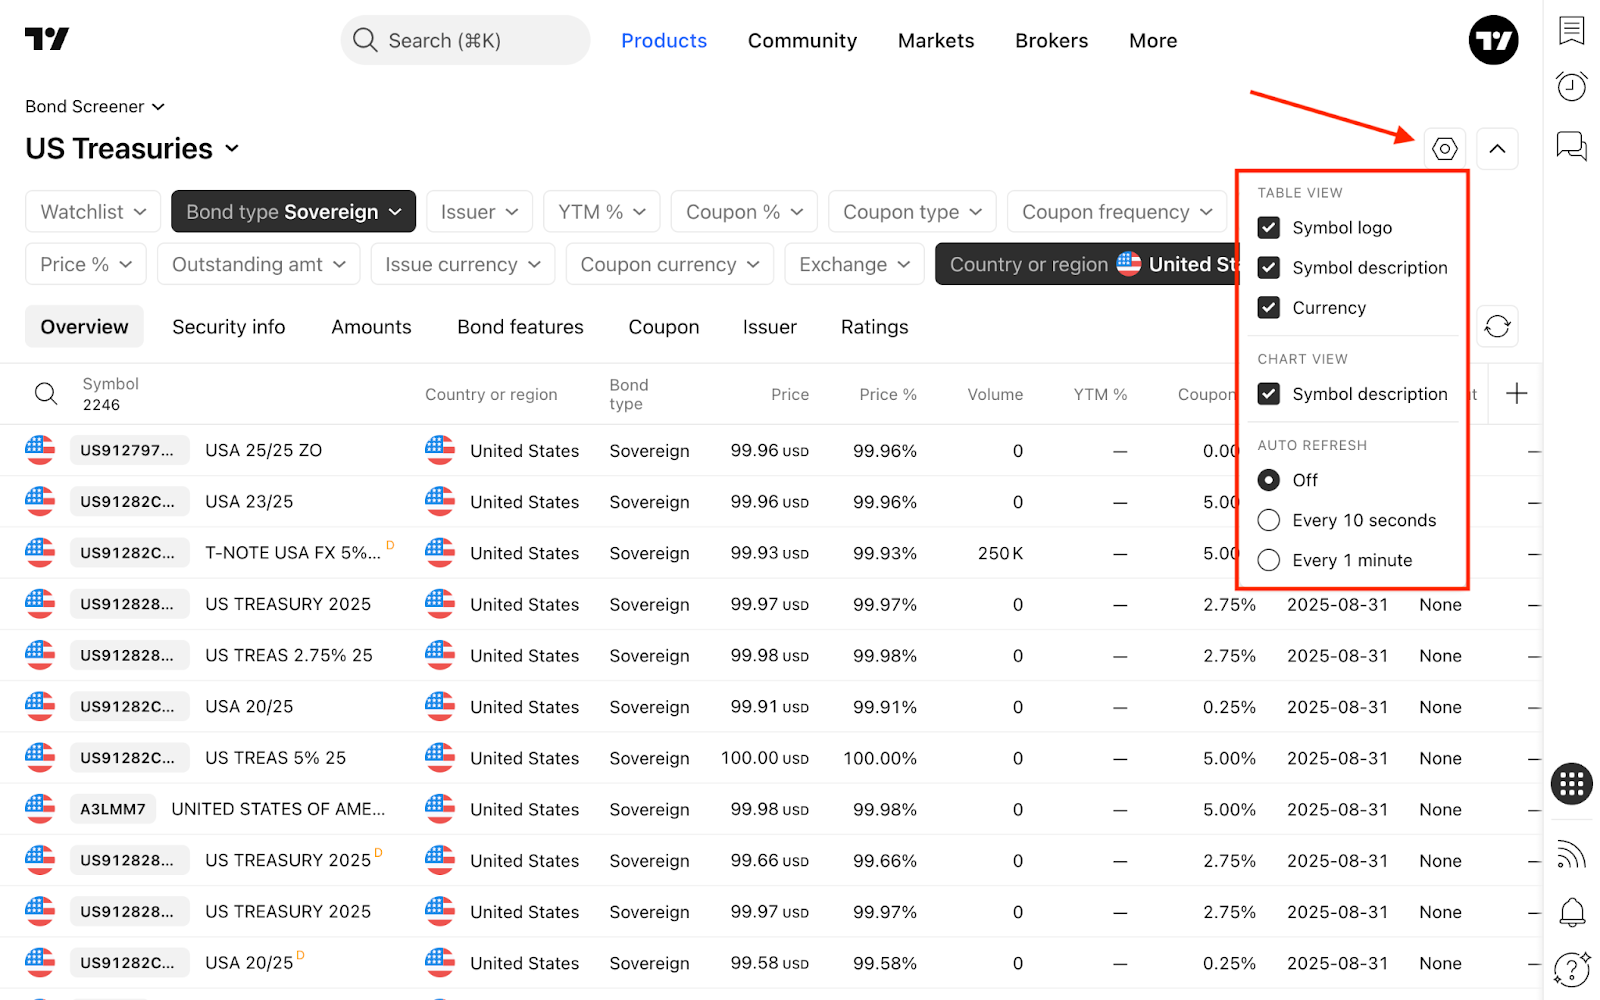
On the right side of the screen, you will find the Screener settings. Here you can customize your display preferences (toggling symbol logos, descriptions, types, and currencies) and adjust the auto-refresh frequency.
Once your screen is perfectly configured, click the Hide filters button to collapse the top panel, maximizing your workspace to view and analyze more bonds at a glance.
Filters
The Bond Screener offers numerous groups of specialized metrics that can be applied as filters. To do this, open the filter editing dialog and select your exact conditions.
To add new filter conditions, click the + button or press Shift + F.
- Security info: General information about the bond, such as price, debt type, and issue currency.
- Ratings: Insights into the issuer's reliability based on S&P analyst ratings.
- Issuer: Filter securities by type, credit parent, industry, exact issuer, or overarching sector.
- Amounts: Apply filters based on face value, denomination, or outstanding amount.
- Coupon: Filter bonds by various coupon metrics, including rate and frequency.
- Bond features: Find specific bond characteristics, such as inflation protection, Sharia compliance, or social responsibility labels.
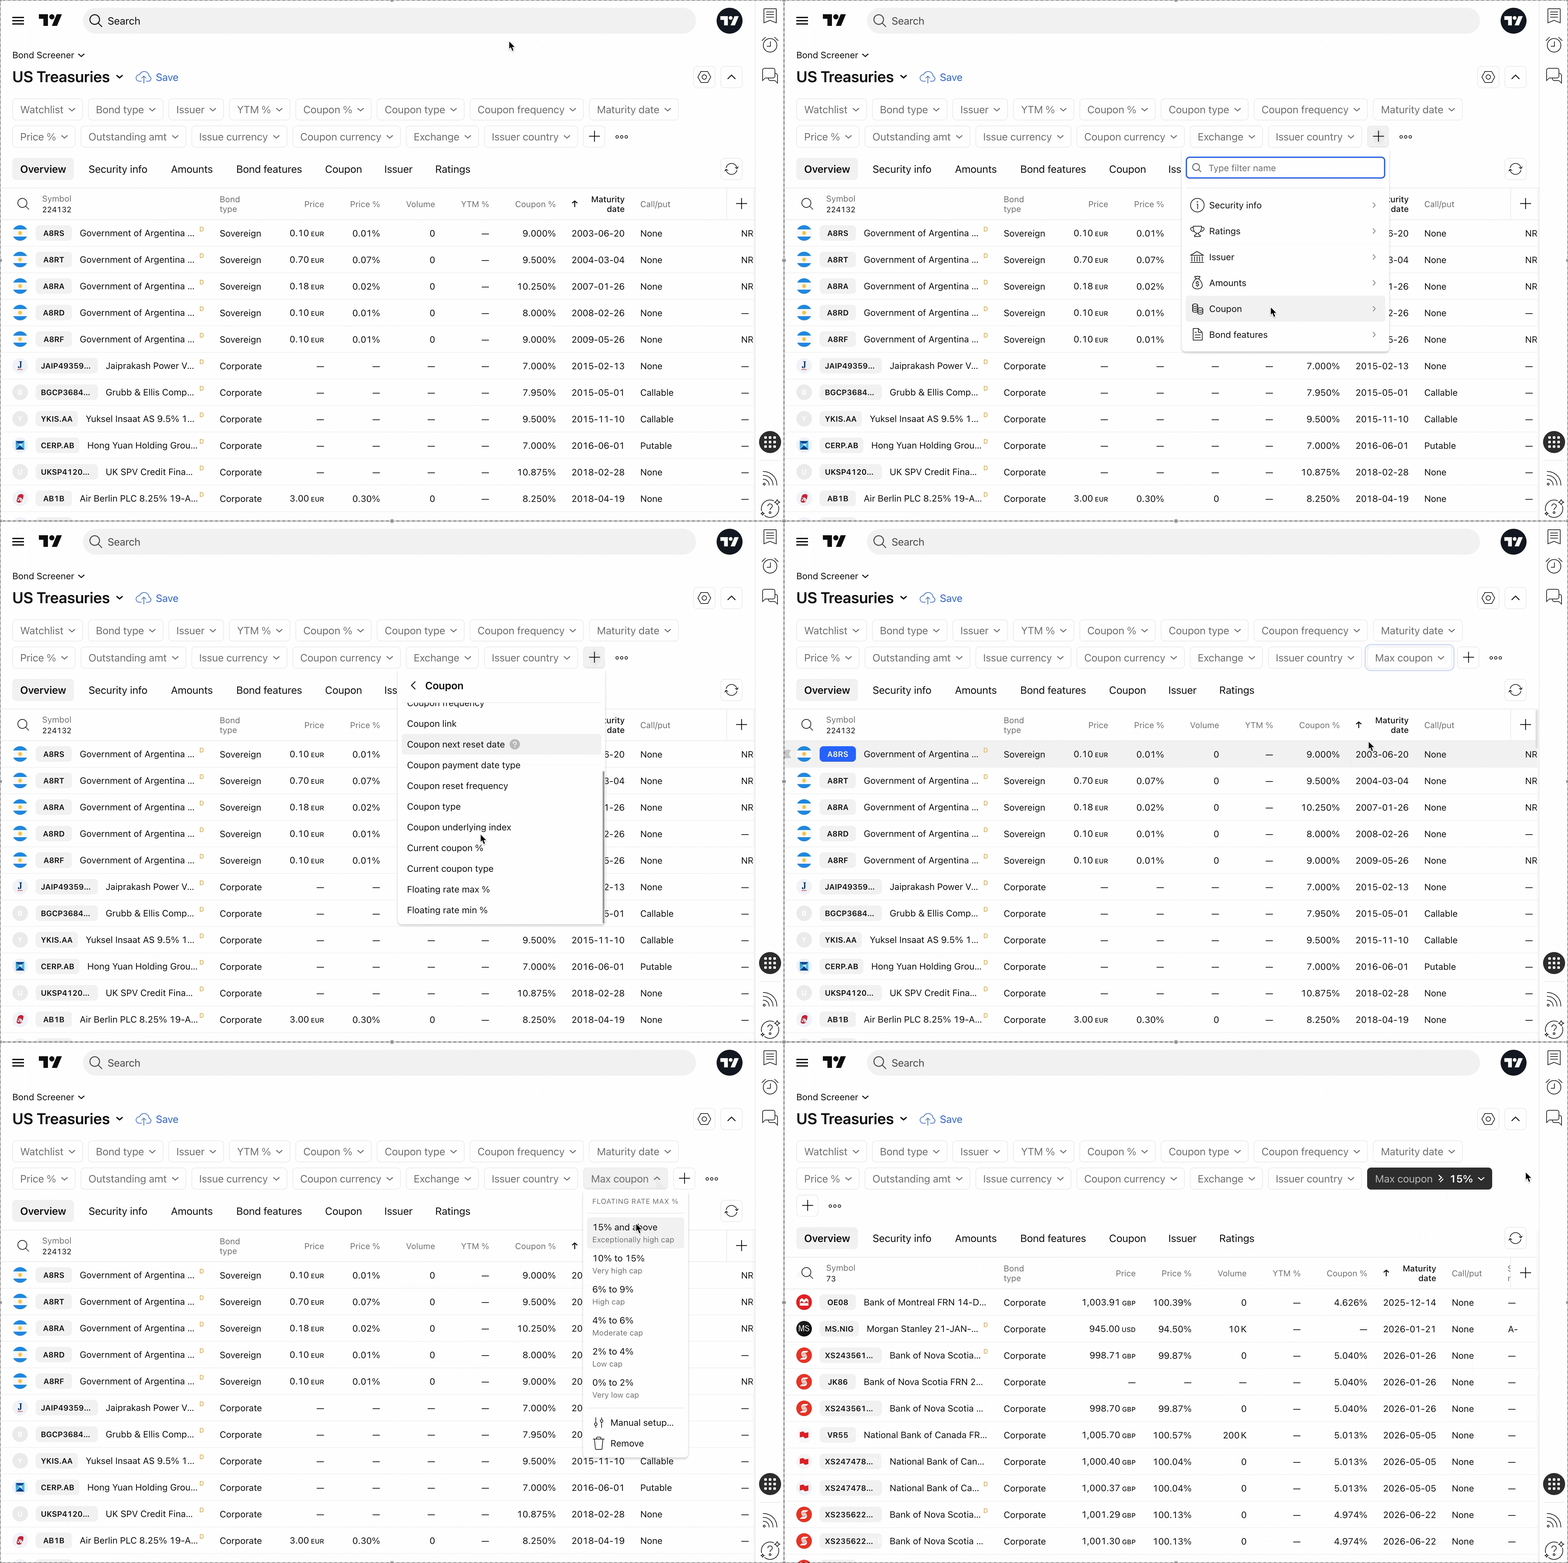
In the filter editing dialog, select the filtering condition.
To add new filter conditions, click the "+" button or press Shift + F.
Column sets
Below the filters, you will find column sets. Each set groups data relevant to a specific type of analysis. You can always add a custom column set using the + button on the right.
Here is a breakdown of the default column configurations:
- Overview: Key snapshot metrics, including country/region, bond type, price, and maturity date.
- Security info: Detailed listing data showing whether the bond is current, its term, issue date, placement type, and ownership form.
- Amounts: Financial scale metrics, including the issue amount in native currency, outstanding amount and ratio, and face value.
- Bond features: Identifies specific structural features, showing whether a bond is sinkable, convertible, secured, or redeemable.
- Coupon: Income profile detailing the coupon's frequency, type, percentage, and any changes.
- Issuer: Corporate or government details, including the issuer's full name, sector, industry, and S&P rating.
- Ratings: Creditworthiness assessments showing both long-term and short-term ratings, alongside their future outlooks.
Oh, and one more bond tool…
TradingView Yield Curves is another powerful tool designed specifically for analyzing government securities. With it, you can visually compare sovereign bonds by maturity and quickly identify the most suitable jurisdictions for your fixed-income investments.
Also read: