$GAYMF Technical AnalysisOTC:GAYMF
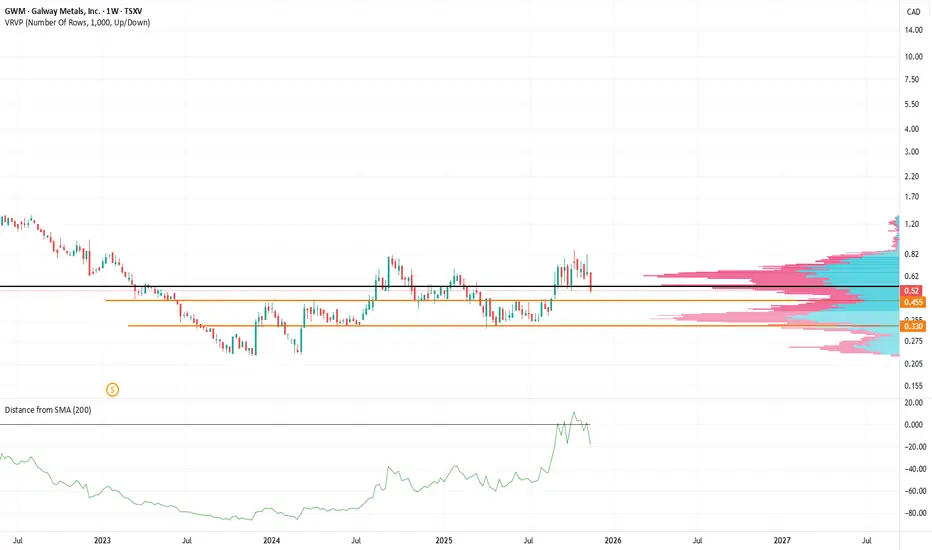
Volume breakout. RSI bullish. Span A and B of the kumo starts to travel together. The box above the price is what I call the "WP Range". A place where price tends to range before continuing up or breakdown. Also, weekly pivot next week. Long term wise, it's definitely a buy and forget.
Galway Metals Inc.
No trades
No trades
Compare with Galway Metals Inc.
−0.0598 USD
−6.12 M USD
0.00 USD
96.09 M
Next report date
—
Report period
—
EPS estimate
—
Revenue estimate
—
Company info
Sector
Industry
CEO
Robert E. Hinchcliffe
Website
Headquarters
Toronto
Founded
2012
IPO date
Jan 4, 2013
ISIN
CA3645856046
CUSIP
364585604
FIGI
BBG0043NL4T4
Identifiers
ISIN CA3645856046
Galway Metals, Inc. engages in .the acquisition, exploration, and development of mineral resource properties. Its projects include Clarence Streams and Estrades. The company was founded on May 9, 2012 and is headquartered in Toronto, Canada.
GWM.V -- Blue skies breakout on massive gold intercept!This one is for gold bugs out there. The stock is being re-rated after today's news (below). Great management, infrastructure, fully funded through 2021. Charting it is useless as it is being re-rated but it's worth looking at companies like Great Bear Resources (GBR.V) to see where it could potenti
See all ideas
Summarizing what the indicators are suggesting.
Neutral
Neutral
Neutral
An aggregate view of professional's ratings.
Neutral
Neutral
Neutral
Displays a symbol's price movements over previous years to identify recurring trends.
Frequently asked questions
The current price of GAYMF is 0.7359 USD — it has increased by 2.60% in the past 24 hours. Watch Galway Metals Inc. stock price performance more closely on the chart.
Depending on the exchange, the stock ticker may vary. For instance, on OTC exchange Galway Metals Inc. stocks are traded under the ticker GAYMF.
GAYMF stock has risen by 65.79% compared to the previous week, the month change is a 46.59% rise, over the last year Galway Metals Inc. has showed a 41.38% increase.
We've gathered analysts' opinions on Galway Metals Inc. future price: according to them, GAYMF price has a max estimate of 1.61 USD and a min estimate of 1.61 USD. Watch GAYMF chart and read a more detailed Galway Metals Inc. stock forecast: see what analysts think of Galway Metals Inc. and suggest that you do with its stocks.
GAYMF reached its all-time high on Aug 6, 2020 with the price of 4.7241 USD, and its all-time low was 0.1650 USD and was reached on Oct 9, 2023. View more price dynamics on GAYMF chart.
See other stocks reaching their highest and lowest prices.
GAYMF stock is 13.89% volatile and has beta coefficient of 2.58. Track Galway Metals Inc. stock price on the chart and check out the list of the most volatile stocks — is Galway Metals Inc. there?
Today Galway Metals Inc. has the market capitalization of 84.81 M, it has increased by 23.70% over the last week.
Yes, you can track Galway Metals Inc. financials in yearly and quarterly reports right on TradingView.
Galway Metals Inc. is going to release the next earnings report on Nov 26, 2026. Keep track of upcoming events with our Earnings Calendar.
GAYMF net income for the last quarter is −2.70 M USD, while the quarter before that showed −1.80 M USD of net income which accounts for 0.00% change. Track more Galway Metals Inc. financial stats to get the full picture.
No, GAYMF doesn't pay any dividends to its shareholders. But don't worry, we've prepared a list of high-dividend stocks for you.
Like other stocks, GAYMF shares are traded on stock exchanges, e.g. Nasdaq, Nyse, Euronext, and the easiest way to buy them is through an online stock broker. To do this, you need to open an account and follow a broker's procedures, then start trading. You can trade Galway Metals Inc. stock right from TradingView charts — choose your broker and connect to your account.
Investing in stocks requires a comprehensive research: you should carefully study all the available data, e.g. company's financials, related news, and its technical analysis. So Galway Metals Inc. technincal analysis shows the buy rating today, and its 1 week rating is buy. Since market conditions are prone to changes, it's worth looking a bit further into the future — according to the 1 month rating Galway Metals Inc. stock shows the strong buy signal. See more of Galway Metals Inc. technicals for a more comprehensive analysis.