NFLX Weekly: Macro Trendline Bounce & The AB=CD Path to $188The weekly setup on Netflix (NFLX) is developing into an even more compelling narrative. Following up on the critical support confluence identified previously, we can now map out a clear AB=CD measured move that provides a massive upside target.
Here is the context and reasoning behind this updated technical structure:
The Foundation (Point C): Price has perfectly backtested the macro ascending trendline from the 2022 lows, aligning tightly with the 0.5 Fibonacci retracement zone at 75.37. The
AB=CD
BTC/USD testing the resolve of major demandThere is a lot to digest on BTC/USD right now. Longer-term flow shows that buyers and sellers are squaring off in a sizeable demand area at US$49,039-74,022 (black). While buyers are beginning to appear in the US$60,000 range, I cannot help but be drawn to the US$35,000-44,957 area. The reasoning is simple. There are likely a substantial number of sell stops located under the large monthly demand area. Tripping these orders could provide enough liquidity to buy from demand at US$39,886-44,957 (o
AUDUSD down to 67.7centsAUDUSD in down trend and has broken the H1 Extreme Zone. Its likely to meet with the H4 and D1 Extreme Zones that are combined. We will likely see resistance at 50% (~69cents) with a retracement pause upwards here before another aggressive fall to around 67.7cents.
There after later an uptrend to > 71.5cents will likely follow.
BTC Forming AB=CD in Downtrend – Breakdown Incoming?Market Structure:
#Bitcoin is clearly trading in a strong downtrend, printing consistent Lower Lows (LLs) and Lower Highs (LHs) on the lower timeframes — confirming bearish market control.
On the 15-minute timeframe, price is forming a clean AB=CD harmonic pattern, and importantly:
No bullish divergence
No reversal confirmation
No strong buying pressure visible
This increases the probability of continuation to the downside.
Trade Plan:
We are not jumping in early.
Smart money waits for confir
Harvard Among Top 20 Holders of iShares Bitcoin TrustHarvard University has made a striking move in its investment strategy. The university’s endowment now holds a bigger position in Bitcoin ETFs than in any individual stock. Specifically, Harvard tripled its stake in the iShares Bitcoin Trust ( NASDAQ:IBIT ), making it the largest publicly disclosed U.S. equity holding for the endowment.Harvard University’s Bitcoin ETFs Outweigh Traditional Stocks
According to recent SEC filings, Harvard now holds approximately $442.8 million in Bitcoin ETFs. By
Major Reversal Setup: Gartley's "3 Drives" Top Completes on Dow⚠️ WARNING: Gartley's "3 Drives" Top Signals a Major Dow Reversal
A significant and historically reliable technical pattern appears to be completing on the Dow Jones (YM) futures chart. This development warrants a closer look for its potential implications on market structure.
🔍 The Pattern in Focus
The chart exhibits the hallmarks of a "Three Drives to a Top" formation—a pattern documented by technical analyst H.M. Gartley. It is characterized by three successive price advances, each cul
$XAUUSD - Possible ABCD and long retraceHi guys! 👋
🔔 Gold is currently pushing higher into a well-defined resistance zone around $5,220–$5,290, but momentum conditions suggest this move is corrective rather than impulsive. A clear bearish RSI divergence has formed on the hourly timeframe, indicating weakening upside strength despite higher prices.
🔔 Price advancing into $5,220–$5,290 resistance, with signs of exhaustion. Bearish RSI divergence on H1 suggests weakening upside momentum
🔔 Broader trend remains bullish after corrective
BTCUSDT BULLISH TRADING PLANBitcoin is currently repeating the same price behavior as the previous higher-high (HH) pattern. After forming a new HH, BTC followed with a similar corrective drop—almost identical to the previous cycle. Price has now taken support at the same structural zone, indicating strength and a potential continuation of the bullish script.
As long as this support holds, BTC is expected to move upward toward the next major target zone at $170,000–$172,000.
BTC has now bottomed?4 out of 5 buy orders within the green zone has hit. BTC bottomed
Will start cautiously DCA into BTC (and more aggressively within the green zone). Will only start reallocating into $Kaspa, CRYPTOCAP:ETH , GETTEX:TAO , CRYPTOCAP:ZEC and other Alts once the current bearish trend has been broken and a new weekly bull trend has been re-established.
This idea is continued analysis from previous published chart that got hidden by TV due to me accidently using one of my invite-only script in m
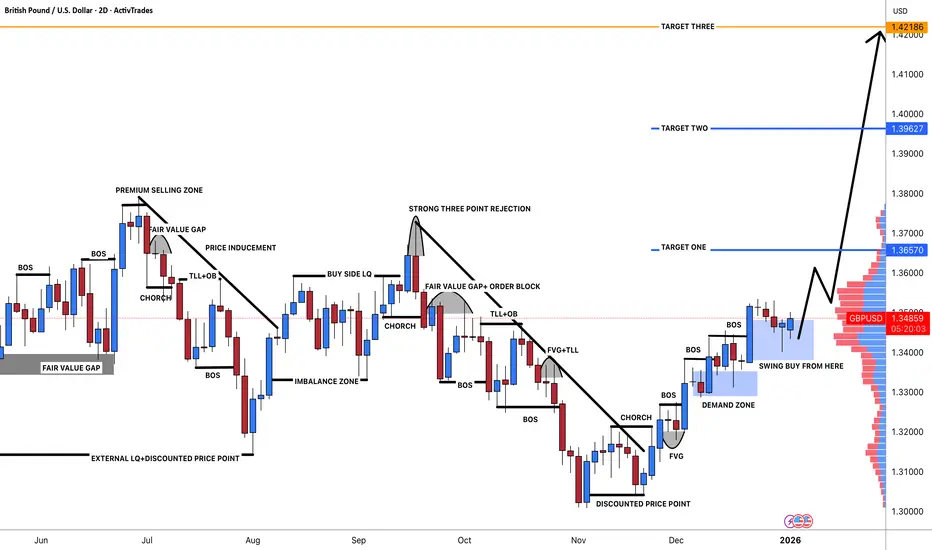
#GBPUSD: Three Targets Swing Buy 720+ Pips Move **Trading Setup For GBPUSD 1 Daily Time Frame**
🔺After a while where the price was mostly down, it hit a low of 1.30 but then turned around. Since then, it has been climbing steadily, with little dips that have only made it go higher. Right now, it is at 1.3490, which we think is a good time to start a long position in GBPUSD.
🔺Trading at the current price is a smart move because the price is up, which helps keep our risk in check and makes the trade more likely to succeed. We can put a stop-l
8060 Weekly Technical Analysis: Bullish Setup in Play8060 (Walaa Cooperative Insurance Co.)
Price reacted strongly from a major weekly support, accompanied by a clear bullish divergence on the weekly RSI. Price has also given a downward trendline breakout, improving the short- to medium-term structure.
A bullish harmonic AB=CD pattern is in play, adding pattern confluence at the support zone. Buy 2 is placed lower to allow for a healthier average in case of a pullback, while risk is clearly defined on a closing basis below the key support.
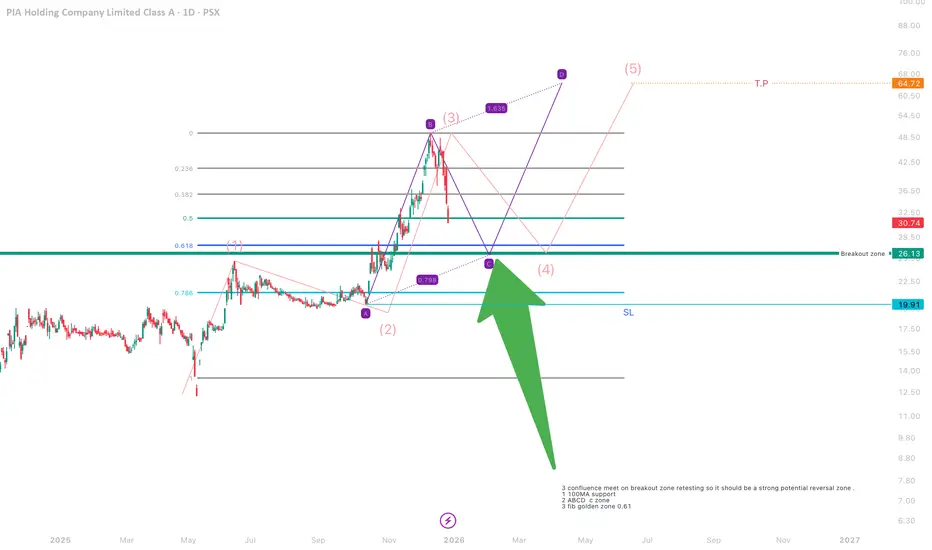
PIAHCL I am Anticipating that PIA is on a potentially deeply retracement after a long rally but peoples are worrying is it going to crash there is no need to worry it’s a healthy correction for next move . But be cautious take entries with strict stop loss which is highlight on chart .
As we are all know trading is just probility game please do your own research before investing it’s a highly volatile stock with weak fundamentals .
GBPNZD: One Swing Entry With One Swing TargetDear Traders,
I hope you’re doing well. We have a fantastic opportunity coming up where the price could move up in an impulse pattern. This trading setup requires just one entry and one swing target but you might also consider using intraday take profit zones.
Like and comment on this post, also please follow us. This will encourage us to share more trading setups!
Team Setupsfx_
GOLD – AB=CD Bullish Setup | High-Probability Long Opportunity#GOLD is currently trading inside a strong buying zone, and the 1D timeframe is forming a clear AB = CD harmonic pattern.
The AB leg has fully completed, and the CD leg is now in progress, indicating a potential continuation toward the completion zone.
Why This Setup Matters
AB=CD harmonic pattern shows a strong bullish continuation structure
Price is holding within a perfect buying range
No bearish signals on the higher timeframe
Higher-timeframe trend supports long positions
Trading Plan
Beautifully made HH and then HL.QUICE Analysis
Closed at 38.93 (16-01-2026)
Beautifully made HH and then HL.
Crossing & Sustaining 46 may lead it towards 59 - 60.
Immediate Support seems to be around 35.
However, it should not break 31 now else we
may witness more selling pressure towards 28 initially.
XAUUSD - Market Structure Context (Higher vs Lower Timeframe)PEPPERSTONE:XAUUSD — Market Structure Context (Higher vs Lower Timeframe)
From a higher timeframe perspective , XAUUSD remains in an overall uptrend .
The broader market structure is still bullish, with price respecting higher highs and higher lows.
On the lower timeframe , price is currently trading inside a wider trading range .
Within this range, the market is also forming an ABCD channel , gradually moving higher but without strong momentum.
At this stage, the market is facing mult