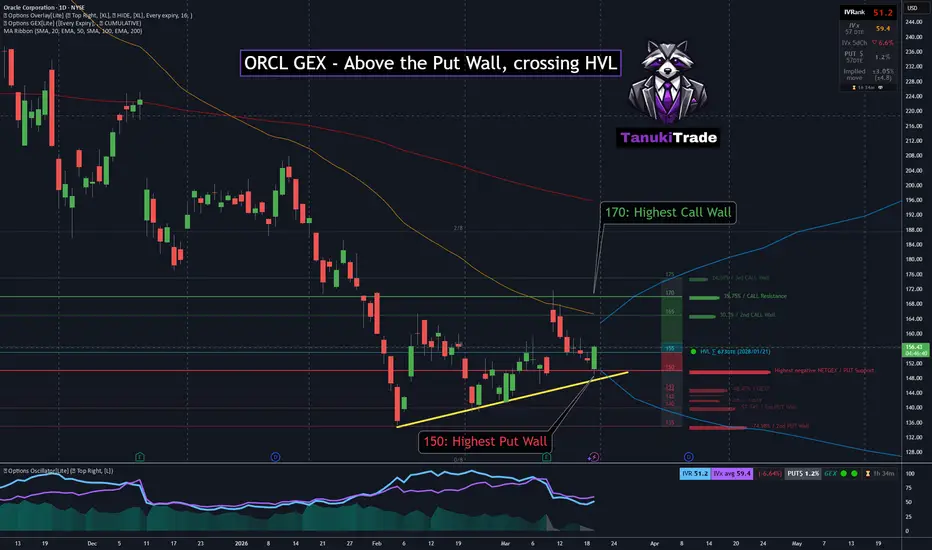
ORCL GEX - Above Put Wall, crossing HVL🔶 Trendline Support Holds, Price Reclaiming HVL into Positive GEX Zone 🔶
The chart is showing a developing stabilization attempt after a recent decline.
Price has been respecting an ascending trendline from the 135 area up toward 150, providing a clear structural support for the current move. This trendline now acts as a key reference for short-term momentum.
At the same time, price is trading above the 150 put GEX level, which represents the largest downside positioning level and reinforces the importance of this zone as a structural zone.
What makes the current setup interesting is that price is now attempting to reclaim the High Volatility Level (HVL), currently around 155.
This matters.
A move and sustained hold above HVL would shift the environment back into a positive GEX regime, where price behavior typically becomes more stable and volatility tends to compress.
🔶 Options Structure Context 🔶
- 150 – largest put GEX support
- 155 (HVL) – regime pivot, currently being tested
- 170 – highest call GEX level and upside reference
If price can stabilize above HVL, it would effectively move into a positive gamma zone, opening the path toward the next major call cluster.
After a sharp decline, the focus now shifts to whether this trendline + HVL reclaim combination can trigger a more stable recovery phase.
As always, the key signal will not be the level itself — but how price behaves after the HVL reclaim attempt. AAPL GEX - Testing HVL in a Volatile Regime🔶 AAPL – Holding Above 200 EMA, Testing HVL in a Volatile Regime 🔶
AAPL is currently sitting at a key technical and options-driven inflection point.
On the daily chart, price recently bounced from the 200-day moving average, forming a short-term double bottom structure while continuing to respect an ascending trendline. This area now acts as an important support zone for the current structure.
However, price is currently trading just below the High Volatility Level (HVL), which sits around 255.
This matters.
Below HVL, the market typically shifts into a more reactive and volatile regime, where price movements can become less stable compared to the more controlled behavior seen in positive gamma environments above HVL.
🔶 Options Structure Context 🔶
- 250 – largest put GEX level and structural support
- 255 (HVL) – regime pivot, currently acting as resistance
- 280 – highest call GEX level (far for now)
With price sitting just under HVL, the focus is not on the distant call levels yet, but rather on whether AAPL can reclaim and hold above the HVL zone.
🔶 Key Structure to Watch 🔶
- 200 EMA – technical support and recent bounce zone
- Ascending trendline – short-term structure support
- 250 – Put Wall
- 255 (HVL) – regime shift level
If AAPL can move back above HVL and hold that level, the structure could stabilize inside a more controlled, positive gamma environment.
Failure to reclaim HVL, however, keeps the stock in a more volatile and reactive regime, where external factors especially ongoing geopolitical tensions and energy-driven market stress can continue to dominate price action.
For now, the key question is simple:
👉 Can AAPL reclaim HVL and stabilize — or does volatility remain in control?
Best,
Greg USO: Extreme Call Pricing Skew🔶 USO – Explosive Gap Up, Extreme 500% Call Skew Appears 🔶
USO, the oil ETF, is experiencing an unusually aggressive move higher.
The market opened today with a massive 8% gap up, continuing the strong upside momentum driven by escalating geopolitical tensions involving Israel, Iran, and the United States. Moves of this magnitude are rare for USO and immediately push options positioning into extreme territory.
🔶 Options Structure 🔶
The current GEX profile highlights two major positioning anchors:
- 100 – largest put gamma wall
- 120 – largest call gamma wall
Price is currently moving rapidly between these zones as volatility expands.
🔶 Extreme Call Pricing Skew 🔶
One of the most notable developments is the call pricing skew, which has surged to approximately 500%.
In practical terms, this means that equidistant call options are currently priced roughly five times higher than comparable put options relative to the at-the-money level. Such an imbalance is extremely rare and reflects the intense demand for upside exposure in oil-related assets.
Events driven by geopolitical shocks often produce these types of temporary distortions in the options market.
🔶 What This Means For Options Traders 🔶
When call skew becomes extremely elevated, it can sometimes create opportunities for defined-risk structures, such as call butterflies, which may become relatively inexpensive due to the inflated pricing of the outer calls.
Of course, these situations come with a major caveat:
The market direction remains highly uncertain, and volatility driven by geopolitical developments can continue pushing price in either direction.
For now, USO sits in a highly unusual options environment where momentum, volatility, and extreme skew are all interacting at the same time.
Situations like this don’t occur often — which is exactly why they are worth watching closely. GOOGL GEX - Curling back above HVL🔶 GOOGL – Triple Bottom Holding Above HVL, Positive GEX Stabilization
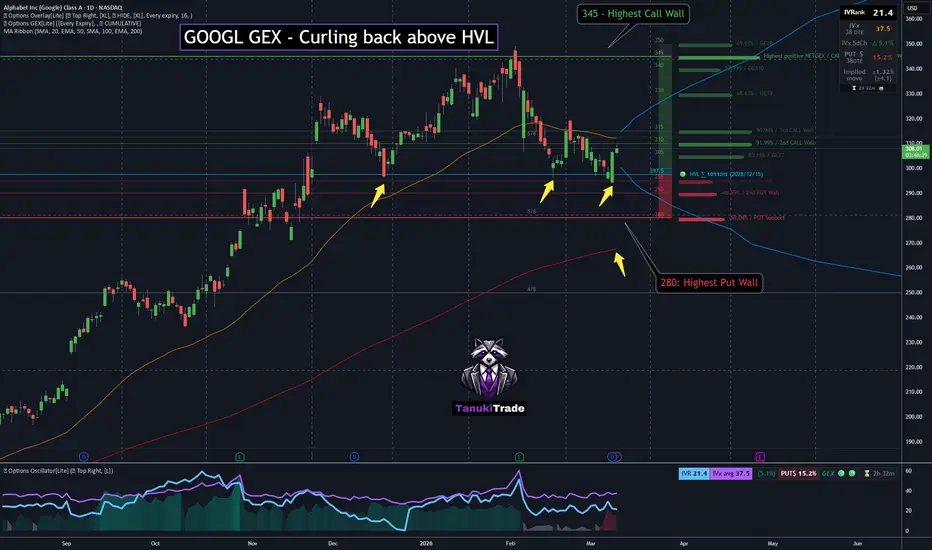
GOOGL is starting to show signs of stabilization after reclaiming the High Volatility Level (HVL) .
On the daily chart, price has now bounced three separate times from the same zone around 295–300 , forming a clear triple bottom structure . While repeated tests never guarantee a reversal, multiple successful defenses of the same level often signal strong positioning support.
This rebound has pushed price back above HVL , placing GOOGL inside a positive GEX regime once again.
In positive gamma environments, dealer hedging typically works with the trend rather than against it , which often results in lower realized volatility and more stable price behavior compared to negative gamma regimes.
🔶 Technical Context 🔶
From a technical perspective:
Price remains well above the 200-day moving average
The stock is currently just below the 50-day moving average
A reclaim of the 50-SMA could further strengthen the short-term structure
🔶 Options Structure 🔶
The current GEX profile defines a relatively wide positioning range:
280 – largest put wall and major downside reference
345 – highest call wall and primary upside magnet
With price currently sitting in the middle of this range, the focus shifts to whether the triple bottom reaction can generate enough momentum to push price higher toward the call cluster.
🔶 Key Structure to Watch 🔶
295–300 – triple bottom reaction zone
HVL – regime pivot, currently reclaimed
280 – largest put GEX support
345 – highest call GEX resistance
As long as GOOGL holds above HVL and the triple bottom zone remains intact, the structure favors continued stabilization with volatility compression inside a positive gamma environment .
The key signal will be how price behaves on momentum moves away from the 300 zone . AMZN – Breakout Above HVL, Watching the 220 Call GEX ClusterAMZN has recently pushed higher and is now trading comfortably above the High Volatility Level (HVL), placing the stock back inside a positive GEX regime.
The recent move follows a clean stabilization above the 200 put support zone, where the market previously found strong positioning support. From that area, price has continued to build momentum and is now trending higher.
Being above HVL typically places the market in a positive gamma environment, where volatility tends to compress and price action becomes more stable as dealers hedge in the direction of the move.
🔶 Options Structure Context 🔶
From an options perspective, the next major level sits at 220, which currently represents the largest call GEX concentration.
This level is technically significant because it also aligns closely with the 50-day and 200-day moving averages, creating a notable confluence zone where both technical traders and options positioning may interact.
🔶 Key Structure to Watch 🔶
200 – major put support / recent reaction zone
HVL – regime pivot, currently reclaimed
Positive GEX zone – volatility compression environment
220 – highest call GEX level and technical confluence
As price moves higher within a positive gamma environment, the key question becomes whether AMZN can reach and engage the 220 call cluster.
As always, the level itself is only part of the story — what matters most is how price reacts once it gets there. For now, momentum and reaction around 220 remain the key signals to watch.  Education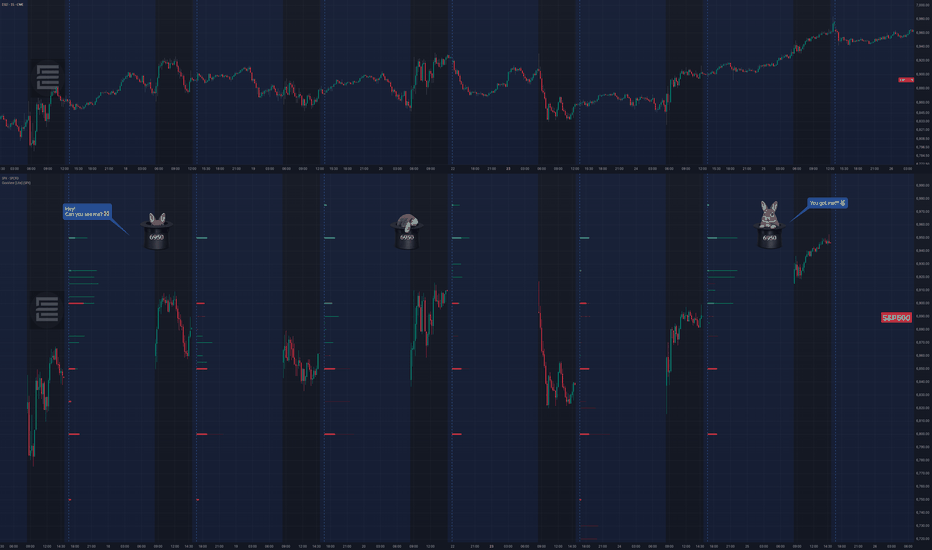
Gamma Exposure Setup: Finding Alignment Between SPY and VIXIn this educational idea, we want to share one of our best trading setups, which appears from time to time. We use gamma exposure as the framework for our analysis, and we want to keep it as simple as possible.
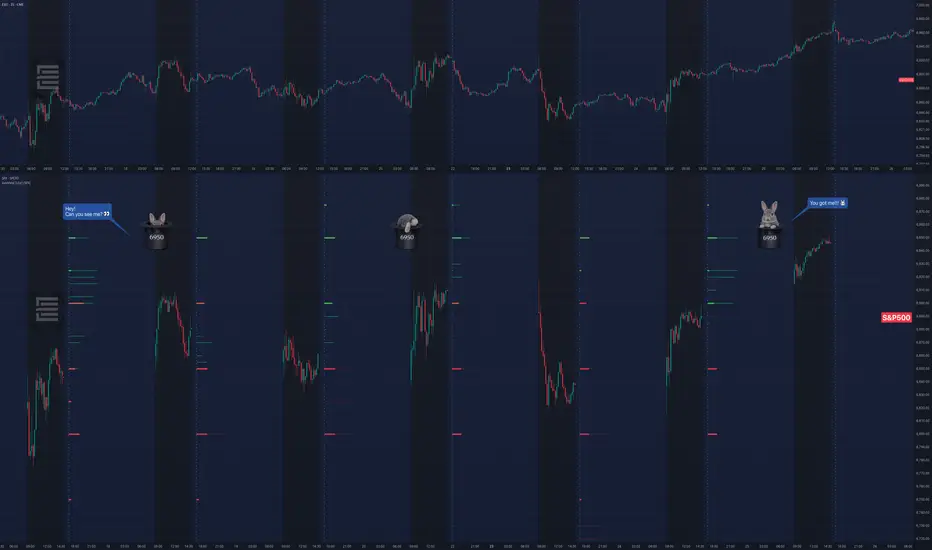
Before we begin, here are some important notes on how to build our chart templates: We don’t open AMEX:SPY directly; instead, we prefer to open CME_MINI:ES1! as the main symbol and plot the AMEX:SPY in a new pane below. With this approach, we can view the full gamma exposure of the previous day before the spot market opens, as we have 23 hours per day on our charts. Then, we add the GexView indicator, which helps us monitor how gamma exposure has developed over the last five days. We analyze it like the classic Volume Profile indicator, looking to find major and repeatable levels. Finally, we add a momentum indicator. We prefer the twice-awarded MACD-V indicator by Alex Spiroglou.
From a bird’s-eye view, we can see that on AMEX:SPY , one of the major gamma levels during these days is 690. Some levels are added, while others disappear completely, but the 690 gamma level remains in place. Especially on February 23, it represents the largest gamma level and acts as a magnet for price. After the market opens during RTH, the ticker touches exactly the 690 price level and immediately rejects it (1). We can add to our analysis the negative divergence between the MACD-V and the ES futures contract (2). As CME_MINI:ES1! completes a higher high, the MACD-V creates a lower high, triggering a negative divergence. Are these two signals enough to take action and enter a trade?
No. We need confirmation from an asset moving in the “opposite” direction, like TVC:VIX . Look at the image. The gamma level that separates positive from negative gamma is at 20. On February 23, it represents the largest gamma level of the day. During Extended Trading Hours, TVC:VIX seems to find support at 20 (1). However, after the market opens (RTH), TVC:VIX makes a false breakdown (bear trap) at 20 and immediately rises rapidly (2). Note that this false breakdown happens at the same time AMEX:SPY hits resistance. It’s the perfect alignment between AMEX:SPY and TVC:VIX . In addition, we observe the same MACD-V behavior, but from the opposite side. It now produces a positive divergence for the CBOE:VX1! futures contract (3).
That’s it — simple, clean, and effective. We trade setups like this using CME_MINI:NQ1! or CME_MINI:ES1! , and now we patiently wait for the next opportunity to appear.
Education 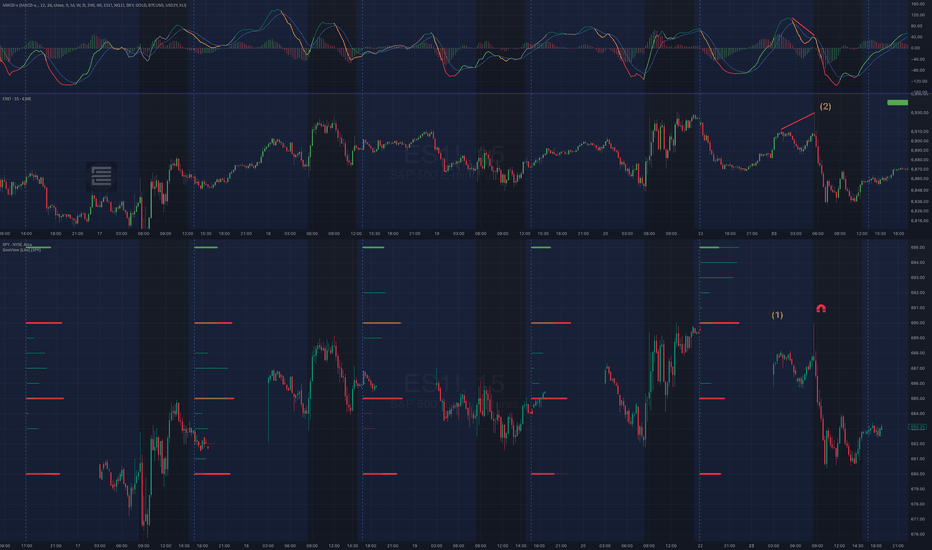
Why Gold Remains the Dominant Macro Hedge into Q1 2026🔱 GOLD Q1 2026 MACRO SNAPSHOT — EXECUTIVE SUMMARY
✨ Structural bull trend remains dominant into Q1 2026 as macro + flow regime stays supportive
🟡 Primary macro unlock: sustained suppression of real yields + soft USD regime
🚀 Convex upside risk driven by ETF re-allocation + options gamma reflexivity
🏦 Central-bank demand continues to anchor downside — pullbacks remain shallow and brief
🌍 Geopolitics (Iran / sanctions / energy risk) + Trump policy wildcard inject tail-risk premium
🧨 Trade / tariff escalation remains inflationary + growth-negative = gold-positive asymmetry
🧲 Options positioning introduces gamma squeeze risk near key psychological levels
🛡 Bull case intact unless real yields reprice sharply higher (low-probability base case)
🎯 Q1 bias: buy pullbacks within macro support zones; expect sharp upside bursts on catalysts
🏦 Strategic stance: accumulation on dips, monetize volatility spikes, respect gamma-driven extensions
📊 GOLD Q1 2026 — CATALYST SCORECARD
1️⃣ Fed Path & Real Yields — 9.2 / 10 (Primary Driver)
Lower or capped real yields remain the single most important determinant of gold’s medium-term trajectory. Entering Q1 2026, markets continue to price a regime where policy flexibility dominates over inflation-fighting urgency. Any growth wobble or labor-market softening reinforces this dynamic, keeping the opportunity cost of holding gold suppressed.
Why this matters in Q1:
Gold doesn’t need aggressive cuts — it needs confidence that real yields won’t rise. That condition remains intact.
________________________________________
2️⃣ Central-Bank Buying / De-Dollarization — 8.6 / 10 (Structural Floor)
Official-sector demand remains price-insensitive and persistent, led by EM reserve managers diversifying away from USD concentration. This flow acts less like momentum chasing and more like strategic balance-sheet allocation, creating durable downside support.
Why this matters in Q1:
Central banks reduce drawdown depth and shorten correction cycles — a critical structural tailwind.
________________________________________
3️⃣ U.S. Dollar Regime Shift — 8.4 / 10 (Mechanical + Psychological)
A softer or unstable USD regime boosts gold through two channels:
1. Mechanical FX translation for non-USD buyers
2. Erosion of the “confidence premium” embedded in USD assets during policy uncertainty
Why this matters in Q1:
Gold benefits not just from USD weakness, but from USD credibility risk — an underappreciated accelerant.
________________________________________
4️⃣ Trade / Tariff Shock Risk — 8.3 / 10 (Asymmetric Upside)
Tariffs are uniquely bullish for gold because they introduce:
• Inflation risk
• Growth uncertainty
• Policy unpredictability
This is one of the rare macro combinations where gold can rally even if risk assets struggle.
Why this matters in Q1:
Any renewed tariff escalation immediately feeds inflation hedging demand without requiring a recession trigger.
________________________________________
5️⃣ ETF & Institutional Allocation Flows — 8.0 / 10 (Trend Amplifier)
ETF flows confirm whether gold is a “trade” or a portfolio allocation. Recent behavior signals the latter. Once institutions reweight, flows tend to persist across quarters, not days.
Why this matters in Q1:
ETF demand converts macro tailwinds into price persistence, not just spikes.
________________________________________
6️⃣ Geopolitics (Iran, Sanctions, Energy Risk) — 7.8 / 10 (Event → Macro Bridge)
Geopolitics matters most when it threatens:
• Energy supply
• Shipping routes
• Sanctions spillovers
Iran-related escalation risk sits at the intersection of all three, making it materially relevant rather than headline noise.
Why this matters in Q1:
If energy prices stay elevated or volatile, geopolitical risk migrates directly into real yields and inflation expectations.
________________________________________
7️⃣ Trump Policy Wildcard — 7.6 / 10 (Fat-Tail Premium)
Markets price Trump-era policy not as a single forecast, but as distributional uncertainty:
• Tariffs
• Sanctions
• Diplomatic volatility
This raises implied volatility, FX uncertainty, and safe-haven demand before events occur.
Why this matters in Q1:
The wildcard embeds a persistent risk premium into gold rather than episodic spikes.
________________________________________
8️⃣ Gamma Squeeze / Options Reflexivity — 7.5 / 10 (Convex Accelerator)
Options positioning can force dealers into pro-cyclical hedging, meaning:
• Rising price → forced buying → further upside
• Particularly potent near psychological round levels
Why this matters in Q1:
Gamma effects don’t create trends — they accelerate existing ones, turning steady inflows into vertical price action.
________________________________________
🧠 Q1 2026 — How These Catalysts Interact (Key Insight)
Gold’s strength is not coming from a single driver, but from layered reinforcement:
• Real yields + USD define the trend
• Central banks + ETFs define the floor
• Tariffs + geopolitics + Trump wildcard define tail risk
• Gamma positioning defines speed and volatility
This is why pullbacks remain shallow and rallies tend to extend further than expected.
________________________________________
⚠️ What Would Actually Break the Bull Case?
Only scenarios that meaningfully raise real yields:
• Hawkish inflation surprise forcing policy re-tightening
• Sustained USD resurgence driven by growth dominance
• Abrupt de-escalation of trade and geopolitical risk combined with strong growth
Absent those, gold remains in a buy-the-dip regime.
________________________________________
✅ Bottom Line — Institutional Takeaway
Gold enters Q1 2026 with:
• A structural bid underneath price
• Convex upside risk on policy or geopolitical shocks
• Options-driven acceleration near key levels
This is not a market to fade strength blindly — it’s a market to manage exposure, harvest volatility, and accumulate on macro-supported pullbacks.
 Long
Long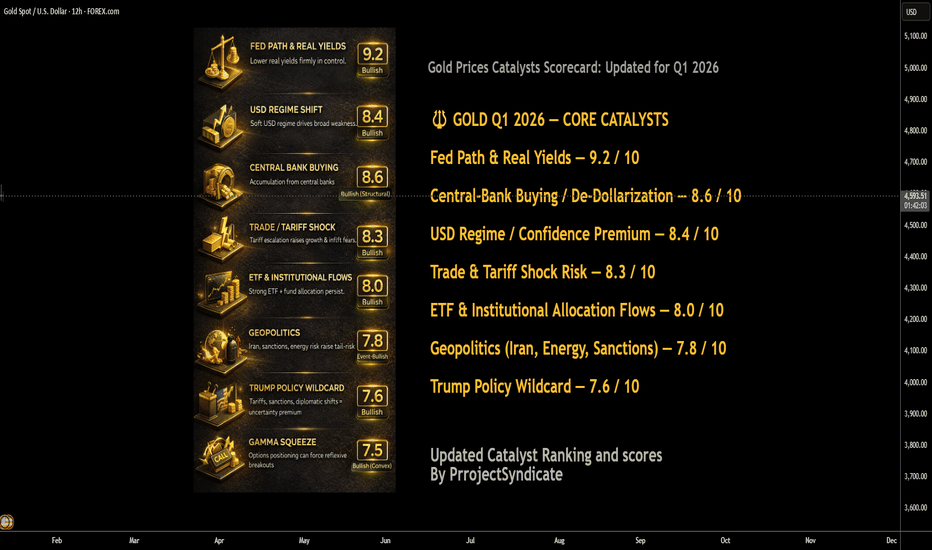
How Investment Funds Really Make Money From Bitcoin📰 After years of closely following financial markets, one conclusion has become impossible for me to ignore:
most people fundamentally misunderstand how professional funds make money from Bitcoin.
Retail traders often assume funds operate the same way they do — buying low, selling high, and betting on direction.
If price goes up, they win.
If price goes down, they lose.
That assumption is overly simplistic — and largely incorrect.
🔍 For institutional funds, Bitcoin is not a directional gamble.
From what I’ve observed, large funds are not emotionally attached to whether Bitcoin rises tomorrow or drops next week.
Price direction is not their primary concern.
What truly matters is structure.
Funds are not rewarded for guessing the market correctly.
They are rewarded for controlling risk and systematically converting volatility into measurable returns.
🎯 Their real objective is volatility, not conviction.
When a fund allocates capital to Bitcoin, it is rarely driven by belief in a narrative or excitement around headlines.
They don’t follow influencers.
They don’t react to social media hype.
What they care about is quantifiable price movement.
Volatility is the raw input.
Mathematical models are the engine.
Decisions are driven by numbers, not emotions.
🧠 Buying Bitcoin does not automatically mean being bullish.
One of the most common misconceptions I encounter is the idea that institutional buying signals an expectation of higher prices.
In reality, a fund can purchase Bitcoin while remaining entirely neutral.
They can be delta-neutral, fully hedged, detached from market direction, and protected against both upside and downside moves.
This is why buying BTC is not a bet for them.
It is simply the first layer in a multi-stage trading structure.
📊 So how do funds actually profit from price movement?
By combining spot exposure with derivatives, funds build positions that benefit from movement itself rather than predicting direction.
When price rises, positions are adjusted and partial exposure is sold at higher levels to rebalance risk and lock in gains.
When price falls, exposure is rebuilt at lower prices to restore balance.
🔁 Price moves higher → exposure is reduced at better levels
🔁 Price moves lower → exposure is increased at cheaper levels
🔁 The process repeats with discipline and precision, free from emotion
This systematic process is known as gamma scalping — the quiet, continuous profit mechanism behind institutional trading.
💰 Where do their real profits come from?
Not from news headlines.
Not from influencers.
Not from ETF narratives.
Profits are generated through continuous hedge adjustments, realized volatility exceeding expectations, direction-neutral structures, and strict mathematical discipline.
⛔ The only environment that truly challenges these strategies is when the market stops moving altogether.
🧭 Let me be direct with you, speaking as a market professional.
You are not BlackRock.
You do not have their infrastructure.
You do not have their capital, execution speed, or risk frameworks.
Attempting to interpret or replicate their actions without understanding the underlying structure will not improve your trading — it will only increase confusion.
✍️ My conclusion is straightforward:
Funds do not profit from predicting the future.
They profit from engineering outcomes.
They do not trade stories.
They do not trade emotions.
They do not trade social media noise.
🎯 They trade structure.
And you?
Stop obsessing over what institutions are doing.
Start focusing on what you should be doing.
That is the line between surviving in the market
and being quietly pushed out of it.  Education
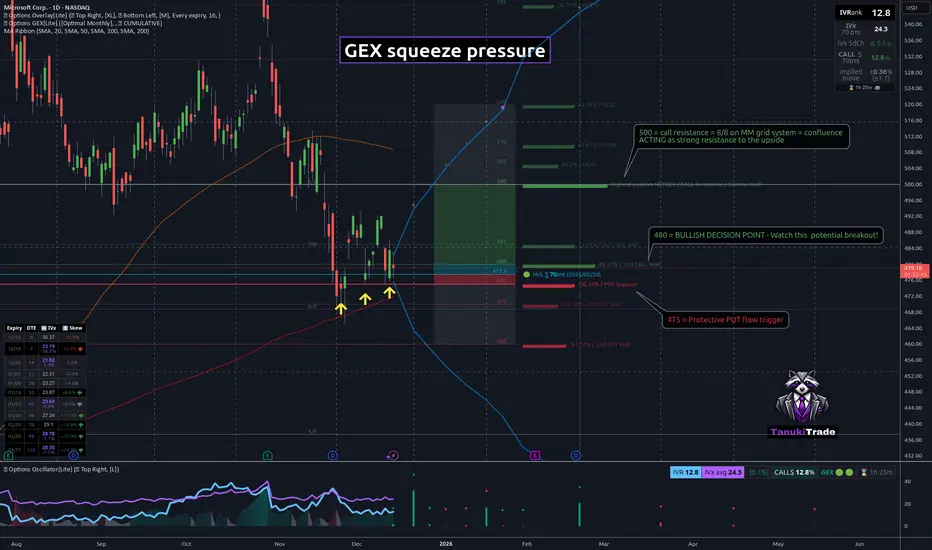
MSFT Potential Upside Squeeze SetupMSFT is currently forming a constructive structure with clearly defined levels.
On the downside, the 475 put support has been defended three separate times, signaling strong positioning interest and consistent absorption of selling pressure. Price continues to hold above the HVL , with an extremely narrow transition zone and a broadening upward-tilted positive GEX profile — all reinforcing structural stability.
If price breaks upward from the first call wall at 480 , this typically favors continuation rather than any sustained move lower.
Upside levels :
The next major call resistance sits at 500 — which also aligns with the 8/8 level on the MM grid system . This creates a very strong confluence, making 500 a significant resistance zone.
If price cleanly accepts and pushes through 500, dealer hedging flows can accelerate, potentially triggering an upside squeeze — with an initial upside extension capped near 520 .
If momentum continues to build above 500, the next substantial call resistance sits at 520 , currently the second-largest call wall on the chain.
As long as price remains above HVL and the 475 support zone holds, the risk-reward skew favors continuation to the upside, with 480 as the trigger level and 500 as the speculative call-positioning target .
However — critical risk scenario:
If 475 breaks and we do not see a fast rebound from the 470/460 negative squeeze zone , this could initiate a sharp downward move and a trend shift. Currently, the largest protective put concentration sits at 475 — and the put side only begins to melt if price can reclaim 480 .
At least based on the aggregated options chain, MSFT is now under immense compression with clear trigger points .
MSFT tightening under GEX squeeze pressure  Education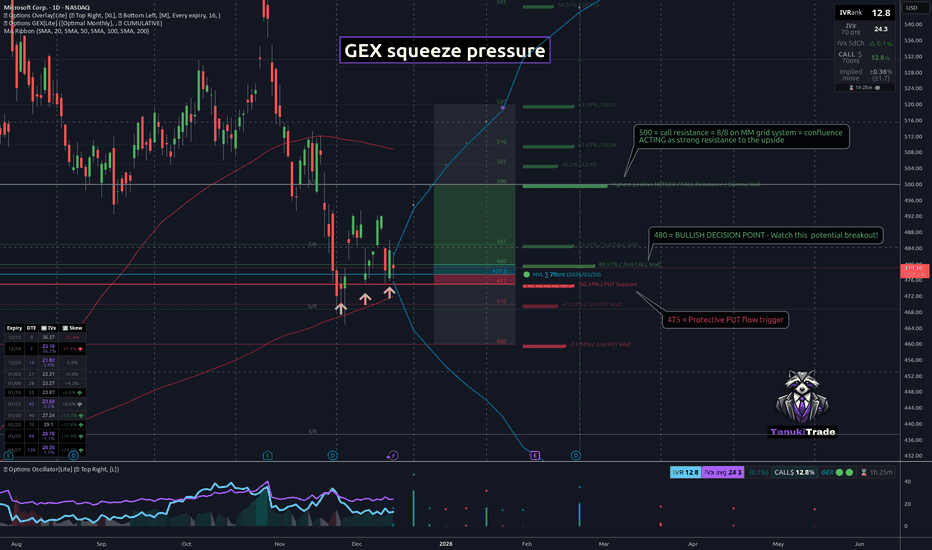
How Funds Actually Make Money From BitcoinIf you spend more than five minutes on Crypto TikTok (YouTube or X are not much different), you’d think the entire market depends on:
- who “bought the dip,”
- who “sold the top,”
- and which whale “decided” to pump or dump.
The screamers with flashy thumbnails and zero understanding yell:
- “BlackRock is buying—BULLISH!”
- “Whales are selling—CRASH INCOMING!”
- “Institutions are entering the market!!!”
- No nuance.
- No structure.
- No clue.
Because here’s the truth:
What BlackRock buys or sells is almost irrelevant to you.
Funds do not make money the way TikTok believes.
They don’t need Bitcoin to go up.
They don’t need Bitcoin to go down.
They need one thing:
Movement. Volatility. Math.
Let’s destroy the hype and show how funds actually make money.
1. Why “BlackRock is buying BTC” tells you absolutely nothing
Retail sees a headline:
“ETF inflows: +5,000 BTC today!”
And jumps to conclusions:
“They know something!”
“Price HAS to go up!”
“Institutions are bullish!”
No.
A fund can buy BTC and still be:
- 100% hedged
- delta-neutral
- directionally flat
- risk-neutral
- fully protected against price movement
The purchase is not a bet.
It’s a component of a structured position.
Buying BTC is just Step 1.
What matters is Step 2, 3, 4, 5…—all the parts TikTok doesn’t even know exist.
2. Why TikTok “analysts” have no idea what they’re talking about
If someone:
- screams in every video,
- says “bullish” or “bearish” 40 times a minute,
- thinks “institutions pump price,”
- doesn’t know what delta, gamma, basis, hedging, ATM straddles are…
…then they are not explaining institutional flow.
They are farming views and likes, not teaching markets.
Let’s be blunt:
If you can’t explain a delta-neutral hedge, your opinion about what BlackRock “plans to do” or "is doing" is worthless.
So let’s walk through how a real fund uses BTC to print money without caring if price goes up or down.
3. How a real fund makes money from volatility (step-by-step, using $100,000 BTC)
Assume:
- BTC price = $100,000
- A fund wants exposure to volatility, not direction
- They buy a BTC ATM straddle (call + put at 100k)
- Delta ≈ 0
- Gamma > 0 → the part that generates money
- They also own BTC spot for hedging.
- Let’s say the fund holds 1 BTC worth $100,000 as inventory for hedge adjustments.
At the start:
Delta-neutral. No directional risk.
Now let’s see how they profit.
Step 2 – BTC goes up 10% → $110,000
Straddle delta becomes +0.5 BTC.
The fund is unintentionally long 0.5 BTC.
To go back to neutral:
The fund sells 0.5 BTC at $110,000.
Cash received:
0.5 × 110,000 = $55,000
Theoretical cost basis (100k):
0.5 × 100,000 = $50,000
👉 Profit from hedge = $55,000 – $50,000 = $5,000
Plus, the straddle increased in value due to volatility.
Step 3 – BTC drops 10% → $90,000
Now straddle delta flips negative: –0.5 BTC
To get back to neutral:
The fund buys 0.5 BTC at $90,000.
Cash paid:
0.5 × 90,000 = $45,000
If they later sell that BTC at the baseline of 100k:
👉 Profit = $50,000 – $45,000 = $5,000
Again, without needing BTC to go up or down, “as predicted.”
This is called:
Gamma scalping — the quiet, relentless engine behind institutional P&L.
Up move → sell high.
Down move → buy low.
Repeat. Print. Sleep.
4. Where does the REAL profit come from?
A fund earns from:
- hedge adjustments (buy low, sell high, but mathematically—not emotionally)
- straddle appreciation as realized volatility exceeds implied volatility
- basis differences between spot and futures
- neutrality to direction, allowing consistent compounding
They make money even if Bitcoin swings between 95k–105k for weeks.
The only time they lose?
When BTC does NOT move.
Because then the straddle premium decays.
That's it.
Nothing to do with faith, predictions, narratives, influencers, or ETF flows.
5. So why should YOU ignore what BlackRock is doing?
Because:
- You are not BlackRock.
- You do not run a delta-neutral book.
- You do not make money from gamma exposure.
- You do not scalp intraday hedges on $100M positions.
- You do not capture basis spreads across spot and derivatives.
- You do not have a trading desk rebalancing risk every hour.
But the TikTok screamers will still tell you:
“Institutional buying = bullish!”
“Institutional selling = bearish!”
“Whales know something!”
They don’t know anything.
Especially not about institutional structure.
So here’s the punchline:
Watching what funds do—without understanding why they do it—is the fastest path to confusion in the best case and destruction in the worst.
You don’t have their:
- tools,
- capital,
- execution speed,
- risk models,
- mandate,
- or mathematical framework.
So trying to mimic them is not just pointless —it’s dangerous.
Final Lesson: Ignore the noise, ignore the hype, ignore the TikTok parade.
BlackRock doesn’t care about bull markets or bear markets.
BlackRock doesn’t need Bitcoin to moon.
BlackRock doesn’t panic when Bitcoin drops.
Because BlackRock doesn’t trade the story.
They trade the structure.
And unless you operate like a fund — stop pretending their moves matter to your trading.
You’re not them.
You don’t have their machinery.
You don’t have their volatility book.
So:
Stop watching what institutions do.
Start understanding what you should do.
That’s the difference between surviving and blowing up.
P.S: BlackRock and TikTok are used just as an example:) Education 
 Education
From Mystery to Mastery: Options ExplainedIntroduction: Why Options Feel Complicated
Options are perhaps the most misunderstood instruments in trading. To the untrained eye, they seem like an impossible puzzle: strange terminology, an overwhelming options chain filled with numbers, and payoff diagrams that bend in multiple directions. Many traders dismiss them as “too complex,” or worse, confuse them with gambling.
But options are not about chance — they are about choice. Each contract offers the trader a way to shape risk, control exposure, and adapt to unique market conditions. While this flexibility comes with greater sophistication, it also unlocks a toolkit that no other instrument can match.
The visuals you can see at the top of this publication — an options risk profile with multiple legs and a snapshot of an options chain — illustrate this dual nature. At first glance, the visuals are busy, packed with strikes, expirations, premiums, and curved payoff lines. Yet these are the very tools that make options versatile. They can be combined to express bullish, bearish, neutral, or volatility-driven views with precision.
The goal of this article is to take the mystery out of options and highlight why their complexity is worth understanding. Step by step, we’ll explore how they work, how the Greeks shape outcomes, how different strategies can be structured, and why they play such a vital role when layered onto futures trading.
What Are Options?
At their simplest, options are contracts that give the buyer the right, but not the obligation, to buy or sell an asset at a predetermined price within a specific time period. That asset may be a stock, a futures contract, or even an index.
Two Building Blocks
Call Options: Give the right to buy the underlying at the strike price. Traders buy calls when they expect the underlying to rise.
Put Options: Give the right to sell the underlying at the strike price. Traders buy puts when they expect the underlying to fall.
The Price of an Option: The Premium
Option buyers pay a premium, while option sellers collect it. This premium reflects the market’s assessment of risk and probability, and it changes constantly with price, volatility, and time.
Intrinsic vs. Extrinsic Value
Intrinsic Value: The amount an option would be worth if it were exercised immediately. For example, a call with a strike below the current price has intrinsic value.
Extrinsic Value: The “time value” built into the premium — compensation for the uncertainty of where price may go before expiration.
Why Options Matter
Unlike buying or selling the underlying directly, options allow traders to shape their exposure: define maximum risk, set conditional payoffs, or even profit from time decay and volatility changes.
The above options chain screenshot illustrates how layered this world can be. Rows of strikes, bid-ask quotes, open interest, and implied volatility may look daunting at first. But each piece of data contributes to building strategies that fit specific objectives.
The Greeks Made Simple
If the options chain is the menu, then the Greeks are the ingredients that determine how a position behaves. Each Greek measures a different sensitivity, helping traders understand not just what they are trading, but how it will move as conditions change.
Delta (Δ)
Measures how much an option’s price will change for a one-point move in the underlying asset.
A delta of 0.50 means the option should gain about 0.50 units if the underlying rises by 1.
Traders often use delta as a proxy for probability of finishing in the money.
Gamma (Γ)
Tracks how much delta itself will change as the underlying moves.
High gamma means delta can shift rapidly, often near at-the-money strikes close to expiration.
This makes gamma a key driver of volatility in option prices.
Theta (Θ)
Represents time decay — the amount an option loses each day, all else equal.
Options are wasting assets; as expiration approaches, time value shrinks faster.
Option sellers often seek to benefit from theta, while buyers must overcome it.
Vega (ν)
Measures sensitivity to changes in implied volatility (IV).
A higher vega means the option’s value rises more when volatility increases.
Since IV often spikes in uncertain times, vega is crucial for traders who position around events.
Rho (ρ)
Tracks sensitivity to interest rate changes.
While less relevant in low-rate environments, rho matters for longer-dated options.
Why the Greeks Matter
Taken together, the Greeks form a multidimensional risk profile. A trader isn’t just long or short — they are exposed to directional risk (delta), acceleration (gamma), time decay (theta), volatility (vega), and interest rates (rho).
The earlier options risk profile diagram illustrates how these forces combine in multi-leg positions. Each curve on the graph reflects the complex interplay of the Greeks, showing why mastering them is essential for managing sophisticated strategies.
Core Options Strategies
Options can be as simple or as sophisticated as a trader chooses. At their core, all strategies are built from just two instruments — calls and puts — yet when combined, they create a vast range of payoff structures.
Directional Strategies
Long Calls: Buying a call gives upside exposure with limited downside (the premium paid).
Long Puts: Buying a put provides downside exposure with limited risk.
These are straightforward but carry the burden of time decay (theta).
Income Strategies
Covered Calls: Holding the underlying asset while selling a call against it. This generates premium income but caps upside.
Cash-Secured Puts: Selling a put while holding cash collateral. If assigned, the trader buys the underlying at the strike price.
Risk-Defined Spreads
Vertical Spreads: Buying one option and selling another at a different strike in the same expiration. This defines both maximum risk and reward.
Iron Condors: A combination of spreads that profits if the underlying stays within a range. Risk and reward are defined upfront.
The above iron condor risk profile chart shows exactly how this works: profit is maximized in the middle range, while losses are capped outside the wings.
Why Structure Matters
Each strategy has its strengths and weaknesses, but the true value of options lies in their flexibility. Traders can design positions to fit directional views, volatility expectations, or income objectives — all with defined risk.
Options strategies are like tools in a kit: the more you understand their mechanics, the more precisely you can shape your market exposure.
Options on Futures
Most traders first encounter options through stocks, but options on futures open the door to even broader applications. While the mechanics are similar, there are key distinctions worth noting.
Underlying Differences
Stock options are tied to shares of a company.
Options on futures are tied to futures contracts — which themselves already embed leverage and expiration.
This layering adds both flexibility and complexity. A trader is essentially trading an option on a leveraged instrument.
Practical Use Cases
Hedging Commodity Risk: An airline might use crude oil futures to lock in prices, then overlay options to cap extreme scenarios while reducing hedging costs.
Speculating with Defined Risk: A trader bullish on gold can buy a call option on gold futures. The maximum loss is the premium, but the upside tracks leveraged futures moves.
Volatility Plays: Futures options often respond strongly to shifts in implied volatility, especially around key reports or geopolitical events.
Why They Matter
Options on futures give traders the ability to fine-tune exposures. Instead of committing to full futures leverage, a trader can scale in with options, controlling downside while keeping upside potential open.
They also broaden the range of strategies available. Futures already expand diversification; adding options introduces an entirely new layer of flexibility.
Index Options
Among the most widely traded options in the world are those based on equity indexes, such as the S&P 500 or Nasdaq-100. These instruments serve as essential tools for institutions and active traders alike.
Why Index Options Are Popular
Portfolio Hedging: Instead of hedging each stock individually, investors can use index puts to protect an entire portfolio.
Exposure Without Ownership: Index options allow participation in market moves without holding any individual company shares.
Liquidity and Depth: Index options often trade with deep volume and open interest, making them attractive for both large and small participants.
Volatility and the Options Surface
A key feature of index options is their relationship with volatility. The chart below — an implied volatility surface/skew diagram — shows how options with different strikes and maturities carry different implied volatilities.
Volatility Skew: Out-of-the-money puts often trade with higher implied volatility, reflecting demand for downside protection.
Term Structure: Near-term expirations may reflect event risk (such as earnings or Fed meetings), while longer maturities capture broader market uncertainty.
Why It Matters
Index options aren’t just directional bets. They are also instruments for trading volatility, sentiment, and risk itself. Institutions rely on them to hedge, while traders use them to capture shifts in implied volatility across strikes and expirations.
By understanding how skew and surfaces behave, traders can better interpret market expectations — not just where prices may go, but how uncertain participants feel about the path forward.
Risk Management with Options
Options provide unmatched flexibility — but that flexibility can tempt traders into overcomplicating positions or underestimating risk. Mastery comes from structuring trades with risk control at the core.
Defined vs. Undefined Risk
Defined-Risk Trades: Spreads and combinations such as verticals or iron condors cap both upside and downside. Maximum loss is known from the start.
Undefined-Risk Trades: Selling naked calls or puts exposes traders to potentially unlimited risk. While these strategies may generate steady premiums, one large adverse move can wipe out months or years of gains.
Managing Volatility Exposure
Volatility can shift rapidly, especially around earnings reports, central bank decisions, or geopolitical events.
A long option position benefits from rising implied volatility but suffers if volatility collapses.
A short option position gains from falling volatility but risks severe losses if volatility spikes.
Theta Decay and Time Management
Time decay (theta) erodes option premiums every day.
Buyers must ensure their directional or volatility edge is strong enough to overcome this drag.
Sellers must balance the benefit of theta decay against the risk of sharp, unexpected price moves.
Position Sizing Still Matters
Even defined-risk strategies can compound losses if oversized. Options’ leverage allows traders to control significant exposure with relatively small premiums, making discipline in sizing just as important as with futures.
The Core Principle
Options don’t eliminate risk — they reshape it. Effective risk management means choosing strategies where the risk profile matches your conviction, market conditions, and tolerance for uncertainty.
Common Mistakes New Options Traders Make
Options open powerful opportunities, but without structure, beginners often fall into predictable traps. Recognizing these mistakes is the first step to avoiding them.
Chasing Cheap Out-of-the-Money Options
Many new traders are attracted to options with very low premiums, believing they offer “lottery ticket” potential. While the payoff looks appealing, the probability of expiring worthless is extremely high.
Ignoring Implied Volatility
Price direction isn’t the only driver of option value. A trader might buy a call, see the underlying rise, yet still lose money because implied volatility dropped. Treating options as simple directional bets ignores one of their most critical dimensions.
Overusing Undefined-Risk Positions
Naked calls and puts can seem attractive because of the steady income from premium collection. But without defined risk, these trades can expose traders to devastating losses when markets move sharply.
Mismanaging Time Decay
Theta works against buyers, and new traders often underestimate how fast options lose value near expiration. Buying short-dated options without accounting for theta can erode capital even when the underlying moves in the expected direction.
Forgetting the Exercise and Assignment Process
Options on futures and equities alike can be exercised or assigned. New traders often overlook the obligations that come with short positions, leading to unexpected futures or stock exposures.
Takeaway
Every mistake above comes from misunderstanding what options truly are: instruments shaped not only by direction, but also by time, volatility, and structure. Avoiding these pitfalls is what separates those who dabble from those who progress toward mastery.
Conclusion: From Complexity to Clarity
Options may seem intimidating at first glance. The crowded options chain, the curved payoff diagrams, and the alphabet soup of Greeks can overwhelm even experienced traders. Yet within this complexity lies unmatched versatility.
Options allow traders to:
Define risk with precision.
Express bullish, bearish, or neutral views.
Trade volatility and time as independent variables.
Hedge portfolios against unexpected events.
The charts in this article — from the iron condor risk profile to the volatility skew surface — highlight the breadth of possibilities. They show why options are not a single strategy, but a toolkit that adapts to any market condition.
The challenge is not to memorize every strategy, but to understand how the pieces fit together: calls, puts, Greeks, spreads, volatility, and time. Once these elements stop being a mystery, options transform from a confusing maze into a structured path toward mastery.
This article completes our From Mystery to Mastery trilogy. We began with Trading Essentials, laying the foundation. We advanced into Futures Explained, exploring leverage and diversification. Now, with Options Explained, we’ve reached the most versatile and sophisticated layer of trading.
The journey doesn’t end here. Futures and options will always evolve with markets, offering new challenges and opportunities. But with a structured process, disciplined risk management, and the mindset of continuous learning, traders can move confidently — from mystery to mastery.
From Mystery to Mastery trilogy:
Options add a powerful layer of flexibility to trading, whether used for directional plays, income strategies, or hedging. Since many actively traded options are written on futures contracts listed on CME Group exchanges, it’s important to note that chart data can sometimes be delayed. For those who wish to analyze these products in real time on TradingView, a CME Group real-time data plan is available: www.tradingview.com . Traders focused on short-term options strategies, where timing and volatility shifts matter most, will find real-time access particularly valuable.
General Disclaimer:
The trade ideas presented herein are solely for illustrative purposes forming a part of a case study intended to demonstrate key principles in risk management within the context of the specific market scenarios discussed. These ideas are not to be interpreted as investment recommendations or financial advice. They do not endorse or promote any specific trading strategies, financial products, or services. The information provided is based on data believed to be reliable; however, its accuracy or completeness cannot be guaranteed. Trading in financial markets involves risks, including the potential loss of principal. Each individual should conduct their own research and consult with professional financial advisors before making any investment decisions. The author or publisher of this content bears no responsibility for any actions taken based on the information provided or for any resultant financial or other losses. Education 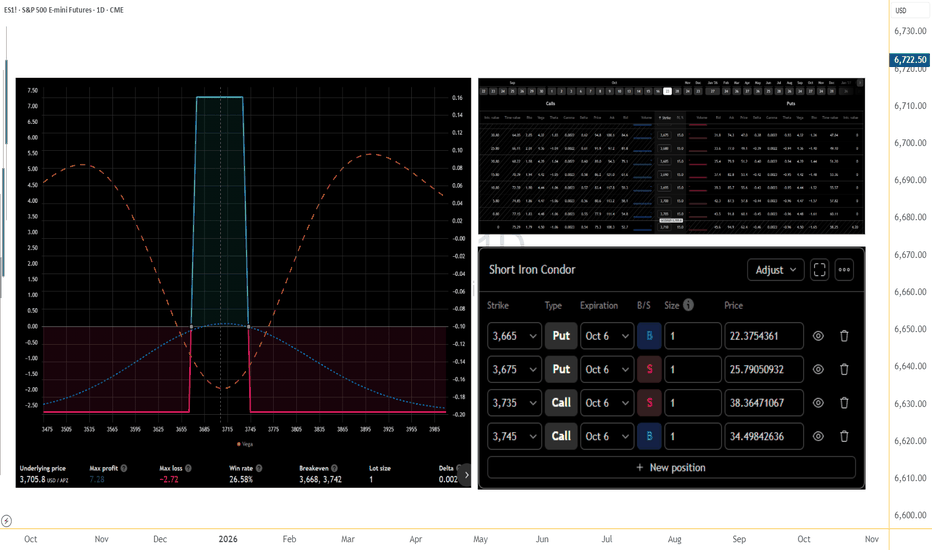
05/05 SPX Weekly Playbook - GEX Zone Outlook🔮 What-If Scenarios for This Week – Based on GEX Structure until Firday
Last week’s market momentum pushed the S&P 500 up by almost 3%, effectively erasing the price gap left behind on Liberation Day. The index also strung together nine straight days of gains—something we haven’t seen since late 2004.
Meanwhile, implied volatility dropped significantly, with the VIX touching its lowest level since the holiday, falling to around 22.5.
Several factors seem to have fueled this bullish tone, including a more measured approach from Trump on trade policies and strong quarterly results from major tech names like Microsoft and Meta.
Still, the nature of the buying raises questions—was this a thoughtful rotation, or just a broad sweep of optimism?
~~~~~~~~~~~~~~~~~~~~~~~~~~~~~~~~~~~~~~~~~~
🔄 Chop Zone: 5650 – 5670 (wide transition zone)
🔹 Gamma Flip: 5615
🔺 Key Call Wall: 5725 (5800 potential shift)
🔻 Key Put Wall: 5500 (5400 major support below)
🔼 Upside Path
IF > 5670 → transition cleared →
➡️ 5700 stall / reaction
IF > 5725 → call wall breached →
➡️ Path to 5750 / 5775 → stall at 5800 (largest net call OI)
IF > 5800 → gamma resistance breaks down →
➡️ 5825/5850 zone opens up
🔽 Downside Path
IF < 5615 → gamma flip triggered →
➡️ 5500 = battle zone (massive put wall + high negative GEX)
IF < 5500 → negative gamma squeeze likely →
➡️ Stall zone: 5450 → flush to 5400
IF < 5400 → high-volatility regime →
➡️ Possible acceleration to 5375 / 5340 depending on IV spike
⚖️ Neutral Setup
IF 5650–5670 holds → dealer hedging = balanced →
➡️ Ideal for non-directional spreads / theta plays
➡️ Wait for breakout confirmation above 5670 or below 5615
~~~~~~~~~~~~~~~~~~~~~~~~~~~~~~~~~~~~~~~~
🔍 Final Thoughts
We’ve seen a sharp rally since the Trump trade war scare, with barely any meaningful pullback. The market appears to be looking for one—as a breath. Based on current GEX positioning, there’s significantly more downside hedging than upside, especially in the mid-term May expirations.
That doesn’t necessarily mean we crash—but it does mean that moves lower can accelerate faster, while upward breakouts may require more energy or time. In this environment, consider:
Bearish or neutral spreads (put debit spreads, call credit spreads)
Volatility-based strategies
Avoiding naked upside trades unless we see a strong reclaim of 5725+
Stay safe and adapt—GEX doesn’t tell direction, but it does tell where the fire might start, beacuse of reflexting to hedging activity. GEX Analysis & Options “Game Plan”🔶 Short- and longer-term perspective in a high IV, negative GEX environment
🔶 KEY LEVELS & RANGES
Spot: 221
Gamma Flip / Transition: around 250 (the turquoise zone on the chart)
– This zone typically marks a “power shift.” If price decisively breaks above 250 and holds, market makers’ gamma positioning could flip from neutral/negative to positive.
Put Support: 200
– A large negative gamma position has accumulated here, making 200 a strong support level. If it breaks, the downside may accelerate.
Call Resistance: 400
– A major long-term “call wall” where a significant amount of OTM calls are concentrated. It’s more relevant to LEAPS; currently far from spot, so not a realistic short-term target.
Call Resistance #2: 300
– A medium-term bullish objective, still above the 200-day MA. You’d need to be strongly bullish to aim for ~300 by May (e.g., going for a 16-delta OTM call).
Short-Term / Intermediate GEX Levels:
– There are gamma clusters around 220–230 and 250–260 . These areas often see higher volatility, possible bounces, or stalls (chop) due to hedging flows.
🔶 WHATEVER SCENARIO – SHORT TERM (0–30 DAYS)
A) Upside Continuation / Rebound
– If TSLA closes above 225–230 , the next target is 240–250 (transition / gamma flip).
– If it breaks above 250 and holds (e.g., successful retest), market makers may shift to “long gamma,” fueling a quicker move to 260–270 .
– Resistance: 250, 300, with an extreme LEAPS-level at 400.
B) Downside Move / Bearish Break
– If price dips below ~220 and sustains, the next targets are 210–200 (major put wall / negative gamma).
– If 200 fails, negative gamma may magnify the sell-off. It’s an extreme scenario but still on the table given high IV and macro/geopolitical risks.
– Support: 210, 200 — likely stronger buying interest near 200, possibly a short-term bounce.
– The options chain suggests near-term hedging via puts for this scenario.
C) Chop / Sideways
– If TSLA stays in 210–230 , market makers (short options) might benefit from high IV/time decay.
– Negative GEX, however, can trigger sudden moves in either direction; caution is advised.
🔶 LONGER-TERM FOCUS (6–12 MONTHS, LEAPS)
NET GEX = -61.97M (negative territory) suggests longer-dated positioning is also put-heavy or carries notable negative gamma.
HVL / pTrans = 250 is a key pivot; cTrans+ = 400 is distant call resistance. Between these levels, there’s a mix of put/call dominance.
If Tesla undergoes a fresh growth phase (AI, robotaxi, energy storage, etc.) and clears 250/300 , 400 could become the next significant call wall — but that’s more of a multi-month horizon.
🔶 STRATEGY IDEAS (High IV Environment)
1. Short-Term Bearish
– If you’re bearish and expecting TSLA to test 220–210, consider a bear put spread or net credit put butterfly (lower debit) to leverage high IV.
– Targeting 200, but keep in mind negative gamma may accelerate downside movement.
2. Medium-Term “Contra” Bullish (bounce to 250)
– If GEX suggests a bounce off 210–220, consider a bull call spread (e.g., 220/240) or a net debit call butterfly (220/240/250).
– Be mindful of sudden swings, as we remain in negative gamma territory.
3. Longer-Term Bullish (>3–6 months)
– A call butterfly with upper strikes around 300–350 offers capped debit and higher potential payoff if a bigger rally materializes.
– A diagonal spread (selling nearer-dated calls, buying further-out calls) exploits elevated front-end IV.
4. Neutral / Range-Bound
– If TSLA stays in 200–250 , you could use Iron Condors (e.g., 200/260) to benefit from time decay and any IV collapse.
– Exercise caution: negative gamma can generate abrupt, directional moves, making a neutral stance riskier than usual.
🔶 ADDITIONAL NOTES & “BIG PICTURE”
High IV & Negative GEX: TSLA has a track record of large swings. Negative GEX can intensify sell-offs, while forced hedging might trigger rapid rebounds.
Preferred Structures: With expensive premiums, spreads (vertical, diagonal) and butterfly configurations generally fare better than plain long options (less vulnerable to time decay).
Potential Catalysts: AI announcements, Autopilot breakthroughs, new product lines, and macro changes can swiftly alter market dynamics. Keep tracking GEX updates and news flow; TSLA tends to respond dramatically to fresh developments.
🔶 Bottom line: From 221 spot, watch 210–200 on the downside and 240–250 on the upside short term. Medium-term bullish target = 300 , while 400 remains a far LEAPS scenario. High IV + negative gamma = fast, potentially volatile moves — so risk management and spread-based approaches are crucial. Long