Gartley
$103,000 Support is Your Next Long Entry!The chart shows a Bearish Harmonic Pattern (D point completed near $107,000), indicating the recent bullish momentum needs a rest.
We anticipate a short-term pullback following the completion of this pattern.
The target for this drop is the key support area (green box) around $103,000 - $103,500.
OBV also shows Bearish Divergence (price up, indicator down), which strongly supports the idea of a temporary pullback.
Wait for the price to hit the $103,000 support zone.
Look to enter a LONG tra
$CLSK: short term bullish Gartley NASDAQ:CLSK : bullish Gartley Harmonic has XD = 78.6%. NASDAQ:CLSK has exceeded this ratio slightly. Bullish Bat's XD ratio is 88.6%, this week's low aligns with this ratio.
The bullish Gartley appears to have completed and prices should start to recover.
If the broader market drops, AB = CD can target $13.50, which would present an excellent opportunity to add. I'll be adding to my position in the buy zone if the opportunity presents itself.
Additionally, the buy zone aligns with the
Bullish Gartley
1. Entry Zone
The ideal entry zone for a BUY order is the Potential Reversal Zone (PRZ) between 0.6485 and 0.6505. The current price of 0.64994 is perfectly within this zone, offering a potential entry.
2. Stop Loss
To protect against the pattern failing, a stop loss should be placed just below the X point of the pattern.
Stop Loss: Below 0.64433 (the X point). A logical level would be 0.6435.
3. Profit Targets (Take Profit Levels)
Targets are based on Fibonacci retracements of the entire
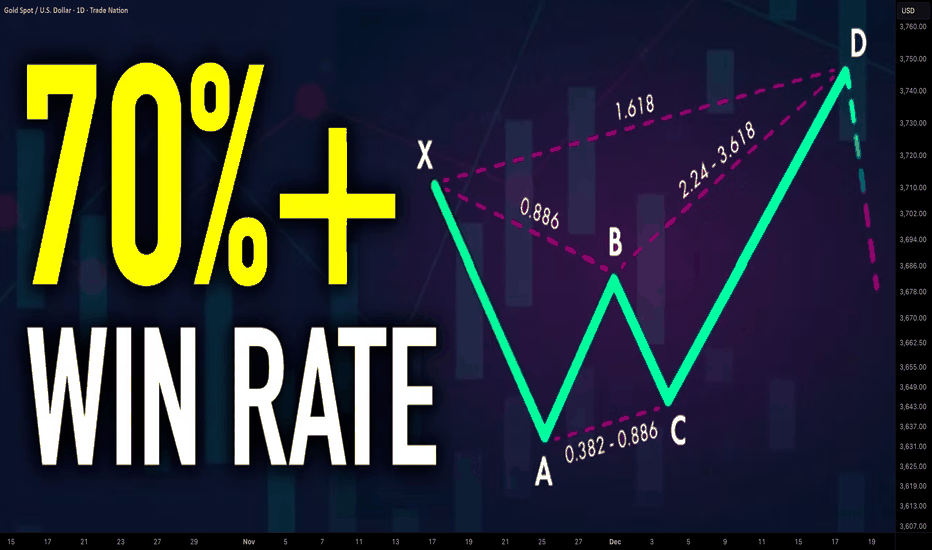
Best Harmonic Patterns For Beginners in Forex Gold Trading
In the today's article, I will share with you 4 best harmonic patterns for beginners. We will discuss the structure of each pattern and the rules.
Harmonic ABCD Pattern
That pattern is based on 3 legs of a price movement:
AB leg - impulse leg,
BC leg - retracement with the range of XA leg,
CD leg - impulse leg that has the same direction, the same time horizon and the same length as the XA leg
AB and BC legs should be equal or almost equal, that makes the pattern harmonic.
Bearish Gartley Pattern Trade Plan:
Entry Zone (PRZ): 1.170
Trigger: Bearish rejection candlestick(s) (e.g., Bearish Engulfing, Pin Bar, Doji) confirmed in the PRZ.
Direction: SELL
Stop Loss: Above the X point (invalidates the pattern).
Profit Targets (Take Gradual Profits):
TP1: 1.160
TP2: 1.158
Risk/Reward: The R/R is highly favorable, potentially above 1:2, depending on your primary target.
Rationale: The PRZ represents a significant area where multiple harmonic alignments converge. The move from B to
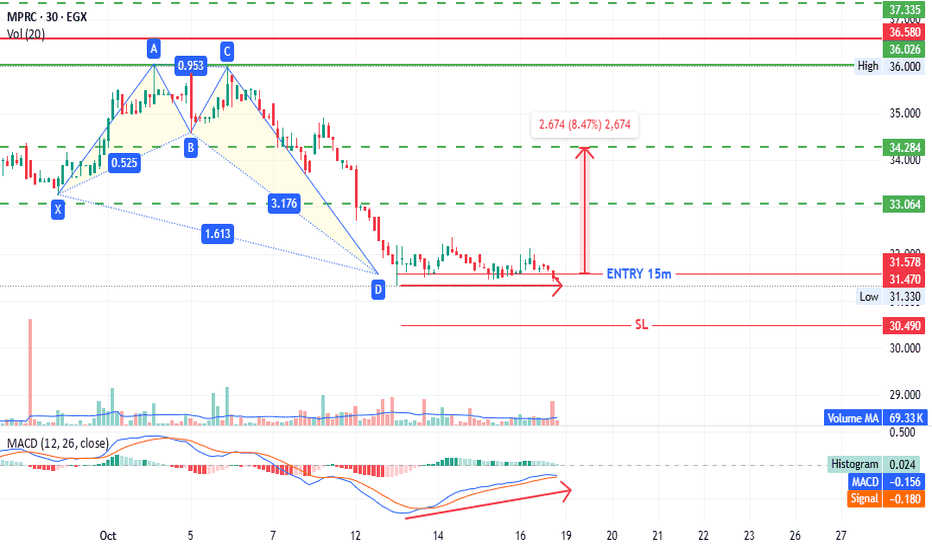
MPRC - is that end of correction ?! EGX:MPRC - EGX30 - Timeframe 30m
Format a Gartley bullish pattern as follows:
- Entry: 31.50 (current price: 31.47)
- Stop loss: 30.50 (potential loss: 3.50%)
- First target: 33.10 (potential profit: 4.70%)
- Second target: 34.25(potential profit: 8.50%)
also MACD is positive that may support our idea
This is not investment advice, only my analysis based on chart data.
Consult your account manager before investing.
Thanks and good luck.
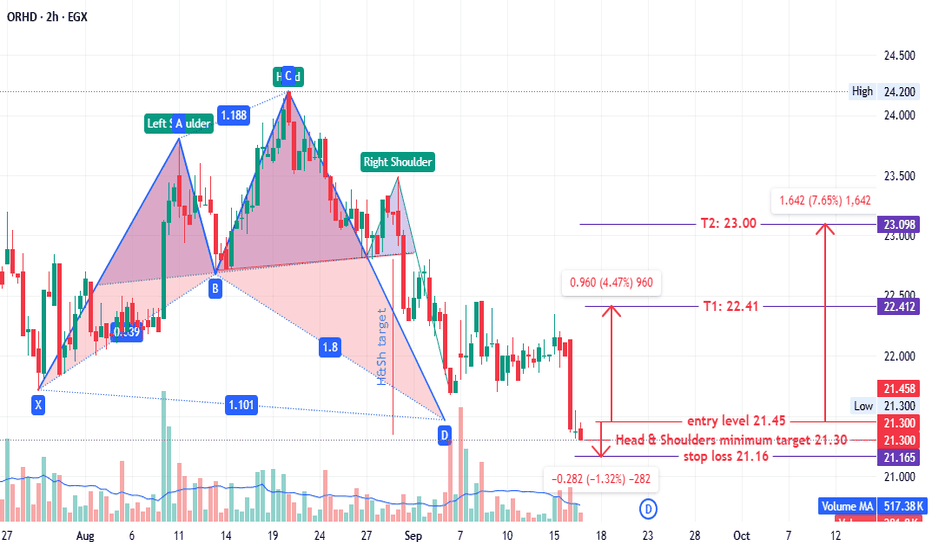
ORHD - EGX30 - Critical point , high risk EGX:ORHD - EGX30 - Timeframe 2 Hours
Prices achieved the minimum target for Head and Shoulders pattern at 21.30,
Moreover now prices Formatted a Gartley bullish pattern as follow:
- Entry: 21.45 (current price: 21.30)
- Stop loss: 21.16 (potential loss: 1.35%)
- First target: 22.41 (potential profit: 4.45%)
- Second target: 23.00 (potential profit: 7.60 %)
This is not investment advice, only my analysis based on chart data.
Consult your account manager before investing.
Thanks and good luck.
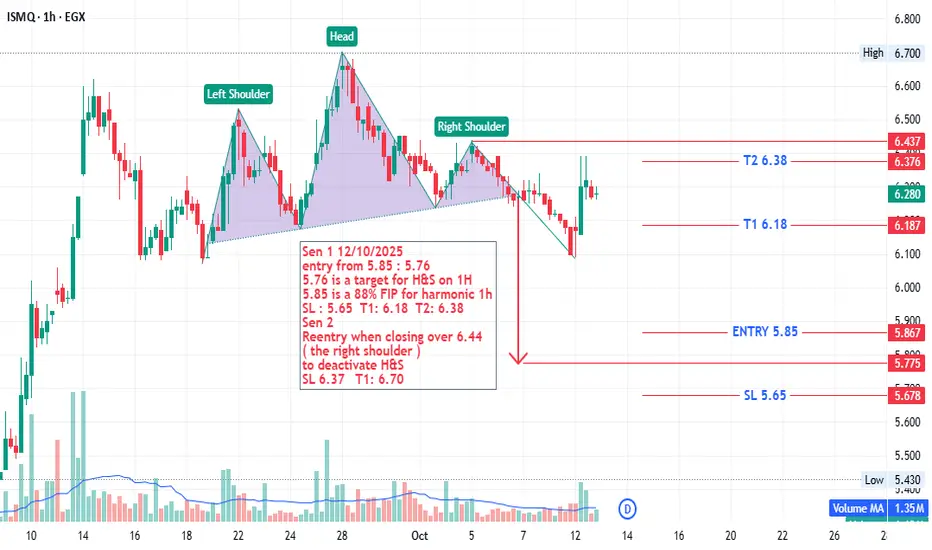
ISMQ - wait for action sen 1: 12/10/2025
Entry from 5.85 to 5.76
5.76 is a target for Head & Shoulders (H&S) on the 1-hour chart.
5.85 is an 88% Fibonacci retracement level (FIP) for harmonic patterns on the 1-hour chart.
Stop Loss (SL): 5.65 Target 1 (T1): 6.18 Target 2 (T2): 6.38
sen 2:
Re-enter when closing above 6.44 (the right shoulder) to deactivate the H&S pattern.
Stop Loss (SL): 6.37 Target (T1): 6.70
Its not an advice for investing only my vision according to the data on chart
Please cons
EUROD Stablecoin Debuts as ODDO BHF Enters Crypto MarketIn the evolving crypto market of October 2025, the launch of EUROD marks a pivotal moment as a major European financial institution enters the space with a euro-backed stablecoin. EUROD, designed as a compliant, low-volatility digital euro, is backed 1:1 with fiat reserves and aims to bridge traditional finance with blockchain, offering accessibility for retail and institutional users. This debut reflects the growing demand for regulated stablecoins in Europe, where the market cap has surpassed
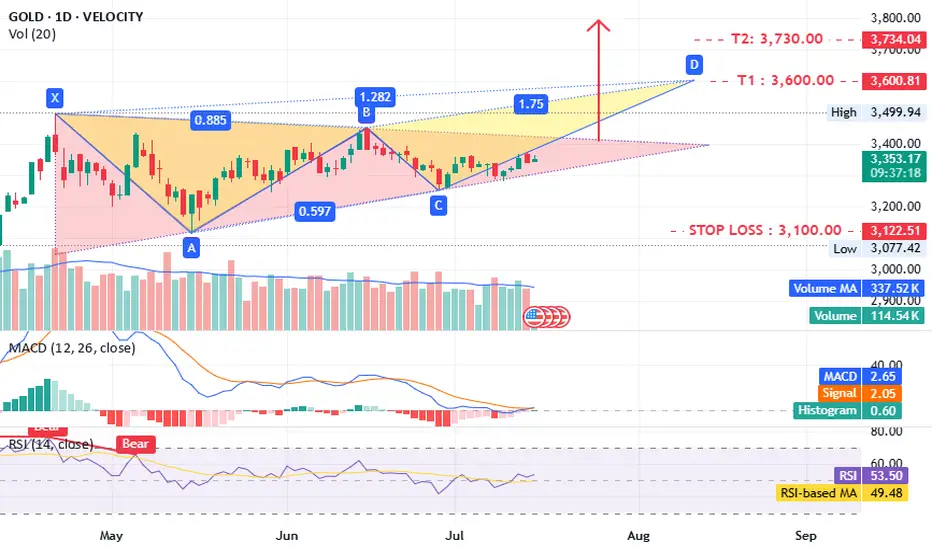
Gold what is next ?!!TVC:GOLD timeframe 1 day
is forming a potential triangle pattern, which could lead to a bearish setup.
The MACD and RSI indicators are positive, supporting this outlook. A close above 3400 would further confirm the idea.
Targets:
- T1: 3600
- T2: 3730–3800
Stop loss: 3100
Support: 3300–3260
Consider opening a long position now, with confirmation above 3400.
Disclaimer: This is not investment advice, only an analysis based on chart data. Consult your account manager before ma
M Gartley signals Trend ReversalOil downtrend channel has lasted a looooong time. Now a Gartley-M Harmonic Pattern is present which could signal a trend reversal... if it holds. Upside includes usual Gartley resistance levels and 1.618 resistance at USD 95.
Thank you for your attention to this matter!
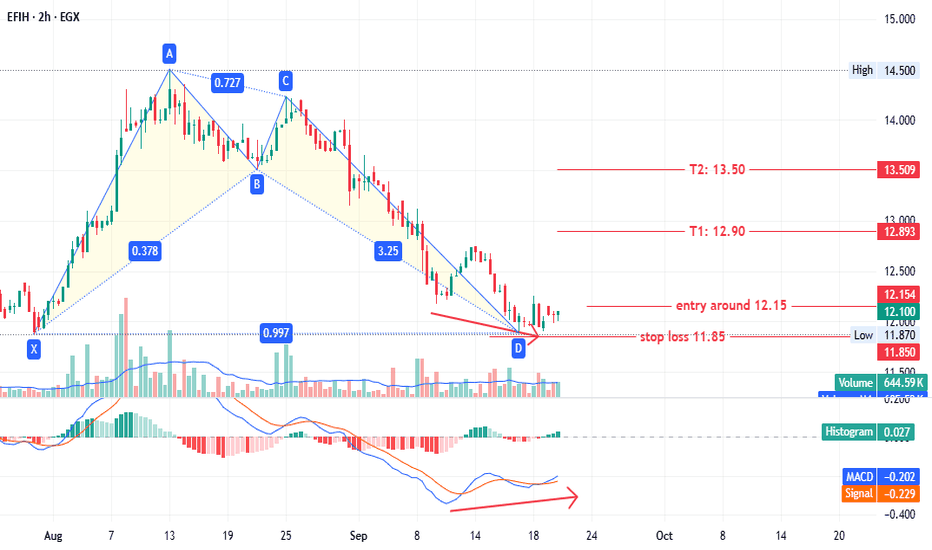
EFIH -EGX30 - great fundamental , low risk EGX:EFIH - timeframe 2 hours
A Bullish Gartley pattern was identified as follow:
entry around 12.15 ( prices now 12.10 )
stop loss 11.85 ( 2.25% potential loss )
first target 12.90 ( 6% potential profit )
secund target 13.50 ( 11% potential profit )
MACD showing a positive diversion that may support our idea
Its not an advice for investing only my vision according to the data on chart
Please consult your account manager before investing
Thanks and good luck
Gartley and math levels In this snapshot of price action on Brent crude we can see today would seem like an unqualified disaster for bulls. The pattern which has emerged from the chaos is an almost perfect gartley. If D anchor holds expect higher from here. Look for volume, rsi confluence.
The levels are precise mathematical and taken from highest volume not from high or low.
Fartcoin Wyckoff ReaccumulationCRYPTO:FARTCOINUSD looks to be in Wyckoff reaccumulation. Honestly, there’s nothing more to say, the chart speaks for itself.
We’re currently sitting in the spring zone, waiting for a bounce, retest, and move up. In my opinion, that should unfold over the coming months.
The risk here is that the spring I’m seeing might not actually be the spring, in that case, price could go lower. Still, I doubt it breaks below the current low; if it does, I’d say the downside risk sits around $0.5.
The tre
Elliott Wave + Gartley Harmonic: Why Bitcoin May Correct Soon!?Bitcoin( BINANCE:BTCUSDT ) has shown strong bullish momentum over the past week, climbing nearly +10% and testing key resistance zones . Several fundamental and technical factors fueled this rally.
Key Drivers of the Rise:
ETF inflows – Significant net inflows into spot Bitcoin ETFs boosted demand.
Macro uncertainty – U.S. government shutdown risk and weaker job data supported risk assets.
Monetary policy – Expectations of softer Fed policy improved market sentiment.
Derivatives
Binance Coin (BNB) Flips Ripple (XRP) Following Record-Breaking In the volatile cryptocurrency market of October 2025, Binance Coin (BNB) has achieved a historic milestone, surpassing Ripple's XRP in market capitalization for the first time since 2023, fueled by a record-breaking price surge. BNB reached a new all-time high of $1,300, pushing its market cap to $180 billion, while XRP's $178 billion cap reflects a 15% daily gain to $2.27. This flip, marking BNB as the third-largest cryptocurrency behind BTC and ETH, underscores the strength of the Binance eco
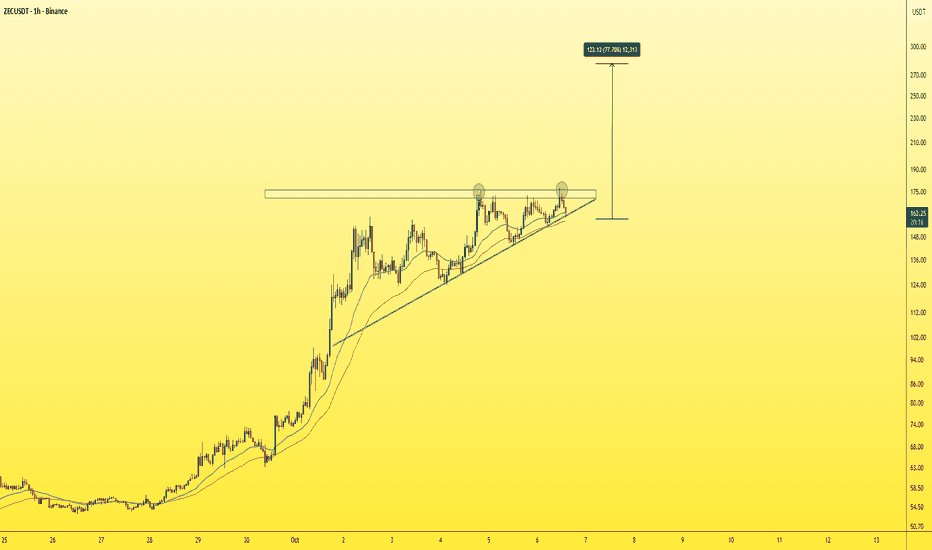
#ZECUSDT - Another leg up is aheadWe all saw a massive bullish in zec in previous days out of 260% instant bullish... and now it's in consolidation
it shows a symmetrical triangle pattern in hourly chart with 2 attempts of breakout ... third one must be work
the next station at ( 250 - 280$)
best Regards:
Ceciliones🎯